FSM — Finite-state Machine
A “finite-state machine” is also known to be called “finite automaton”, “finite-state automaton” or simply a “state machine”, being a “mathematical model of computation”. Being an abstract machine in exactly one of a finite number of states at some given time. The finite-state machine is known for being able to change from being in one particular state to another, doing it in response to some external inputs. Such change from one state to another is known to be called a “transition”. Any finite-state machine can be defined by its initial state, a list of its states and the conditions for each of the existing transitions.
The behaviour of any of the state machines can be checked by using many different devices in order to perform a pre-determined sequence of different actions, which may depend on a sequence of different events which they are presented with. The examples of the finite-state machine may be the vending machines, dispensing products once the proper combination of the coins is deposited. The elevators may be also a very good example of the finite-state machine, or FSM. The sequence of stops all the elevators make can be determined by the quantity of the floors requested by its riders. The traffic lights may be another example of the finite-state machines changing their sequence every time the cars have to wait stopping. All the combination locks require the input of the combination of the different numbers in some definite, proper order, that’s why they are a good example of the FSM as well.
The finite state machine is known to be having less computational power comparing to some other models of computation, for example, the so called “Turing machine”. The mentioned “computational power distinction” may mean there are the computational tasks that each Turing machine can do, but which a FSM one can not. The reason for this is a FSM's memory being quite limited by the number of the states which it has. The finite-state machines are known to be studied in the more general field of the so called “automata theory”. The complete action's information is never described in the table, but it can only be added by using the so called “footnotes”. A FSM definition is always possible by using the so called “state tables”.
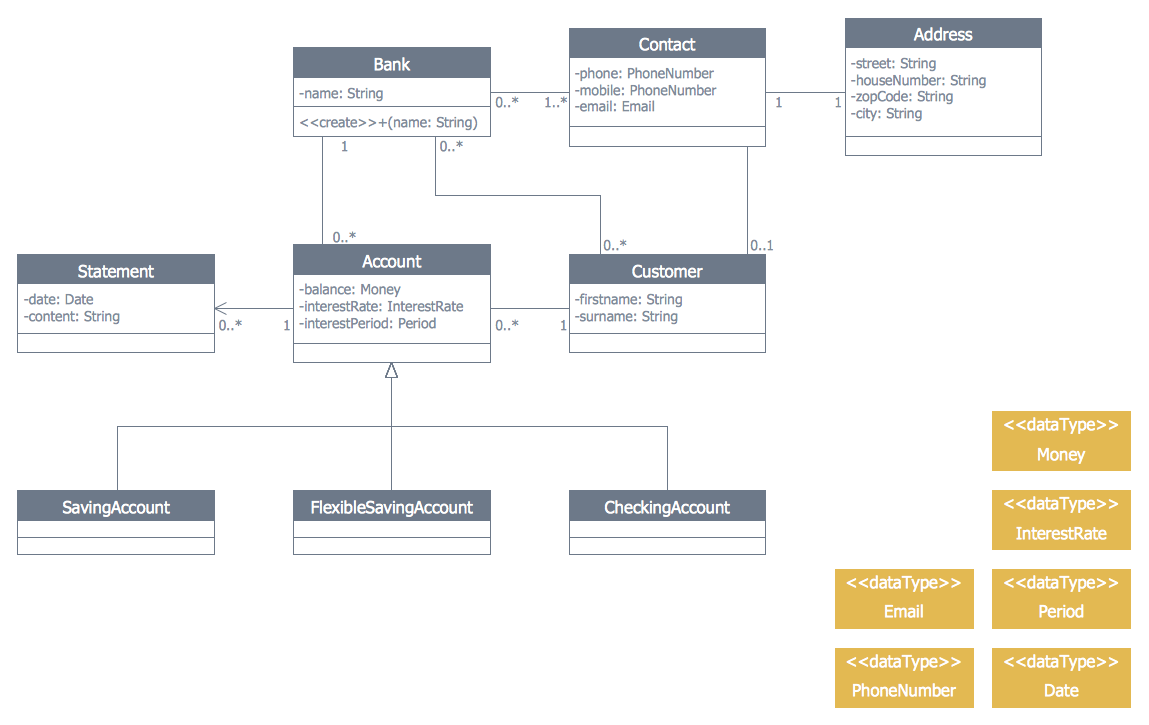
The Unified Modelling Language has a notation for describing state machines. UML state machines are known to be introducing the new concepts of the so called “hierarchically nested states” as well as “orthogonal regions” during the process of extending the so called “notion of actions”. UML state machines have the characteristics of both “Mealy machines” and so called “Moore machines”, known to be supporting the actions depending on the triggering event as well as on the state of the system, as well as entry and exit actions, which are associated with states rather than transitions.
The Specification and Description Language is a standard from ITU. It includes numerous graphical symbols for describing different actions in the transition – for example, to send an event, to start a timer, to cancel a timer, to receive an event, to start another state machine, etc. There are many different variants used for representing a FSM, knowing to be significant in many different areas, including electrical engineering, computer science, mathematics, philosophy, biology, logic, linguistics, etc. One of the classes of the automata studied in the so called “automata theory” as well as the “theory of computation” is a finite state machine, widely used in computer science for modeling the application behaviour, for designing different hardware digital systems, as well as used in software engineering, network protocols, the study of computation, languages and compilers.
It is possible to subdivide the finite state machines into acceptors, classifiers, transducers and sequencers. The acceptors are also known to be called as “recognizers and sequence detectors”, producing the binary output and indicating if received input is accepted or not. Each of the possible states of any FSM is either "not accepting" or "accepting". As long as all input is received, in case its current state is an accepting one, then the input is known to be “accepted”. And vice versa, in case its current state is a rejecting one, then it is known to be “rejected”. As a general rule, any input is a sequence of symbols and actions are not normally used.
A set of the mentioned symbol sequences is known to be called as a “regular language”, but only in case there is some finite state machine that accepts exactly that set. For example, the set of binary strings with an even number of zeroes is a regular language, while the set of all strings which length is a prime number is not a regular language. A machine can be described as the one containing a string, which is accepted by the mentioned machine, but not the rejected ones. Thus, that language is known to be "accepted" by the machine, called the “regular languages”. Any language is known to be called as “regular” in case there is some finite-state machine accepting it. An instance of the algebraic path problem is determining the language which was accepted by a so called “finite state acceptor”. It is itself simply a generalization of the shortest path problem to graphs with edges which are weighted by the elements of a semi-ring.
To create FMS diagram, all you need is ConceptDraw DIAGRAM diagramming and drawing software. It is always better, though, to have a Specification and Description Language (SDL) Solution from ConceptDraw STORE application to simplify your work with drawing any FMS related drawings any complexity as the mentioned solution offers the pre-made examples as well as the stencil libraries with the design elements that all can be used while working in ConceptDraw DIAGRAM

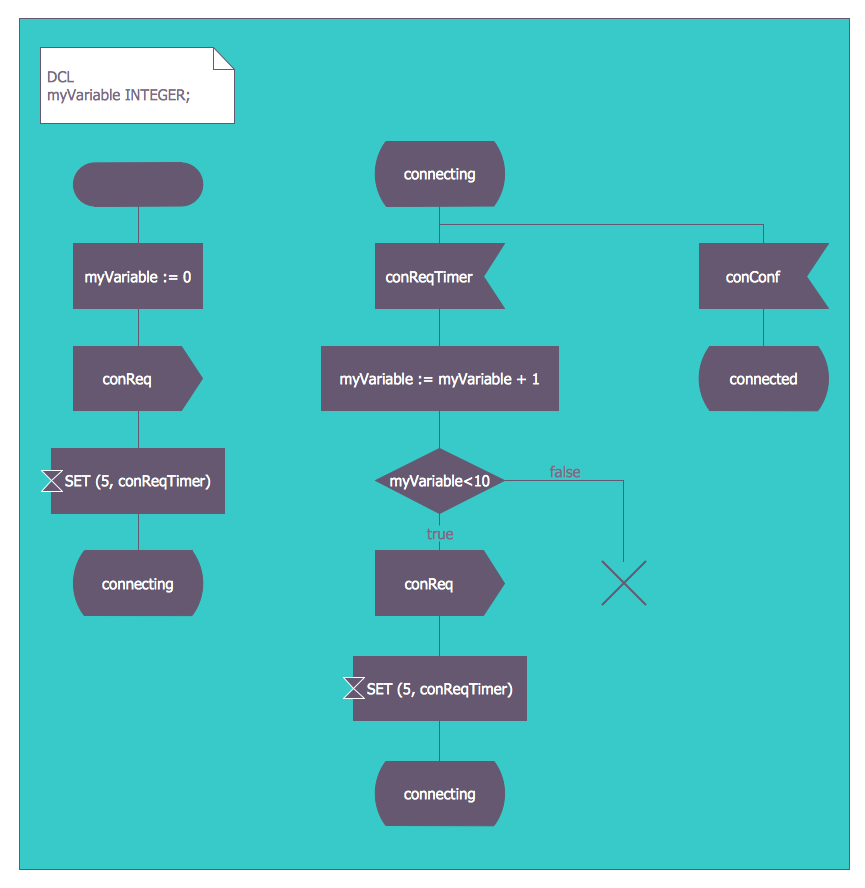
Example 1. Finite State Machine (FSM) Diagram
Finite state machines are widely used in systems engineering, system design, in developing computer programs and sequential logic circuits. Specification and Description Language (SDL) Solution offers all needed tools for designing without efforts. These are the SDL Connnectors and SDL Diagrams libraries which contain numerous predesigned vector objects, collection of FSM and SDL samples represented in ConceptDraw STORE.
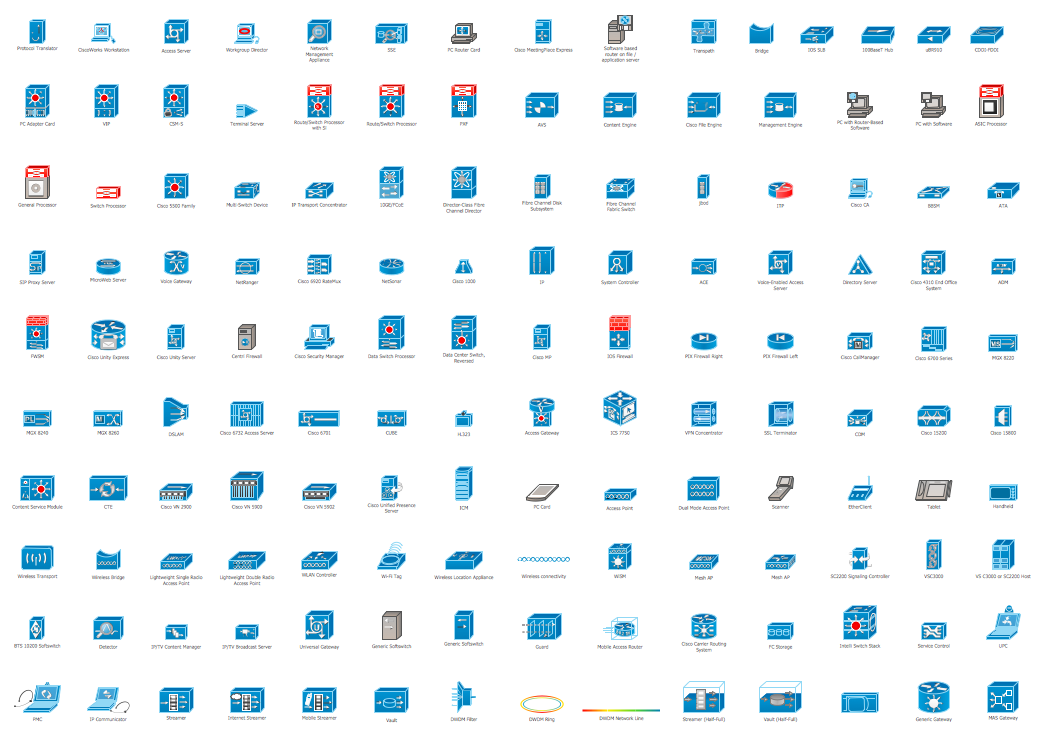
Example 2. Specification and Description Language (SDL) Solution in ConceptDraw STORE
All samples included in Specification and Description Language (SDL) Solution are well thought-out and professionaly designed. You can choose any desired of them from ConceptDraw STORE, it will be automatically opened in ConceptDraw DIAGRAM Then you are able to change some details in it or use the sample as the base for your own FSM diagram.
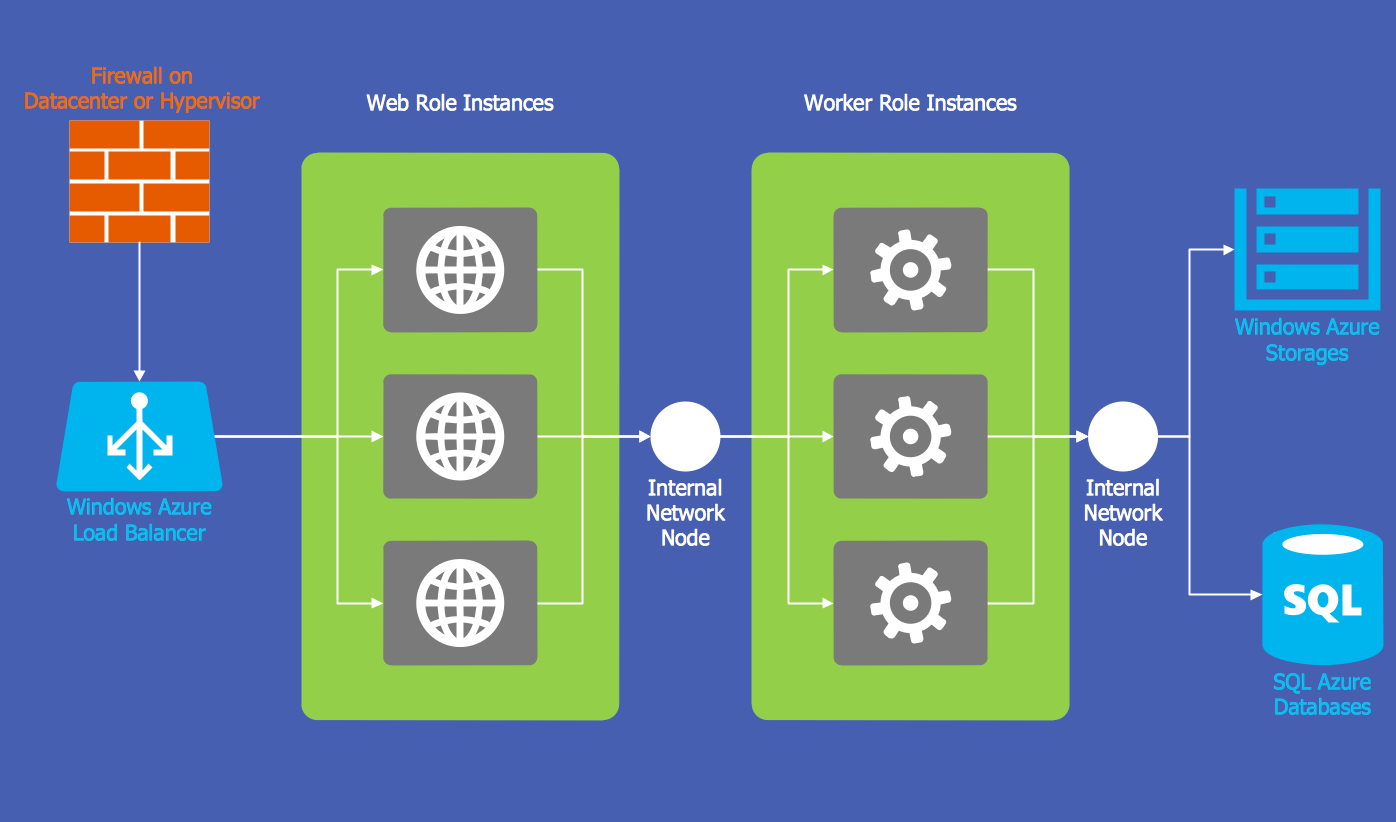
Example 3. SDL Architecture
The samples you see on this page were created in ConceptDraw DIAGRAM software using the tools of Specification and Description Language (SDL) Solution. First of them demonstrates the Finite State Machine (FSM) diagram, the second represents the SDL architecture and describes the processes within the sub-blocks also with help of finite state machines. An experienced user spent 10-20 minutes creating each of these samples.
Use the Specification and Description Language (SDL) Solution for ConceptDraw DIAGRAM software to create your own professional looking FSM and SDL diagrams fast, easy and effective.
All source documents are vector graphic documents. They are available for reviewing, modifying, or converting to a variety of formats (PDF file, MS PowerPoint, MS Visio, and many other graphic formats) from the ConceptDraw STORE. The Specification and Description Language (SDL) Solution is available for all ConceptDraw DIAGRAM users.
TEN RELATED HOW TO's:
Symboles Organigramme →
Les organigrammes sont parfaits pour représenter visuellement des processus operationnels. Par exemple, si vous avez besoin d'afficher le flux d'un processus d'ordre personnalisé par l'entremise de divers opérateurs au sein de votre organisation, vous pouvez utiliser un organigramme. Voir aussi d'autres symboles organigramme: Symboles ordinogramme standard, symboles du flux de travail, Vérification Les symboles du schéma fonctionnel, sOrganigramme comptables des symboles, Organigramme de vente des symboles, Symboles pour organigramme des RH, Carte des symboles de processus, Diagramme de processus opérationnels, Symboles utilisés dans le schéma IDEF0.
Flowchart Software →
Describing a workflow or approval process can take hours and be too complicated, especially since there are options to do it quickly and vividly. Diagrams called flowcharts replace long paragraphs of boring text and represent information in a graphic way. You can draw one on paper or you can use flowchart software to do it quickly and scalable. This kind of software is easy to use and you don’t need any special skills to start using it. In addition, there are a lot examples and predesigned templates on the Internet. Flowcharts are a best tool for staking out a huge and complex process into some small readable parts. Surely, flowcharts can be drawn manually but the use of standard symbols that make it clear for a wide audience makes a software tool preferred for this task. The core for a successful flowchart is its simplicity. That is why often before beginning making flowchart through software, people draw the sketch on a piece of paper. Designing an effective flowchart means the combination of the data needed to be shown and the simplicity with which you depict it.
Finite State Machine →
You need design a Finite State Machine (FSM) diagram and dream to find a powerful software to make it easier? ConceptDraw DIAGRAM extended with Specification and Description Language (SDL) Solution from the Industrial Engineering Area of ConceptDraw Solution Park is the best software for achievement this goal.
Mechanical Drawing Symbols →
To maintain big and complex mechanical systems, you need an appropriate education and tools. It’s needless to say that mechanical drawing is important part of any industrial project. There are a lot of standard symbols depicting valves, pumps, motors, etc. This drawing illustrates the content of the Fluid Power Equipment library provided by the ConceptDraw Mechanical Engineering solution. The solution is composed from the 8 libraries, containing about 500 elements related to mechanical engineering visualization. it will be helpful for drawing various schemes, charts and blueprints of pneumatic, and hydraulic equipment or other drawing related mechanical engineering. All drawings can be freely resized without loss of quality due to the vector graphics components of its facilities.
Process Flowchart →
When trying to figure out the nature of the problems occurring within a project, there are many ways to develop such understanding. One of the most common ways to document processes for further improvement is to draw a process flowchart, which depicts the activities of the process arranged in sequential order — this is business process management. ConceptDraw DIAGRAM is business process mapping software with impressive range of productivity features for business process management and classic project management. This business process management software is helpful for many purposes from different payment processes, or manufacturing processes to chemical processes. Business process mapping flowcharts helps clarify the actual workflow of different people engaged in the same process. This samples were made with ConceptDraw DIAGRAM — business process mapping software for flowcharting and used as classic visio alternative because its briefly named "visio for mac" and for windows, this sort of software named the business process management tools. This flowchart diagram shows a process flow of project management. The diagram that is presented here depicts the project life cycle that is basic for the most of project management methods. Breaking a project into phases allows to track it in the proper manner. Through separation on phases, the total workflow of a project is divided into some foreseeable components, thus making it easier to follow the project status. A project life cycle commonly includes: initiation, definition, design, development and implementation phases. Distinguished method to show parallel and interdependent processes, as well as project life cycle relationships. A flowchart diagram is often used as visual guide to project. For instance, it used by marketing project management software for visualizing stages of marketing activities or as project management workflow tools. Created with ConceptDraw DIAGRAM — business process mapping software which is flowcharting visio alternative or shortly its visio for mac, this sort of software platform often named the business process management tools.
Systems Engineering →
Systems engineering is an interdisciplinary field of engineering that focuses on how to design and manage complex engineering systems over their life cycles. ConceptDraw DIAGRAM supplied with SysML Solution from the Software Development Area of ConceptDraw Solution Park is a powerful and effective systems engineering software.
Circuits and Logic Diagram Software →
A circuit diagram is sometimes also called an elementary diagram, electronic schematic or electrical diagram circuits. It is essential in construction of any electronic equipment. Among many digital drawing tools available, ConceptDraw DIAGRAM is a leading circuits and logic diagram software, affording for easy and quick creation of even the most advanced and complex diagram designs. This makes it a perfect choice for computer science and any kind of electronic engineering. This drawing includes the graphic symbols that may be in use while creating a logic circuit diagram. The diagrams of such kind are used in the electronics industry. The logic symbol depicts a device that realizes a Boolean type functions. Practically a logic symbol means transistor, diodes, relays, and other mechanical or optical details which provide function of closing or opening "gates". Totally the logic circuits can involve millions of gates. ConceptDraw Electrical Engineering solution gives the opportunity to create a circuit diagrams both simple and difficult.
Interior Design. Site Plan — Design Elements →
Aside from decorating inner spaces, which is a realm of interior design, the art of exterior design is about home facades, playgrounds and yards. To start a project, first of all, you need a site plan of the place, and a list of customers’ requirements. With special software you can do a plan of any place like parking, interchange or driveway easily. There is one of the three libraries supplied with ConceptDraw Site Plans solution. It is designed to draw planning areas adjacent to buildings. For example parking, exit road or house territory for rest. This kind of building plans can be used for providing parking control that helps to organize traffic near residential areas. The well considered road planning will improve safety and will help to manage the number of vehicles near buildings. The ConceptDraw library "Parking and Roads" includes vector graphic images of parking spaces, lots and strips as well as street junctions, driveways and interchanges.
Technical Drawing Software →
Every engineering project starts from a terms of reference document. The next stage of developing is a technical drawing, which requires using appropriate software. However, revisions and discussions about requirements are possible at any stage of development. This technical drawing demonstrates a schematic flow diagram of pulp reclaiming. This diagram of magnetite pulp reclaiming is created using ConceptDraw Chemical and Process engineering solution, The solution delivers more than 460 vector graphic icons and connectors. Generally, it is intended for designing process and instrumentation diagrams (P&ID) for chemical and process engineering. block flow diagrams (BFD), process flow diagrams (PFD) for chemical industry.
UML Tool & UML Diagram Examples →
You can use many tools to create a representation of a system behavior or a scheme of objects relationships. Some of them are quite abstract and useless, and some, like UML tools help clarifying both the structure and the behavior of a system. There are various types of uml diagrams and tons of examples explaining the difference between them. UML 2.2 specification has many kinds of diagrams. They are divided into two groups( structure and behavior diagrams). This class diagram shows the hierarchical structure of UML 2.2 specification. Class diagram - the most suitable tool for this task because it is designed to describe basic structure of a system. This diagram can be use as a visual aid for learning UML.