Business Intelligence Dashboard Software
Sales Dashboard Solution
ConceptDraw DIAGRAM is a software for making BI dashboards that provide effectiveness to your enterprise. The Sales Dashboard Solution allows managers to use live data to drive dashboards that show company performance in a wide variety of graphs. The clean and dynamic dashboard objects are driven by data files, and are updated automatically as the data changes.
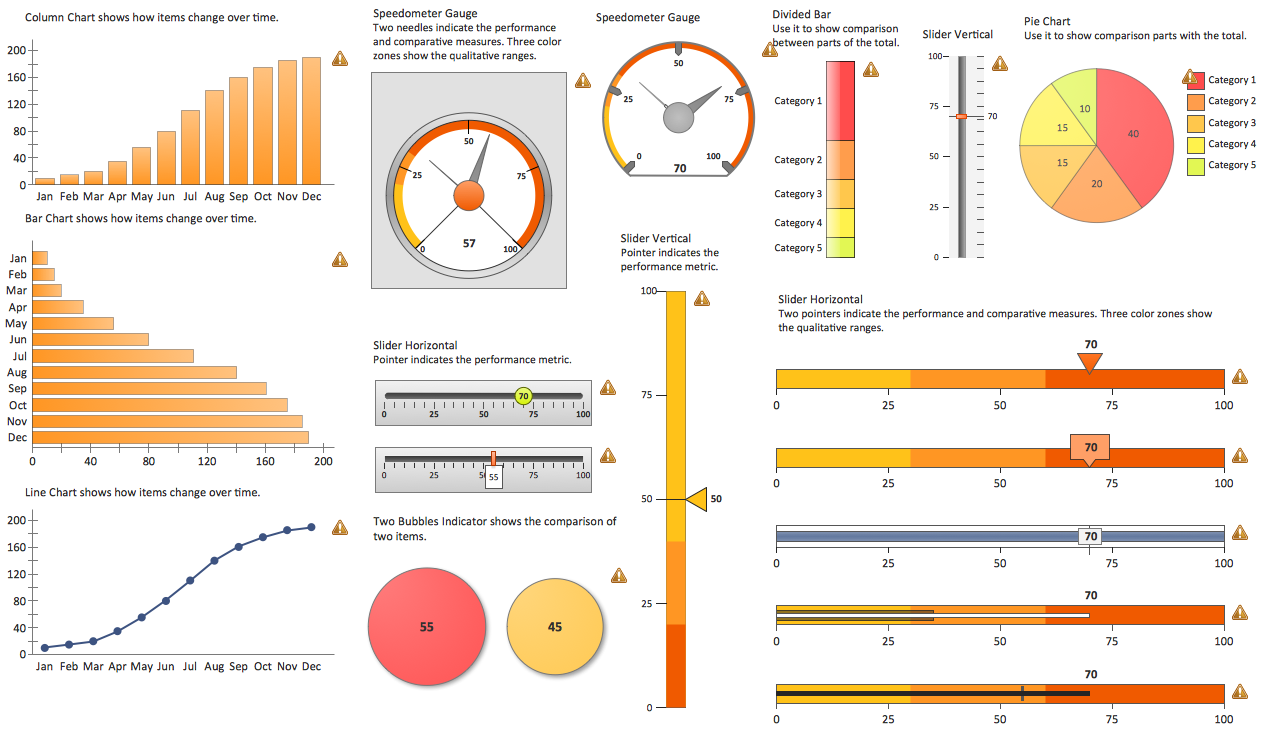
Pic. 1. Sales Dashboard - Design Elements
THREE RELATED HOW TO's:
ConceptDraw DIAGRAM diagramming and vector drawing software supplied with Sales Dashboard solution provides the full set of useful tools which make it the best for producing the live KPI Dashboard of any complexity.
Picture: KPI Dashboard
Related Solution:
ConceptDraw DIAGRAM diagramming and vector drawing software extended with Target and Circular Diagrams solution from the Marketing area of ConceptDraw Solution Park is perfect for the Circular Flow Diagram creating.
Picture: The Circular Flow Diagram
Related Solution:
No need for any special drawing skills to create professional looking diagrams outside of your knowledge base. ConceptDraw DIAGRAM takes care of the technical details, allowing you to focus on your job, not the drawing.
ConceptDraw DIAGRAM delivers full-functioned alternative to MS Visio. ConceptDraw DIAGRAM supports import of Visio files. ConceptDraw DIAGRAM supports flowcharting, swimlane, orgchart, project chart, mind map, decision tree, cause and effect, charts and graphs, and many other diagram types.
Picture: MS Visio Look a Like Diagrams
ConceptDraw
DIAGRAM 18