
Example 1. Circular Diagram - Grant Life Cycle
Target and Circular Diagrams Solution provides a Circular Diagrams library with ready-to-use 42 vector objects for easily drawing any imaginable Circular Diagram.

Example 2. Circular Diagrams Library Design Elements
All these objects are vector, you can resize them without loss a quality, change colors to make your Circular Diagram more bright, colorful and attractive. Several of these objects gives you the possibility to change the number of their elements.

Example 3. Circular Diagram - Loyalty
Pay also attention for the collection of predesigned Circular Diagram samples included in Target and Circular Diagrams Solution. They are good examples of successful Circular Diagrams, any of them can be used as is or as the base for making your own Circular Diagram.

Example 4. Circular Diagram - The Content Marketing Cycle
The Circular Diagram samples you see on this page were created in ConceptDraw DIAGRAM using the Target and Circular Diagrams Solution for ConceptDraw DIAGRAM Solution Park. These diagrams successfully demonstrate solution's capabilities and professional results you can achieve. An experienced user spent 5 minutes creating every of these samples.
Use the Target and Circular Diagrams Solution for ConceptDraw DIAGRAM software to create your own professional looking Circular Diagram of any complexity fast and easy.
All source documents are vector graphic documents. They are available for reviewing, modifying, or converting to a variety of formats (PDF file, MS PowerPoint, MS Visio, and many other graphic formats) from the ConceptDraw STORE. The Target and Circular Diagrams Solution is available for all ConceptDraw DIAGRAM or later users.
TEN RELATED HOW TO's:
A database is a data collection, structured into some conceptual model. Two most common approaches of developing data models are UML diagrams and ER-model diagrams. There are several notations of entity-relationship diagram symbols and their meaning is slightly different. Crow’s Foot notation is quite descriptive and easy to understand, meanwhile, the Chen notation is great for conceptual modeling.
An entity relationship diagrams look very simple to a flowcharts. The main difference is the symbols provided by specific ERD notations. There are several models applied in entity-relationship diagrams: conceptual, logical and physical. Creating an entity relationship diagram requires using a specific notation. There are five main components of common ERD notations: Entities, Actions, Attributes, Cardinality and Connections. The two of notations most widely used for creating ERD are Chen notation and Crow foot notation. By the way, the Crow foot notation originates from the Chen notation - it is an adapted version of the Chen notation.
Picture: ERD Symbols and Meanings
Related Solution:
Create your own Linux audit flowcharts using the ConceptDraw DIAGRAM diagramming and vector drawing software extended with the Audit Flowcharts solution from the Finance and Accounting area of ConceptDraw Solution Park.
This flowchart example describing auditd, the linux audit tool.
Picture: Linux Audit Flowchart Example. Flowchart Examples
Related Solution:
ConceptDraw DIAGRAM diagramming and vector drawing software extended with tools of Flowcharts Solution from the Diagrams Area of ConceptDraw Solution Park ideally suits for fast and easy Online Flow Chart designing. We propose to verify this right now.
Picture: Online Flow Chart
Related Solution:
Diagramming is an astonishing way to visualize business processes. The list of the most common business process flowchart symbols is quite long starting from basic flowcharts, continuing with SIPOC diagrams. Business process modeling was never easier than now, with special ConceptDraw Business Process Mapping solution.
To carry out all professional standard requirements for business processes mapping, it is necessarily to follow the special graphical notations. ConceptDraw Business Process Mapping solution offers an exhaustive suite of tools to aid business process mapping. There are three vector libraries SIPOC Diagrams, Business Process Flowcharts, and Swim Lanes that contains totally more than 50 symbols of standard BPM notations. This is all that professionals need to effectively evaluate and manage quality in business processes.
Picture: Business Process Flowchart Symbols
Related Solution:
Process Flow Charts are very popular and widely used in chemical and process engineering for representation a general flow of plant processes and equipment. If you need often draw them, the ConceptDraw DIAGRAM diagramming and vector drawing software extended with tools of Flowcharts Solution will be useful for you.
The mostly used set of process flow chart symbols includes the following: Rectangle (box) process flow chart symbol, Rounded rectangle, Circle, Diamond.
Picture: Process Flow Chart Symbol
Related Solution:
The vector stencils library SSADM from the solution Systems engineering contains specific symbols of SSADM diagrams for ConceptDraw DIAGRAM software.
Picture: SSADM Diagram
As concept map consists from conception-blocks and links between them, you can use ConceptDraw library objects and add to a document as much objects as you need. ConceptDraw tools let you to edit, group, move objects, change their appearance and add text signs and raster or vector pictures.
ConceptDraw DIAGRAM diagramming and vector drawing software extended with Concept Maps Solution from the Diagrams Area is effective tool for creating professional looking Concept Maps.
Picture: Concept Maps
Related Solution:
Pyramid chart example is included in the Pyramid Diagrams solution from Marketing area of ConceptDraw Solution Park.
Picture: Pyramid Diagram
Related Solutions:
Near field communication (NFC) is a wireless communication technology that allows smartphones and other similar devices to establish the radio communication with each other on the short distance around 10 centimeters (4 inches).
This example was created in ConceptDraw DIAGRAM using the Computer and Networks Area of ConceptDraw Solution Park and shows the Near field communication (NFC) network.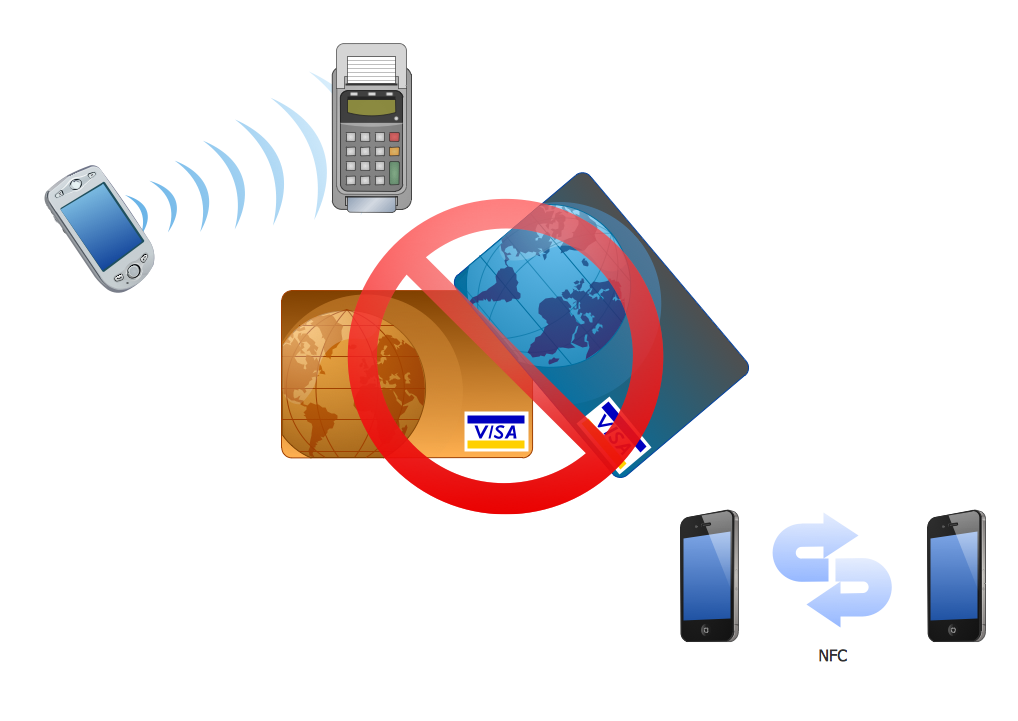
Picture: Near field communication (NFC). Computer and Network Examples
Related Solution:
UML Collaboration Diagram illustrates how components are wired together to larger components and software systems that shows the structure of arbitrarily complex systems.
ConceptDraw has 393 vector stencils in the 13 libraries that helps you to start using software for designing your own UML Diagrams. You can use the appropriate stencils of UML notation from UML Collaboration library with 36 objects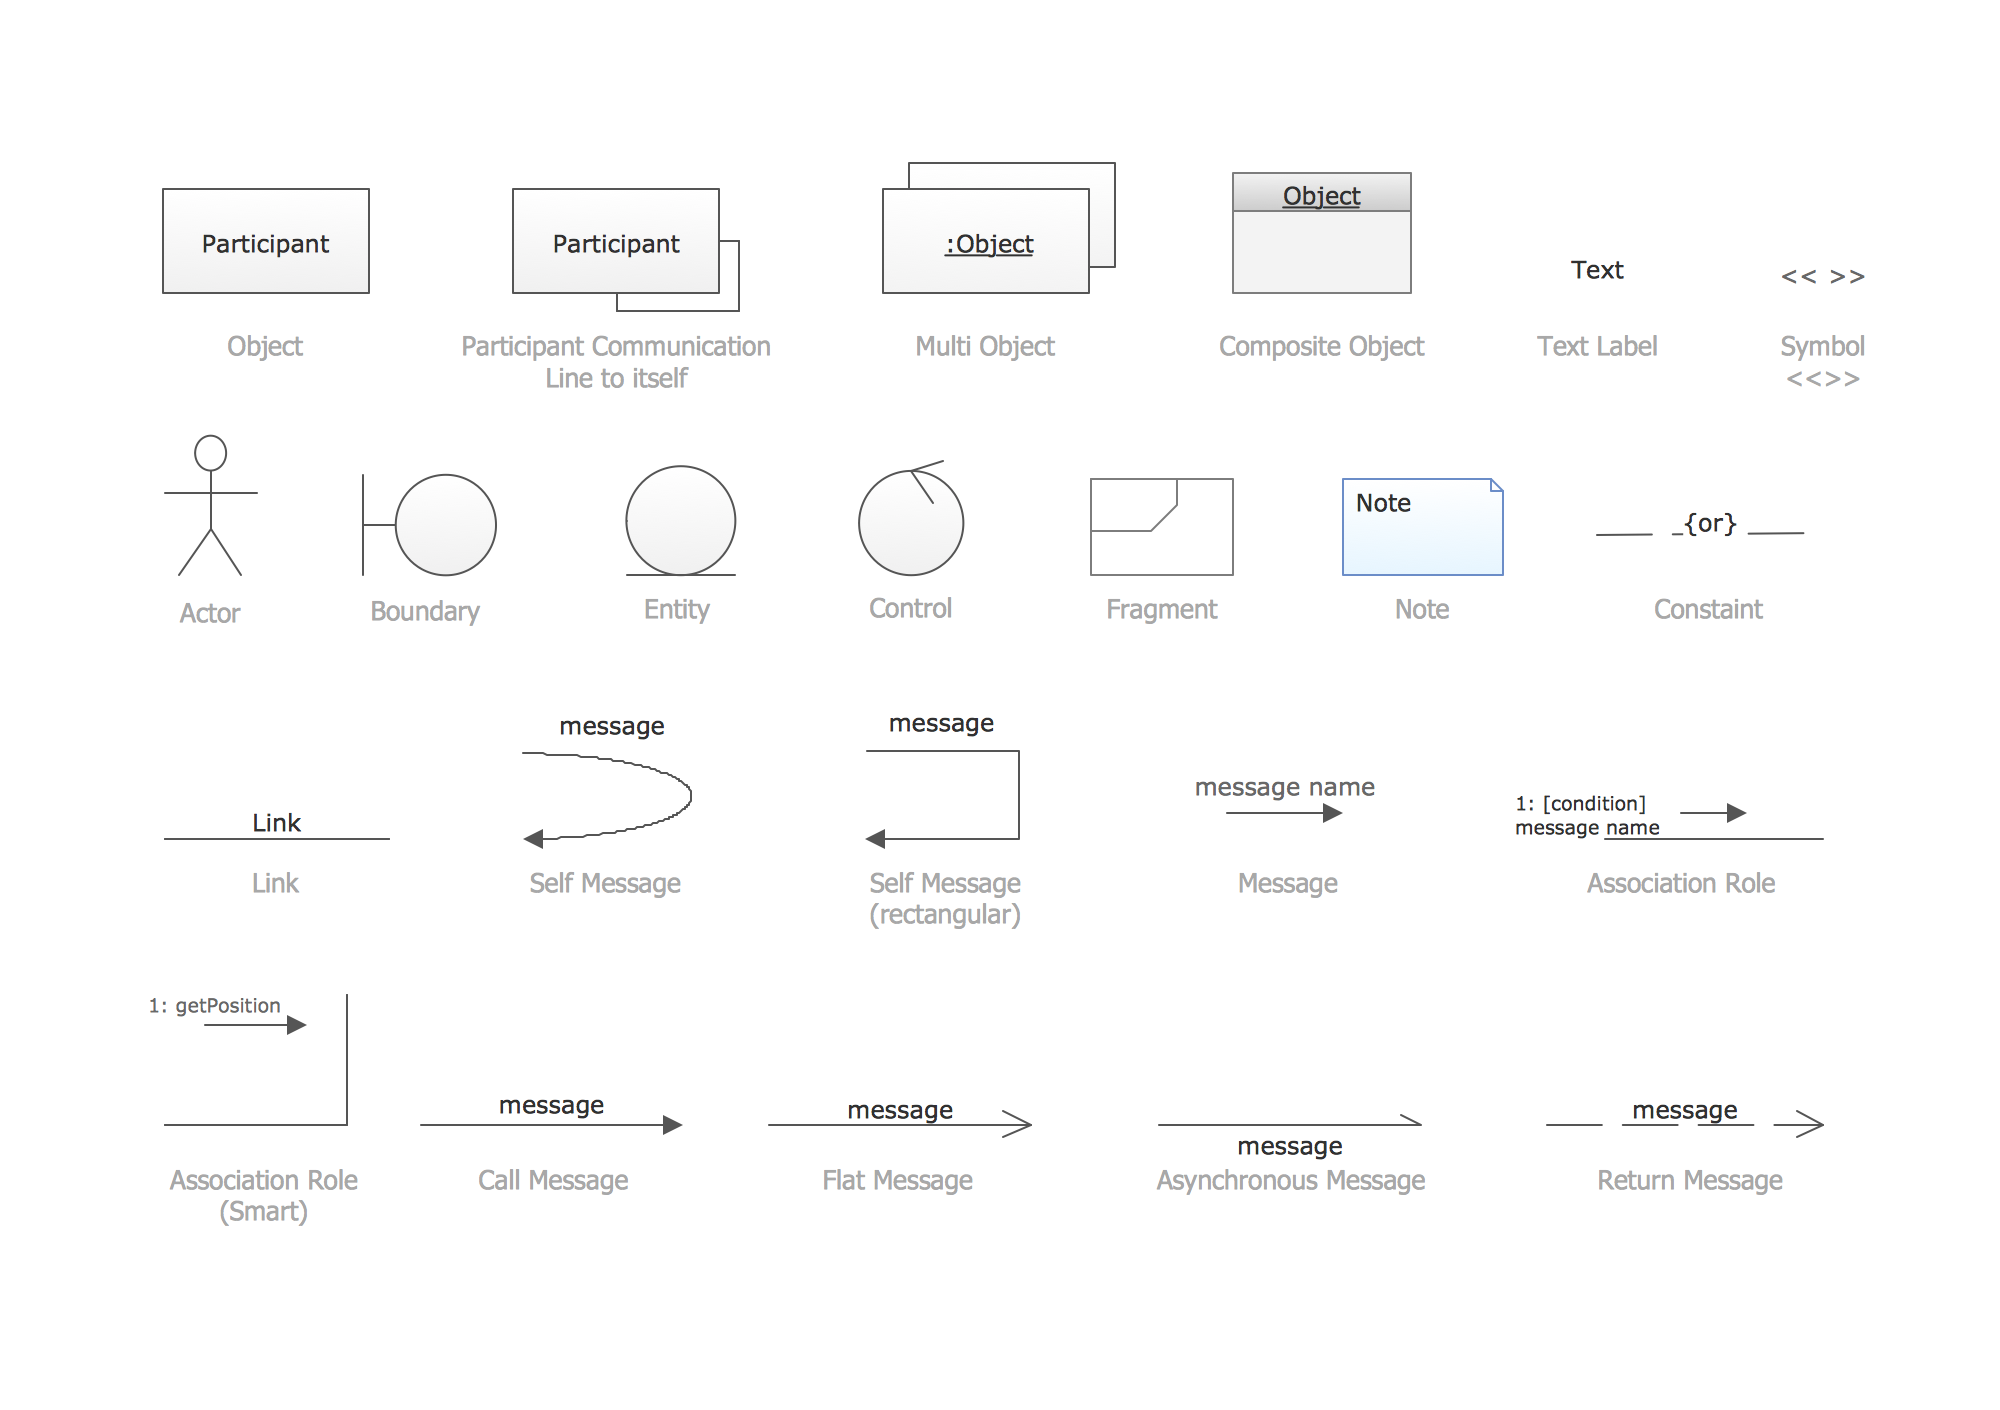
Picture: UML Collaboration Diagram. Design Elements
Related Solution:


