Made with
ConceptDraw
DIAGRAM 18

Examples Flowchart

ConceptDraw DIAGRAM diagramming and vector drawing software provides the unique Flowcharts Solution from the "Diagrams" Area of ConceptDraw Solution Park with variety of vector objects libraries and collection of examples Flowchart. Each example flowchart included in Flowcharts solution is a real help in drawing process, it can be the good base or perfect source of inspiration.

Examples Flowchart *

Example 1. Examples Flowchart - Basic Flowchart

The examples flowchart developed and included in Flowcharts Solution are available for viewing and editing from ConceptDraw STORE which is incredibly convenient for navigation through ConceptDraw Solution Park, all solutions libraries, templates and samples.

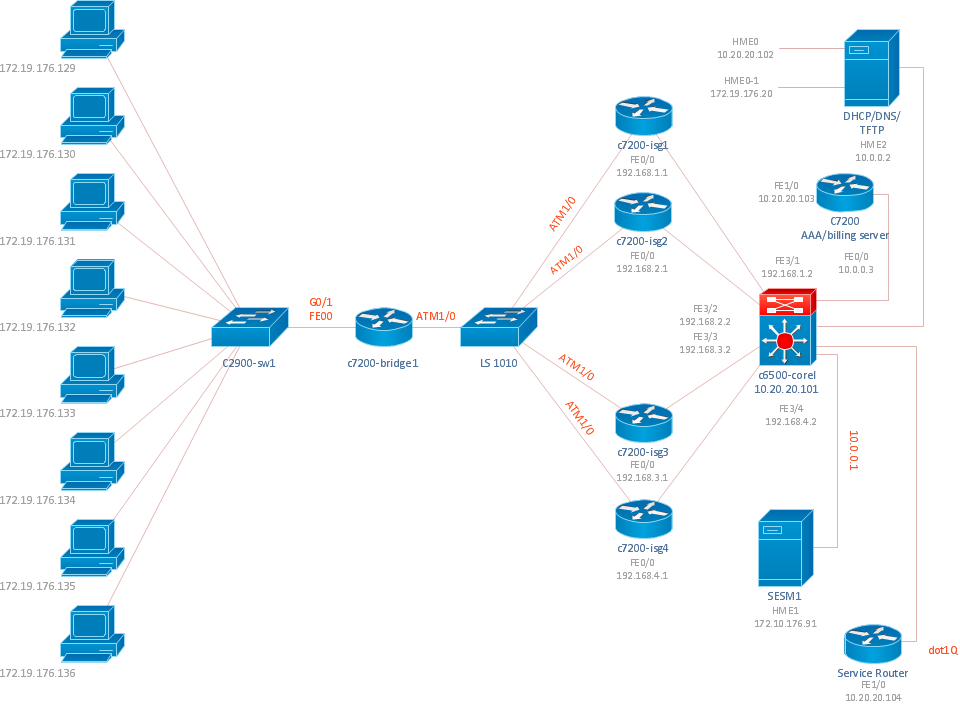
Depending on the aims and needs are used the flowcharts of various types. Some special types of flowcharts are represented here, you can click to enlarge images:

Look at these examples flowchart and more other represented in ConceptDraw STORE, they are professional looking, bright, beautiful and attractive. They are also understandable for all thanks to the use of commonly used flowchart objects which are predesigned and available from Flowchart and Flowcharts Rapid Draw libraries of Flowcharts solution.

Flowcharts Solution in ConceptDraw STORE

Example 2. Flowcharts Solution in ConceptDraw STORE

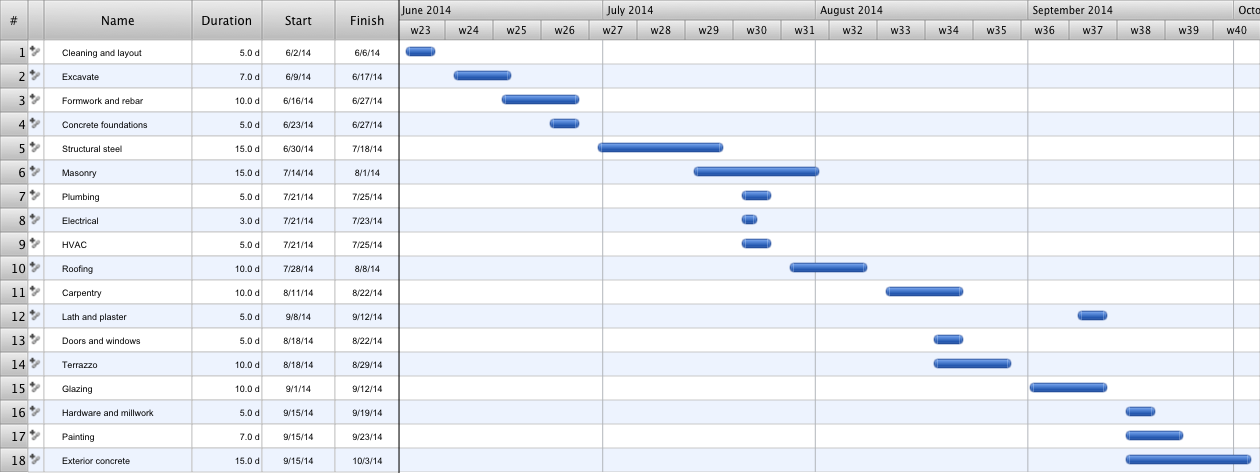
The samples you see on this page were created in ConceptDraw DIAGRAM software using the objects from the libraries of Flowcharts Solution. These examples flowchart successfully demonstrate solution's capabilities and professional results you can achieve. An experienced user spent 10 minutes creating each of these samples.

Use the tools of Flowcharts Solution for ConceptDraw DIAGRAM software to draw Flow Charts and Process Flow Charts of any complexity quick, easy and effective.

All source documents are vector graphic documents. They are available for reviewing, modifying, or converting to a variety of formats (PDF file, MS PowerPoint, MS Visio, and many other graphic formats) from the ConceptDraw STORE. The Flowcharts Solution is available for all ConceptDraw DIAGRAM or later users.


TEN RELATED HOW TO's:
Diagramming is an astonishing way to visualize business processes. The list of the most common business process flowchart symbols is quite long starting from basic flowcharts, continuing with SIPOC diagrams. Business process modeling was never easier than now, with special ConceptDraw Business Process Mapping solution. To carry out all professional standard requirements for business processes mapping, it is necessarily to follow the special graphical notations. ConceptDraw Business Process Mapping solution offers an exhaustive suite of tools to aid business process mapping. There are three vector libraries SIPOC Diagrams, Business Process Flowcharts, and Swim Lanes that contains totally more than 50 symbols of standard BPM notations. This is all that professionals need to effectively evaluate and manage quality in business processes.Business Process Flowchart Symbols *
Picture: Business Process Flowchart Symbols
Related Solution:
This action mindmap helps respond to critical messages from a customer's misunderstanding of a product or service purpose. The example contains ready to use response phrases organized into mindmap for quick composing and tweeting/posting of the response messages.Misunderstanding Product Purpose *
Picture: Misunderstanding Product Purpose
Related Solution:
Software development flourishes nowadays. Students have tons of educational information and courses that would fit every taste. And it's no secret that knowing how to draw data flow diagrams is a useful skill for a future software architect. The diagrams help a lot in understanding how to storage data effectively and how data processes within a system. This data flow diagram represents the model of small traditional production enterprise. It was created using Yourdon and Coad notation. The data flow diagram include four main objects: entity, process, data store and data flow. Yourdon and Coad notation uses circles to depict processes and parallel lines to represent data stores. Dataflows are shown as arrowed lines. They are labeled with the description of the data that move through them. Dataflow's role is to deliver the pieces of information. A process's function is to transform. the input data flow into output data flow. ConceptDraw Data Flow Diagrams solution contains the data flow diagram symbols of both Yourdon-Coad and Gane-Sarson notations and a set of handy templates to get started with DFD.Data Flow Diagrams *
Picture: Data Flow Diagrams
Related Solution:
Presenting you with a drawing program which could really surprise you with their great functionality. Don't know how to start to draw Connector's improvement? Curious how should diagramming software work? Drawing programs involve a lot of things like designs in an illustrative way, creating an cherts, Tools to create high end graphics, create dashboards, using your data and many other technical aspects do it in a much professional and in a quick way.How to Help Customers be More Productive *
Picture: How to Help Customers be More Productive
Many professionals have to solve problems every day. Designing of the process algorithm contribute to understand where the problem is in the process. A Flowchart is a graphical tool that most usable for breaking down processes. Definition of flowchart - a diagram that shows step-by-step progression through a procedure or system especially using connecting lines and a set of conventional symbols. All the icons, symbols and connectors needed for creating standardized notation flowcharts are contained within Software Flow Chart.Software Flow Chart *
Picture: Software Flow Chart
Related Solution:
Create your own flow charts of computer or network system account processing using the ConceptDraw DIAGRAM.Account Flowchart
Picture:
Account Flowchart
Flowchart Examples
Related Solution:
ConceptDraw DIAGRAM diagramming and vector drawing software extended with tools of Flowcharts Solution from the Diagrams Area of ConceptDraw Solution Park ideally suits for fast and easy Online Flow Chart designing. We propose to verify this right now.Online Flow Chart *
Picture: Online Flow Chart
Related Solution:
The ConceptDraw DIAGRAM Planogram Software and Retail Plan Software offers powerful tools of Enterprise Architecture Diagrams Solution for visualization the market analysis and easy making successful Retail Plans and Planograms with useful detailed recommendations about placing products and optimization the shelf space.Planogram Software <br>and Retail Plan Software *
Picture: Planogram Software and Retail Plan Software
Related Solution:
This sample was created in ConceptDraw DIAGRAM diagramming and vector drawing software using the UML Class Diagram library of the Rapid UML Solution from the Software Development area of ConceptDraw Solution Park. This sample shows the structure of the building and can be used by building companies, real estate agencies, at the buying / selling of the realty.UML Class Diagram Example -  Buildings and Rooms *
Picture: UML Class Diagram Example - Buildings and Rooms
Related Solution:
Total Quality Management (TQM) system is the management method where the confidence in quality of all organization processes is placed foremost. The given method is widely used in production, in educational system, in government organizations and so on.Total Quality Management with ConceptDraw *
Picture: Total Quality Management with ConceptDraw
ConceptDraw
DIAGRAM 18