Picture:
Account Flowchart Stockbridge System
Flowchart Examples
Related Solution:
A flowchart is a widely used type of diagram that visually represents an algorithm, workflow or process, using the boxes of various kinds to depict the steps and connecting them with arrows to show the order of execution these steps. Еhe ConceptDraw DIAGRAM supplied with Accounting Flowcharts Solution from the Finance and Accounting Area of ConceptDraw Solution Park is a powerful diagramming and vector drawing software which ideally suits for designing Ordering Process Flowchart of any complexity.
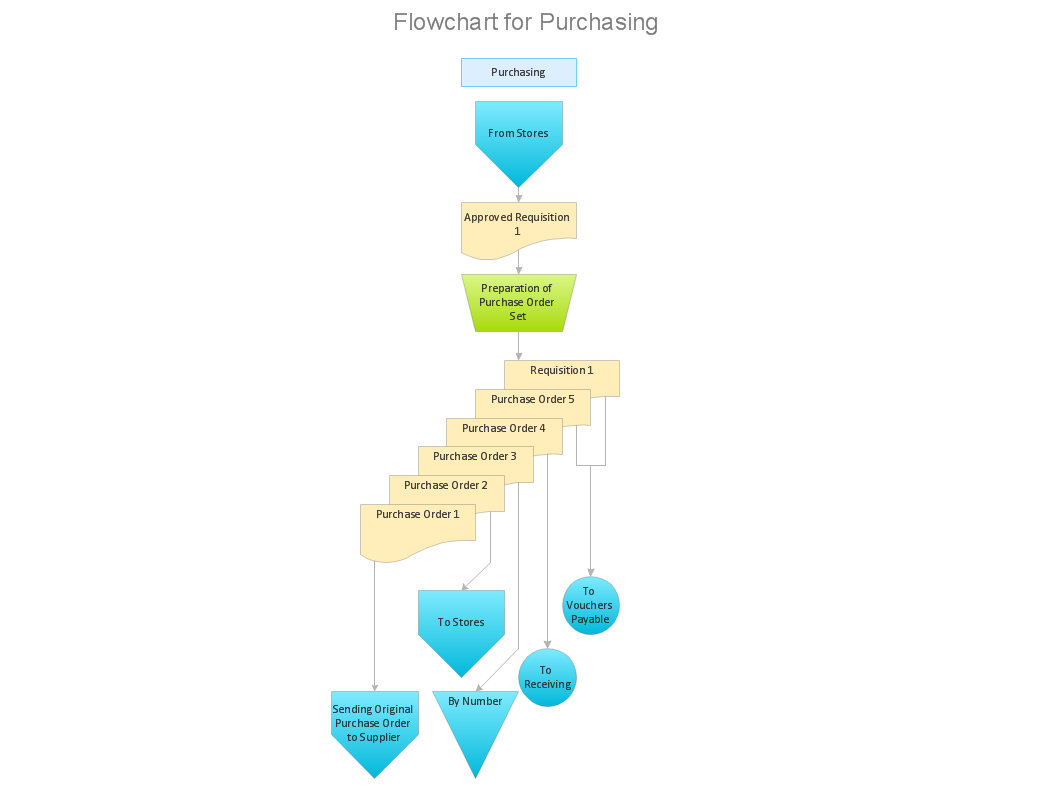
Picture: Ordering Process Flowchart. Flowchart Examples
Related Solution:
Business graphic applications show a special knowledge representations and include many features for creating schematic pictures. These graphic tools are known as flowchart maker or flowchart maker software.
Picture: Flowchart Maker
Related Solution:
Accounts Payable Flowchart - There is nothing easier than do it in ConceptDraw DIAGRAM. ConceptDraw DIAGRAM diagramming and vector drawing software provides the Accounting Flowcharts Solution from the Finance and Accounting Area of ConceptDraw Solution Park.
The Accounting Flowcharts Solution contains templates, samples and library of ready-to-use predesigned vector objects that will help you create: accounts payable flowchart, accounts payable process flow chart, accounting flowchart of any complexity quick and easy.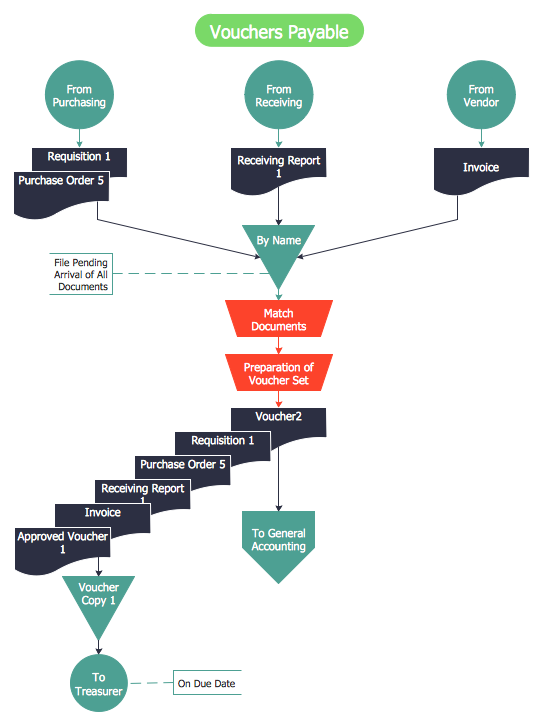
Picture: Accounts Payable Flowchart
Related Solution:
The Total Quality Management Diagram solution helps you and your organization visualize business and industrial processes. Create Total Quality Management diagrams for business process with ConceptDraw software.
Picture: TQM Diagram — Professional Total Quality Management
Related Solution:
When you are a beginner in software development, you make a lot of mistakes. Developing logical models, or data flow diagrams is a way to see the the whole project and all the processes clearly. And some novices, unfortunately for them, miss modeling stage at the beginning of project life cycle, and get into troubles as the project grows.
This image represents the data flow diagram applying symbols of Yourdon and Coad notation. This DFD depicts the data flow inside an organization department deals with receivables. The icons of standard Yourdon and Coad notation provides possibility to draw professional looking and well- readable DFD for business documentation. This data flow diagram was designed with the help of ConceptDraw DIAGRAM and its Data Flow Diagrams solution. The solution delivers three vector graphic libraries including elements of Yourdon and Coad and Gane-Sarson notations.
Picture: Data Flow Diagram Process
Related Solution:
A software tool that saves your time on making decisions now has the ability to make decisions with remote team via Skype.
Picture: Decision Making Software For Small Business
Related Solution:
Learn the most common process flowchart symbols used in business process diagrams and workflow charts. Includes symbol meanings, examples, and a practical reference table.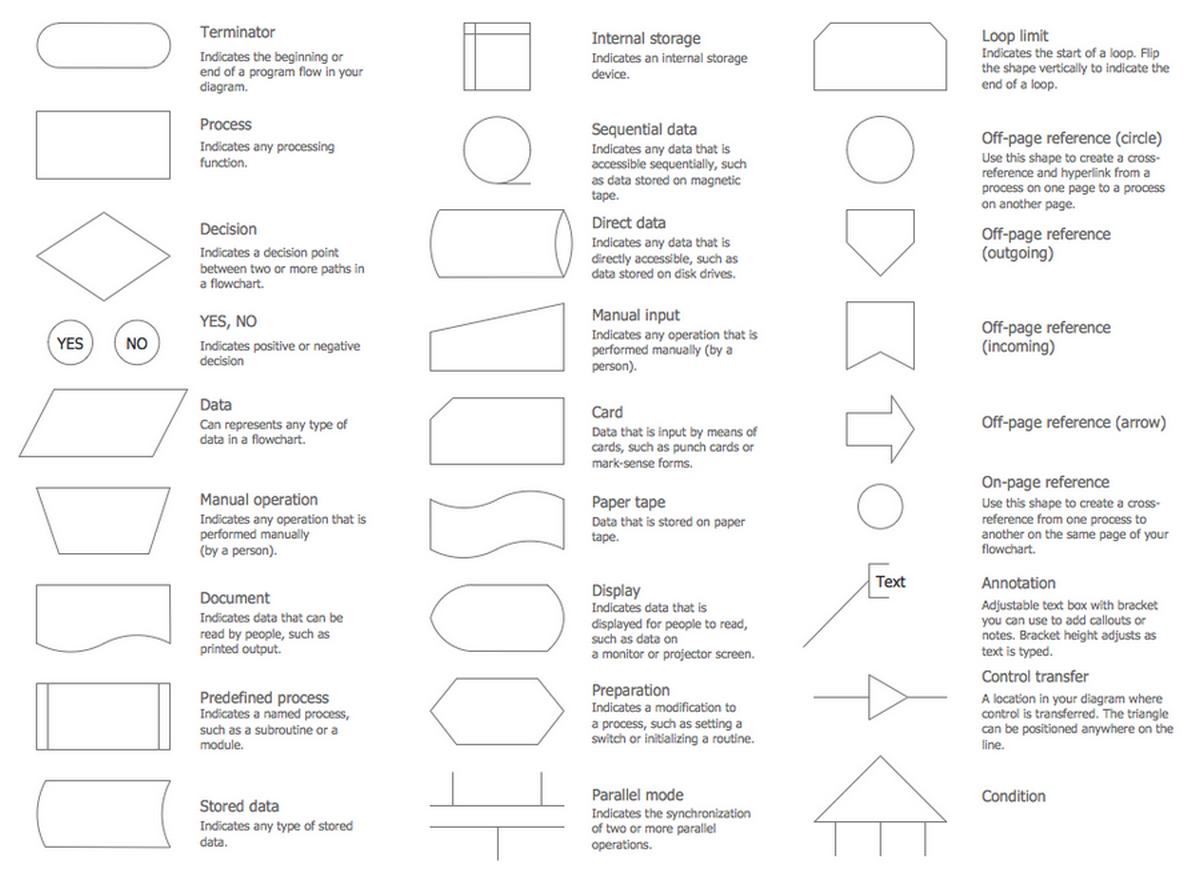
Picture: Process Flowchart Symbols: Meaning, Types and Examples
Related Solution:
Use ConceptDraw DIAGRAM diagramming and business graphics software for drawing your own PM life cycle flow charts.
Picture: Program to Make Flow Chart
Related Solution: