
Example 1. Accounting Flowchart Symbols
The accounting flowcharts and diagrams created with help of ConceptDraw's Accounting Flowcharts solution let effectively represent the detailed structure of the process. Add the accounting flowchart symbols to the diagram by dragging them from the Accounting Flowcharts library to your ConceptDraw document page.
| Symbol |
Shape Name |
Symbol Description |
| Process / Operation Symbols |
 |
Process |
Any processing function. |
 |
On-page Connector |
Transfer of customer order to the credit department. |
 |
Off-page Connector |
Mailing of sales invoice to customer. |
 |
Annotation |
Used to describe or note an activity. |
 |
Punched Card |
Method of computer input, the data that are input by means of punched card. |
 |
Magnetic Tape |
Method of computer input, the data that are stored on magnetic tape. |
 |
Punched Tape |
Method of computer input, the data that are input by means of punched tape. |
 |
Manual Input |
Data that are entered manually with a keyboard or barcode reader. |
 |
Magnetic Disk |
Method of computer storage, the data that are stored on magnetic disk. |
 |
Manual File |
Data that are stored by non-electronic means. |
 |
Manual Operation |
Any operation that is performed manually (by a person). |
 |
Document |
Data that can be read by people, such as printed output. |
 |
Angled Connector |
Angled Connector. |
 |
Double Tree Connector |
Double Tree Connector. |
You can also assign the library objects with the Rapid Draw tool on the Shape toolbar. The Rapid Draw functionality lets add new objects with a single click. Click the Rapid Draw arrow to create new object and automatically connect it to the selected object.
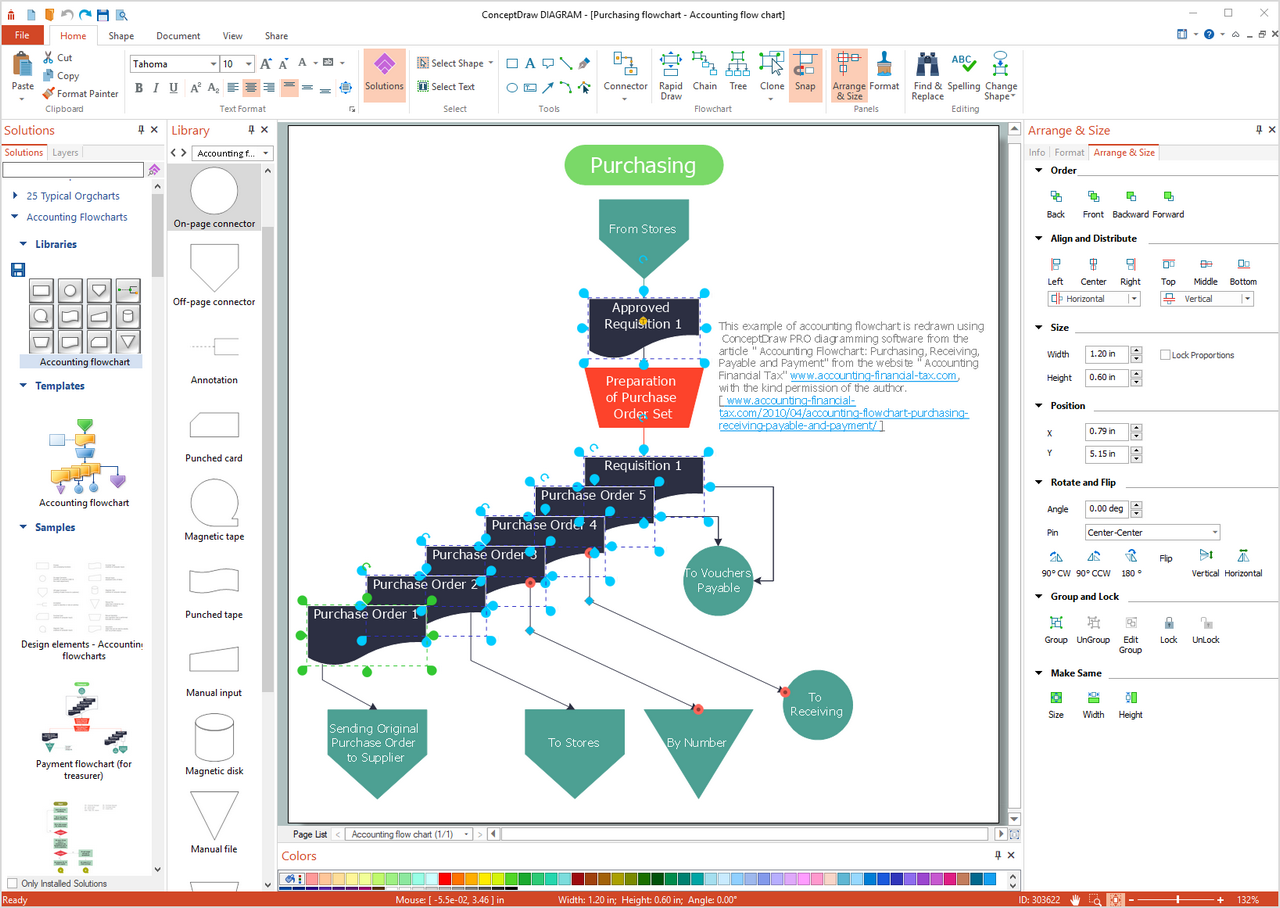
Example 2. Creation Voucher Payable Flowchart in ConceptDraw DIAGRAM
All Accounting Flowcharts created in ConceptDraw DIAGRAM are colorful, attractive, and will have a great success when used in whitepapers, datasheets, posters, published technical materials, presentations on conferences, meetings and various discussions with colleagues. Use the Line, Fill, Shadow and Text tools to format your Accounting Flowcharts.

Example 3. Accounting Flowchart Template
A number of samples and template are also included in Accounting Flowcharts solution and give to the ConceptDraw's users a base from which to explore the powerful diagramming tools of ConceptDraw DIAGRAM software. Thanks to the accounting flowchart template you can greatly save your time, all that you need to do is to make changes if required to the existing Accounting Flowchart. Open the Accounting Flowchart template from ConceptDraw STORE.

Example 4. Accounting Flowcharts Solution
Use the variety of accounting flowchart symbols from the Accounting Flowcharts library for Accounting Flowcharts Solution, and also collection of samples and template from ConceptDraw STORE to create your own professional looking Accounting Flowcharts of any complexity quick, easy and effective.
TEN RELATED HOW TO's:
Create professional business process diagrams using ConceptDraw Data library with 10 objects from BPMN.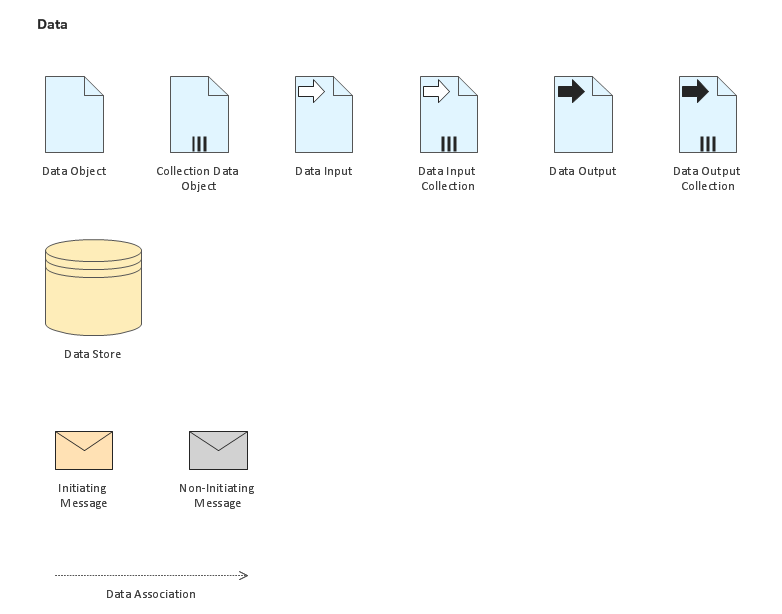
Picture: Business Process Elements: Data
Data base diagrams describes inter-related data and tables. It describes roles and relationships, internal and external dependencies, data exchange conventions and structures of knowledge domain.
ConceptDraw Software provides number of data-base chart libraries including major 49 vector symbols. Use these DFD flowchart symbol libraries to design data-base structure and models, use it to design data base process-oriented models, or simple data-oriented models. The are special drawing tools for making data flowcharts, data process diagrams, structured analysis diagrams, and information flow diagrams.
Picture: Database Flowchart Symbols
Related Solution:
ConceptDraw DIAGRAM is the best network diagram software. To design the Cisco Network Diagrams and visualize the computer networks topology use ConceptDraw DIAGRAM diagramming and vector drawing software extended with Cisco Network Diagrams solution for ConceptDraw DIAGRAM Solution Park.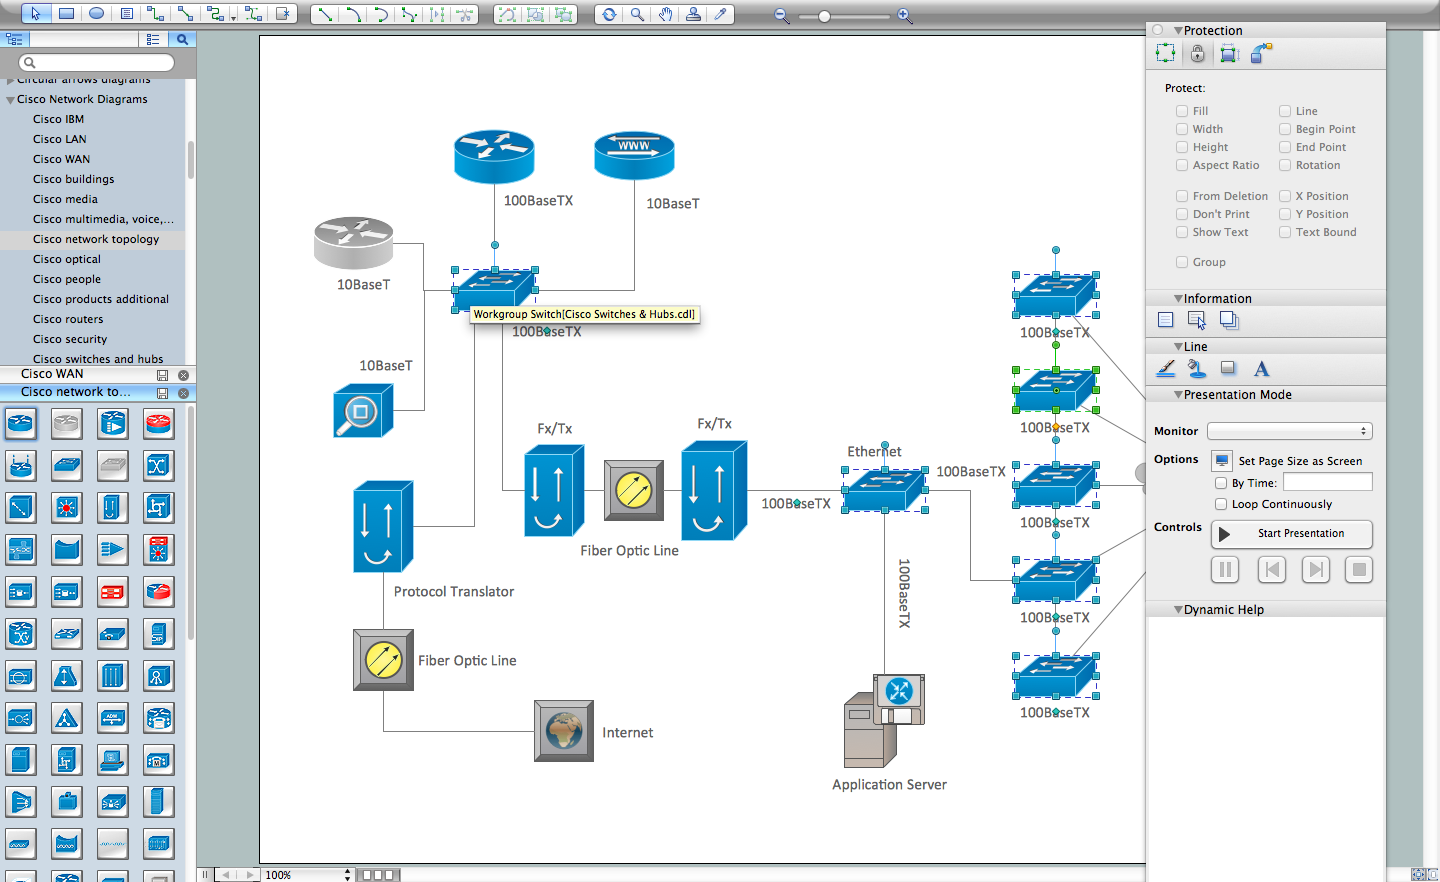
Picture: Cisco Network Diagram Software
Related Solution:
Computer-aided design (CAD) is the use of the computer software to create drawings. Today the large quantity of the technical drawings and architectural designs is created using the CAD software. CAD software makes the design process convenient, efficient and productive.
ConceptDraw DIAGRAM diagramming and vector drawing software allows you the possibility to draw your architectural designs quick, simple and effective.
Use the libraries with a set of vector objects, templates and samples from the Floor Plans Solution from the Building Plans area of ConceptDraw Solution Park for designing your professional architectural designs.
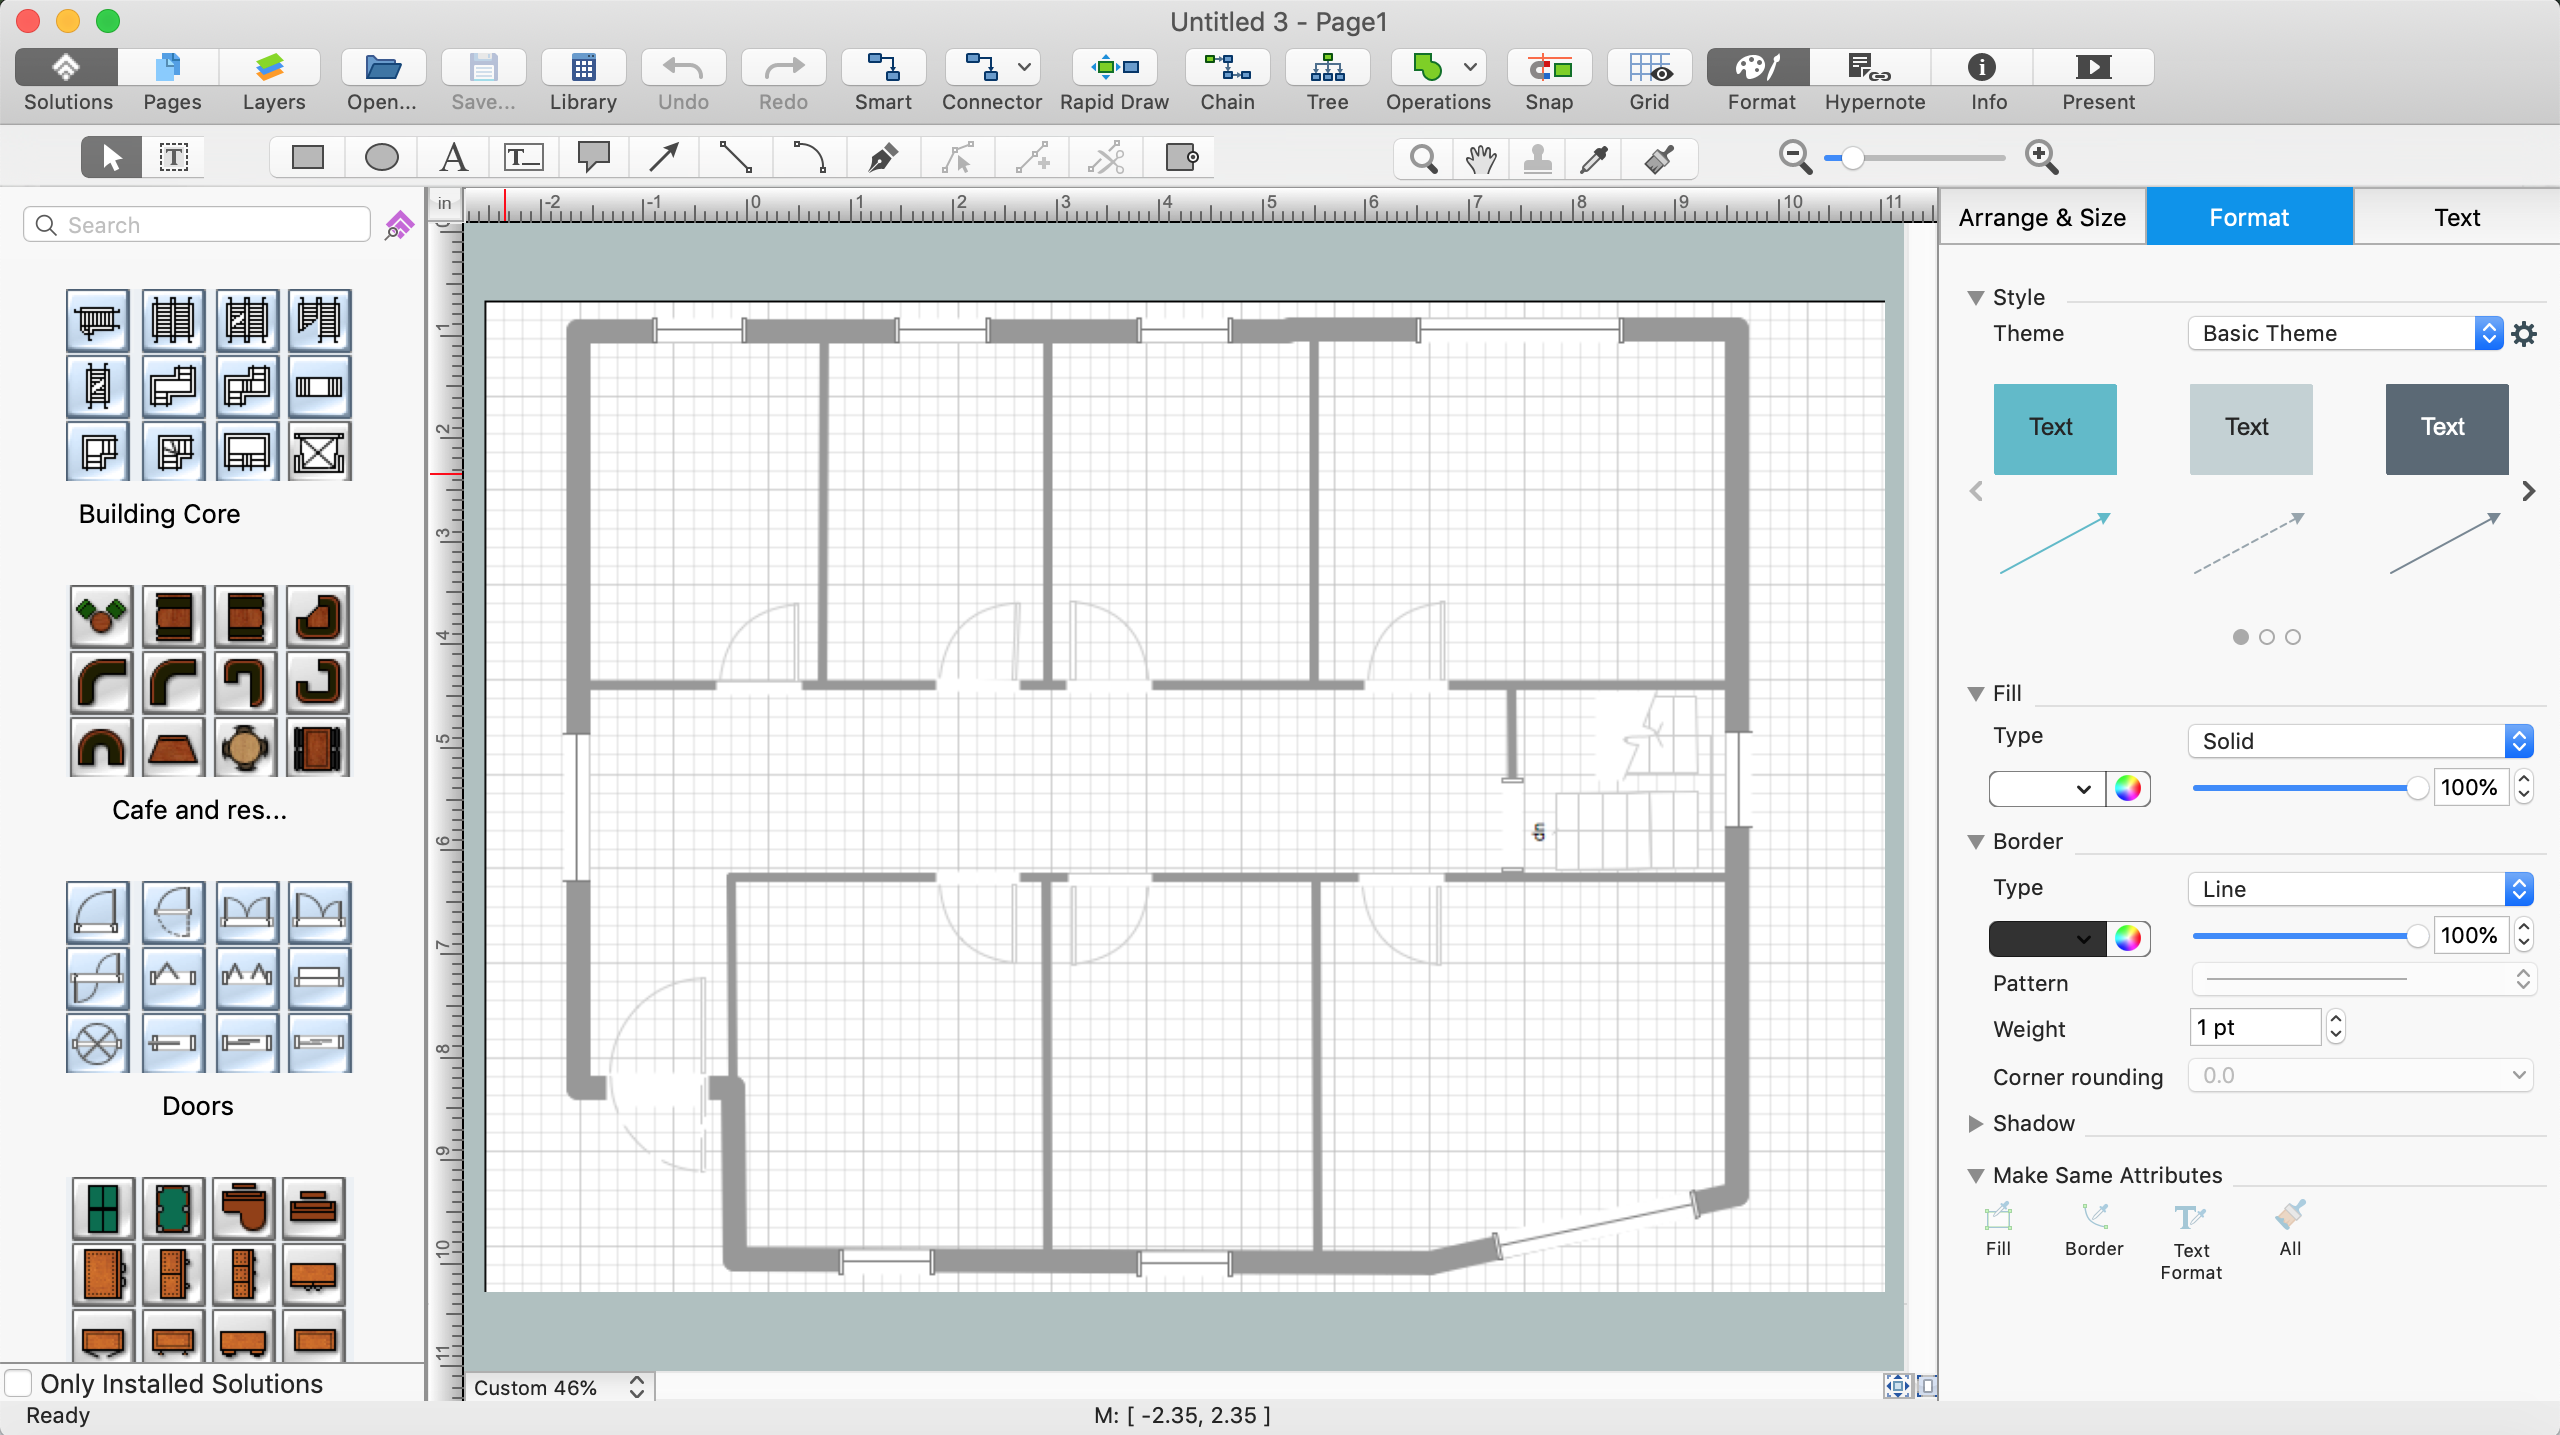
Picture: CAD Software for Architectural Designs
Related Solution:
There are several types of insulated gate field-effect transistors (IGFETs) in common use.
The early term metal oxide semiconductor field-effect transistor (MOSFET) is still in
use, and MOSFET is usually acceptable as a generic term for IGFETs. The metal oxide, and the insulation in the IGFET, is the insulating material between the gate terminal and the substrate between the source and drain terminals. This insulator must have very low leakage, of course, but another requirement for good performance of the transistor is that the dielectric constant of the material must be very high.
26 libraries of the Electrical Engineering Solution of ConceptDraw DIAGRAM make your electrical diagramming simple, efficient, and effective. You can simply and quickly drop the ready-to-use objects from libraries into your document to create the electrical diagram.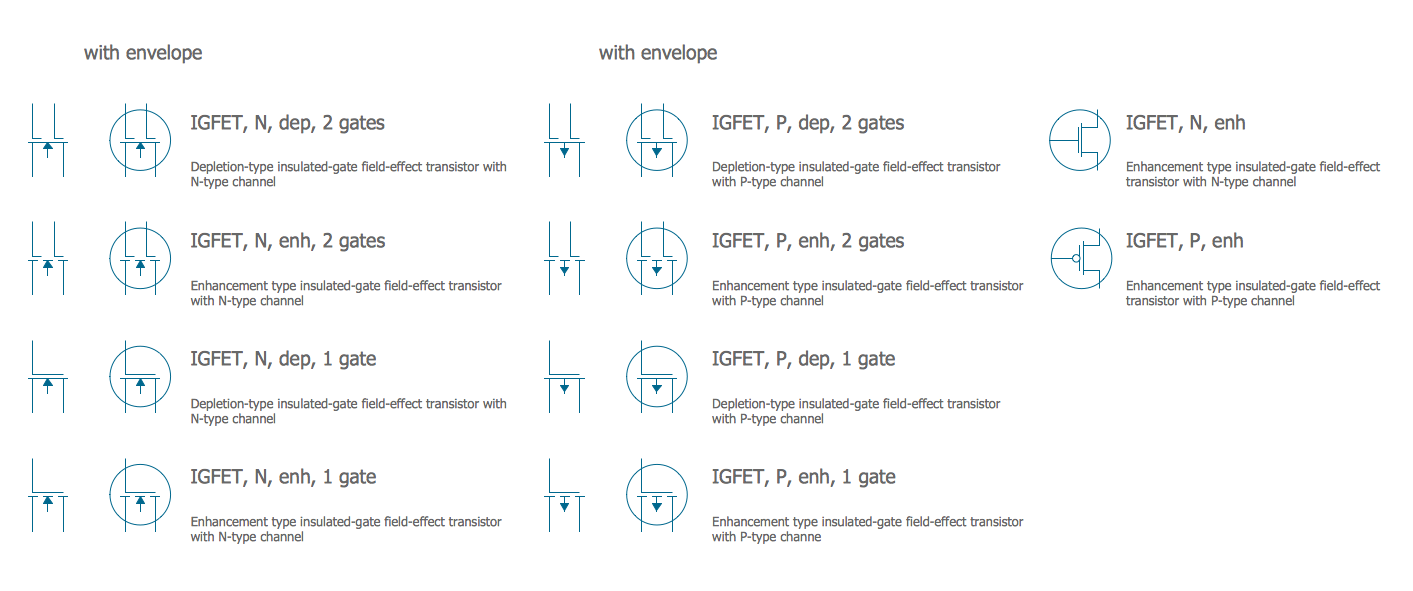
Picture: Electrical Symbols — IGFET
Related Solution:
Diagramming is an astonishing way to visualize business processes. The list of the most common business process flowchart symbols is quite long starting from basic flowcharts, continuing with SIPOC diagrams. Business process modeling was never easier than now, with special ConceptDraw Business Process Mapping solution.
To carry out all professional standard requirements for business processes mapping, it is necessarily to follow the special graphical notations. ConceptDraw Business Process Mapping solution offers an exhaustive suite of tools to aid business process mapping. There are three vector libraries SIPOC Diagrams, Business Process Flowcharts, and Swim Lanes that contains totally more than 50 symbols of standard BPM notations. This is all that professionals need to effectively evaluate and manage quality in business processes.
Picture: Business Process Flowchart Symbols
Related Solution:
A flowchart is a simple but very functional tool when it comes to understanding a workflow or to removing unnecessary stages from a process. When drawing flowcharts, keep in mind that there are four common types of flowcharts, like document flowcharts and data flowcharts that show control over a data or document flow over a system. To show controls on a physical level, use system flowcharts. In addition, to show controls in a program, you can draw a program flowchart.
This flowchart diagram represents the piece of an article editing process, that involves the author and editor. It was created using the Basic Flowchart notation that consists from the basic flowchart symbols. The start and the end of the process are indicated with "Terminator" symbols. The "Process" symbols show the action steps consisting from making edits and searching for a compromise, when the author does not agree with the suggestions of the editor. The "Process" symbol is the general symbol in process flowcharts. The "Decision" symbol indicates a branching in the process flow. There are two branches indicated by a Decision shape in the current flowchart (Yes/No, Disagree/Agree). This basic flowchart can be used as a repeating unit in the workflow diagram describing the working process of some editorial office.
Picture: Types of Flowcharts
Related Solution:
ConceptDraw DIAGRAM is the world’s premier cross-platform business-diagramming tool. Many, who are looking for an alternative to Visio, are pleasantly surprised with how well they can integrate ConceptDraw DIAGRAM into their existing processes. With tens of thousands of template objects, and an easy method for importing vital custom objects from existing Visio documents, ConceptDraw DIAGRAM is a powerful tool for making extremely detailed diagrams, quickly and easily.
Picture: ConceptDraw DIAGRAM : Able to Leap Tall Buildings in a Single Bound
Related Solution:
There are numerous articles about the advantages of flowcharting, creating business graphics and developing different charts. Nevertheless, these articles are almost useless without the main component - the examples of flowcharts, org charts and without a fine example, it is difficult to get all the conveniences of creating diagrams. You can find tons of templates and vivid examples on Solution Park.
This illustration shows a variety of business diagrams that can be created using ConceptDraw DIAGRAM. It comprises a different fields of business activities: management, marketing, networking, software and database development along with design of infographics and business illustrations. ConceptDraw DIAGRAM provides a huge set of sample drawings including business process modeling diagrams,, network diagrams, UML diagrams, orgcharts, DFD, flowcharts, ERD, geographical maps and more.
Picture: Examples of Flowcharts, Org Charts and More
Related Solution:
ConceptDraw DIAGRAM - workflow software extended with the Workflow Diagram solution provides a complete set of samples, templates and features help you to draw diagrams faster. A workflow software you use for drawing workflow diagrams and business process flow diagrams should provide a wide set of examples allows you get closer with workflow diagrams, learn symbols meaning, find appropriate layout and design, and then start drawing your own workflow diagram masterfully. Workflow diagrams used for orchestrating organizational processes between company departments and humans, so critical process diagrams used to train many people to interact must be clear and professional to convey an idea from a view. Thats a reason we created a lot workflow symbols and workflow icons collected them into special Workflow Diagram solution in ConceptDraw Solution Park.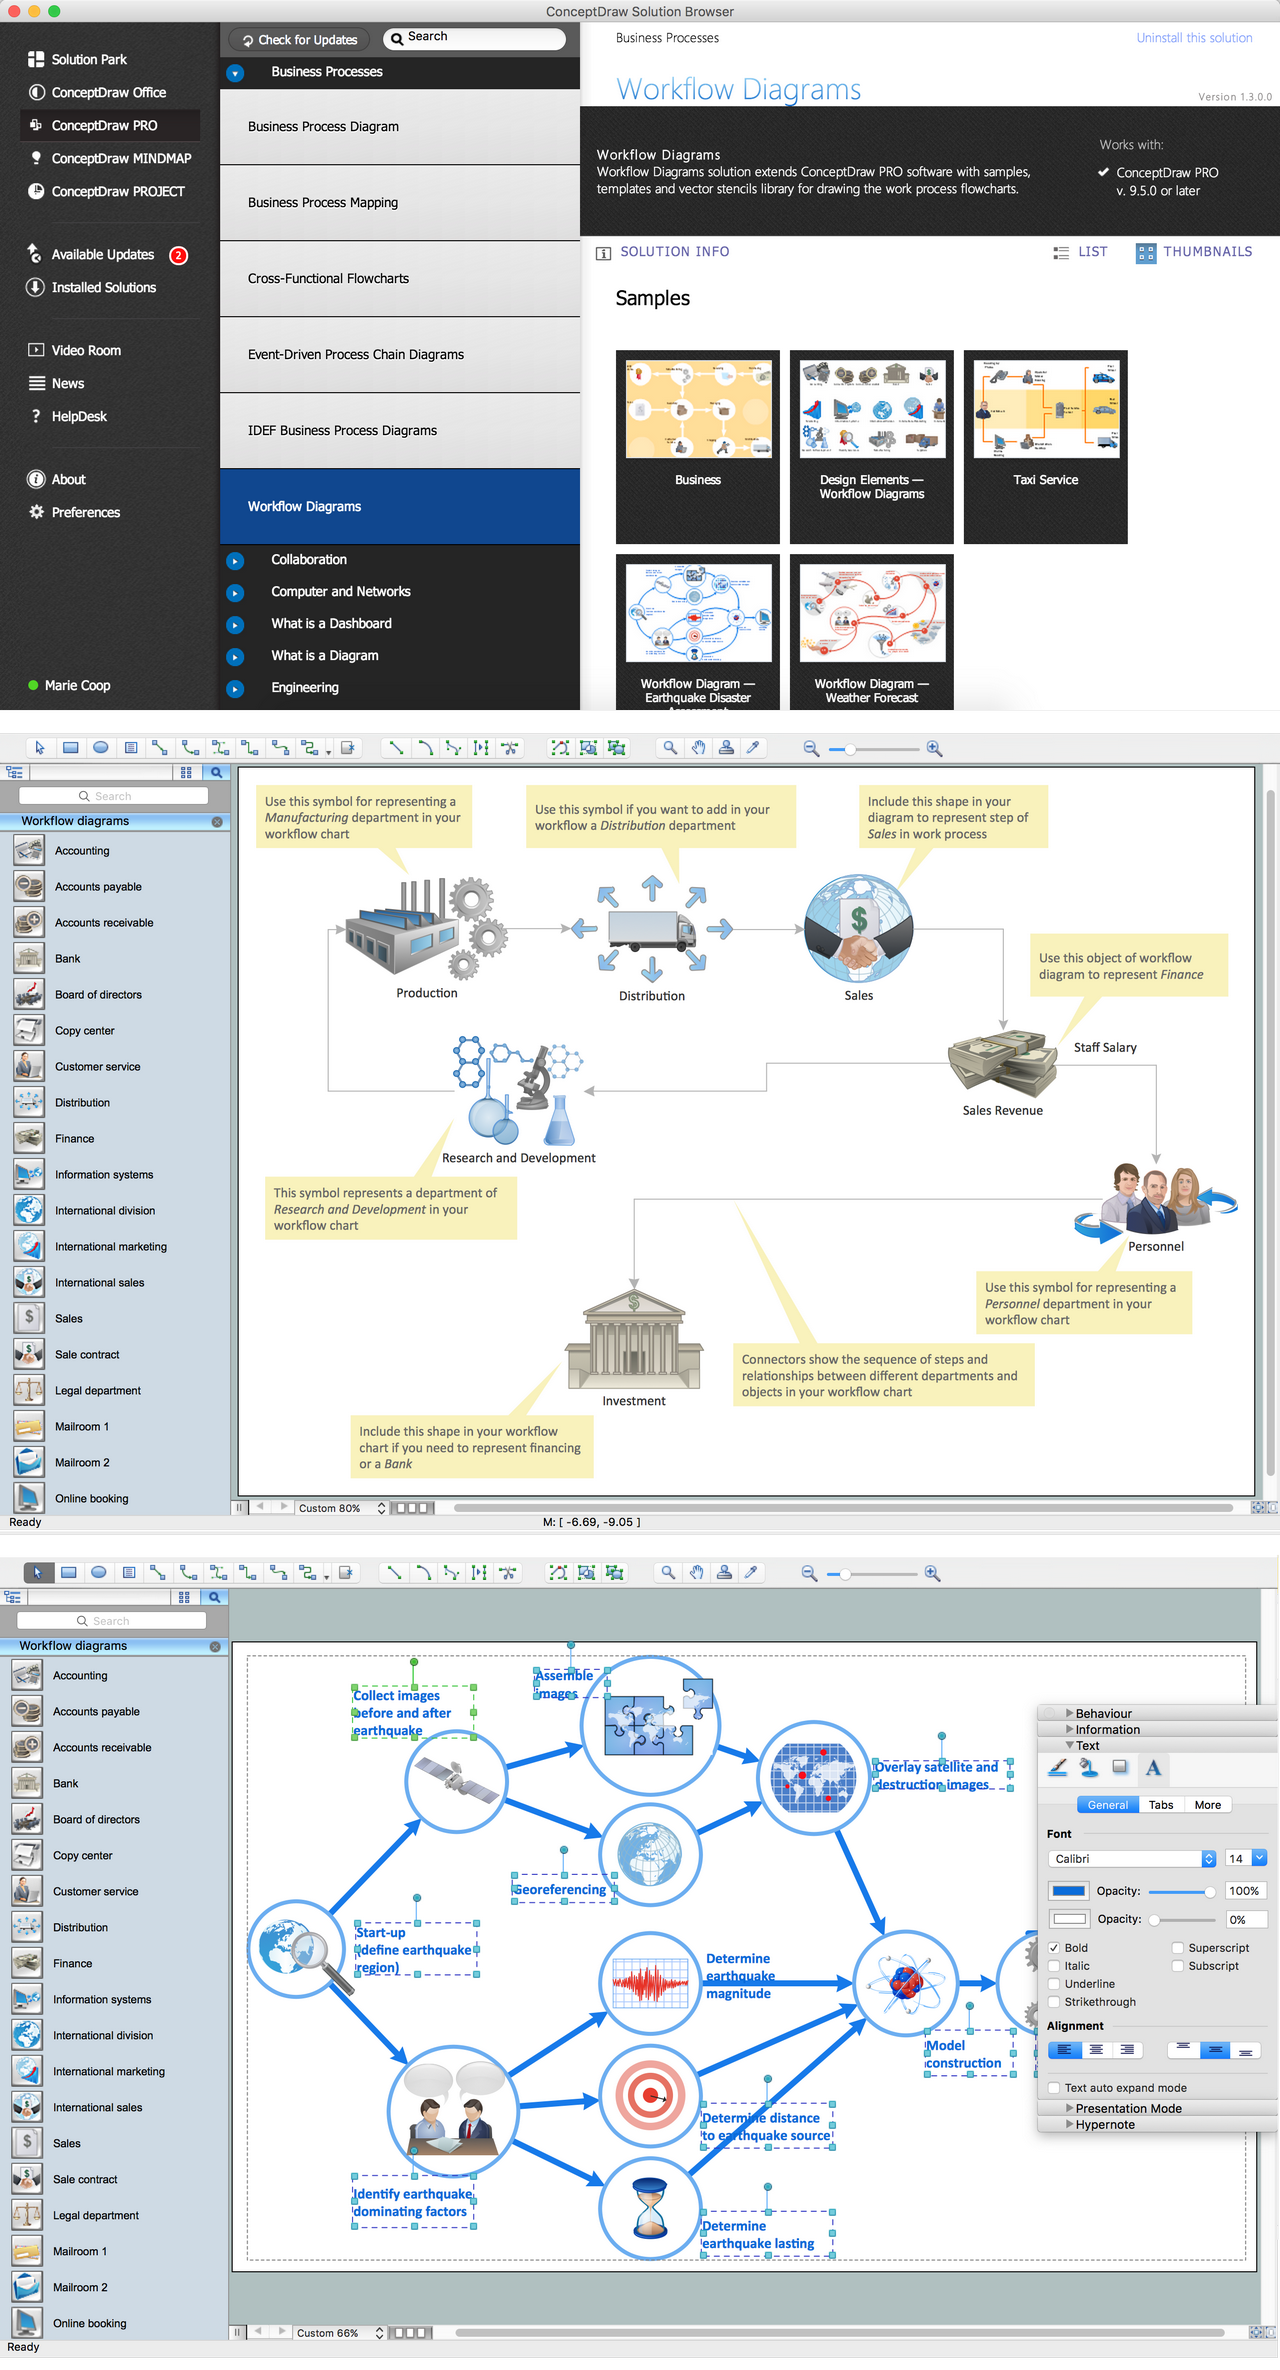
Picture: Workflow Diagram Examples
Related Solution:

