Decision making mind map template is created using ConceptDraw MINDMAP mind mapping software. This mind map template helps to learn how to use mindmap presentation via Skype for online decision making in small & medium business teams and enterprise workgroups.
Use this mindmap example for implementation of Remote Presentation for Skype solution from ConceptDraw Solution Park.
TEN RELATED HOW TO's:
ConceptDraw MINDMAP - an excellent tool for exporting mind maps to PowerPoint to visualize and presenting your project. You can simply generate, change, update your mindmap and then make a presentation in PowerPoint.
Picture: How To Do A Mind Map In PowerPoint
Related Solution:
It can be tough to get straight into business papers and processes.Otherwise, you can learn how to create flowcharts for an accounting information system and visualize these documents. Accounting diagrams are clear and easy to understand for all the participants of the process.
There are symbols used for creating accounting flowcharts using ConceptDraw DIAGRAM and its Accounting Flowcharts solution. Accounting flow charts are a special kind of flow charts. Actually a variety of flowcharts are often used to facilitate many aspects of a workflow of accounting department. Accounting flowcharts are utilized to support creating accounting documentation, to depict positions responsible for fulfillment of each phase of accounting workflow.
Picture:
How to Create Flowcharts for an
Accounting Information System
Related Solution:
The export options in ConceptDraw MINDMAP allow mind maps to be exported in various graphical formats such as images, webpages, or PDF files. They can also be exported into Microsoft Office applications or into different mindmapping programs.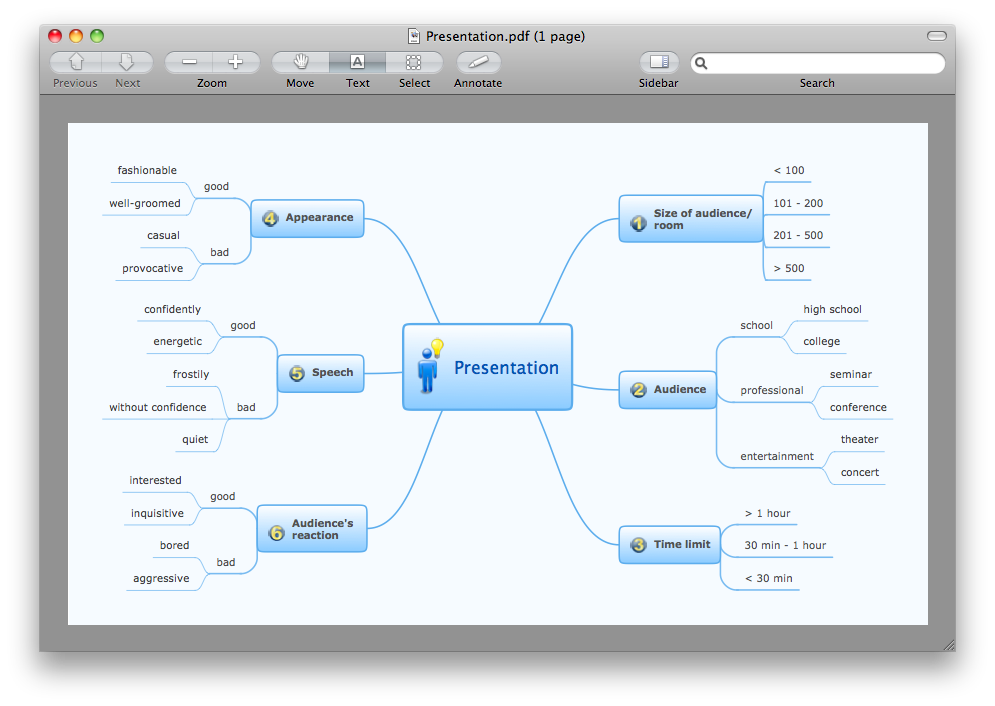
Picture: Export from ConceptDraw MINDMAP to PDF (Adobe Acrobat®) File
Related Solution:
Everyone wants to be efficient. To succeed, try Mind Maps for Business - SWOT Analysis and enjoy the result. But be careful: it can be addictive!
ConceptDraw products and supported by SWOT and TOWS Matrix Diagrams solution forms a great tool for providing SWOT analysis. The solution contains mind map templates. By filling mind map templates, one can easily determine Strengths, Weaknesses, Opportunities, and Threats of the current business. Just a one click is needed to turn the SWOT mind map into a SWOT matrix. The SWOT diagram will be created in ConceptDraw DIAGRAM on the base of SWOT mind map.
Picture: Mind Maps for Business - SWOT Analysis
A computer network diagram is a schematic representation the nodes and connections between them in a computer network.
ConceptDraw DIAGRAM is a powerful diagramming and vector drawing software for creating professional looking, detailed, visual and clear computer network diagrams. The Computer and Networks solution from Computer and Networks area of ConceptDraw Solution Park provides templates, samples and libraries with predesigned objects to help you design the computer network diagrams of any difficulty simply, quickly and effectively.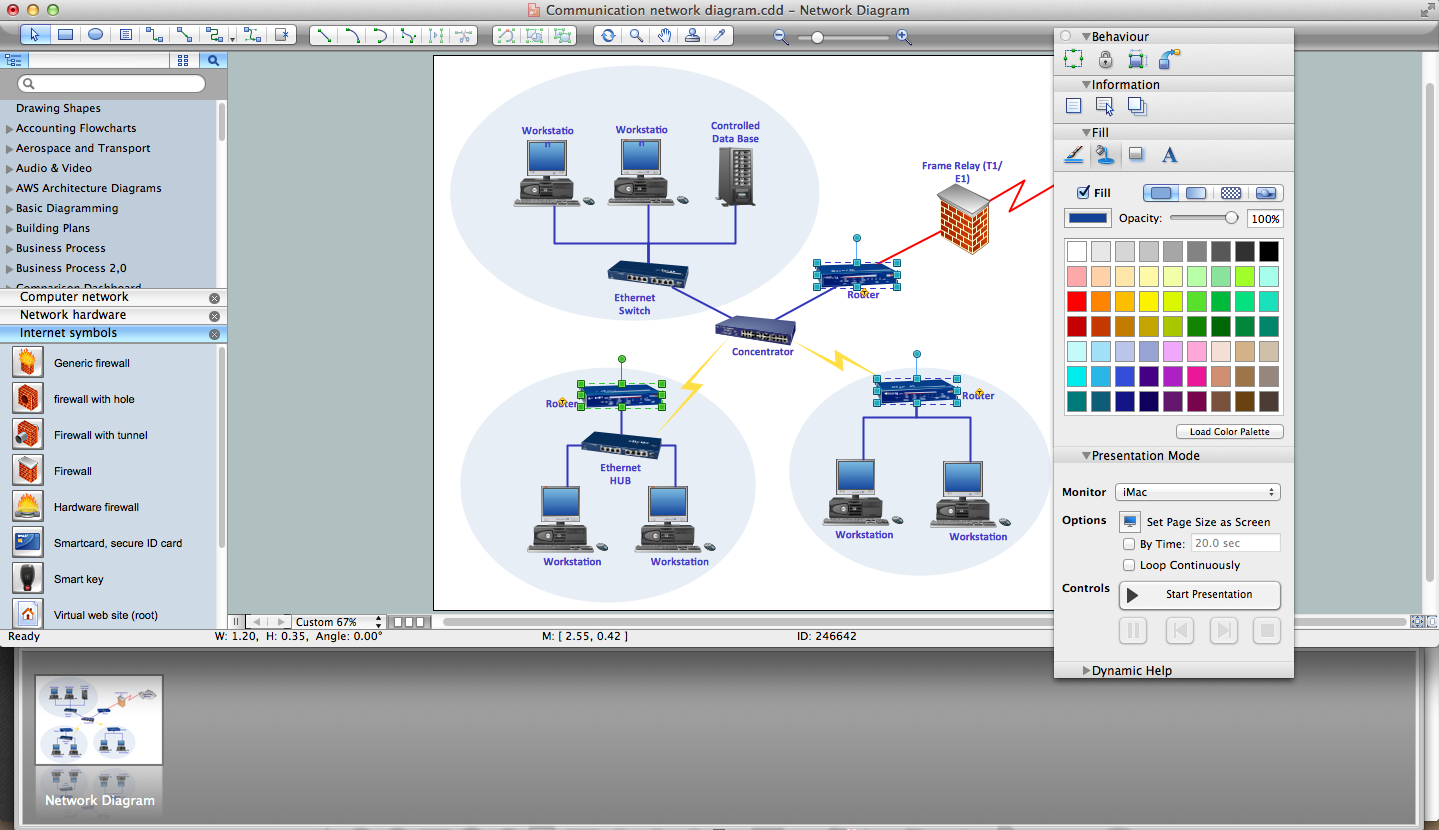
Picture: Network Diagram Software
Related Solution:
Cisco switches and hubs deliver the best performance, and often used as network solutions for small businesses, enterprises, data centers. Cisco switches are the core interconnect devices of each computer network. The numerous Cisco switches specifically designed for various applications. Network switches are separated for two types: fixed configuration and modular switches. The fixed configuration switches deprecate swapping or adding another module, and vice versa for modular switch.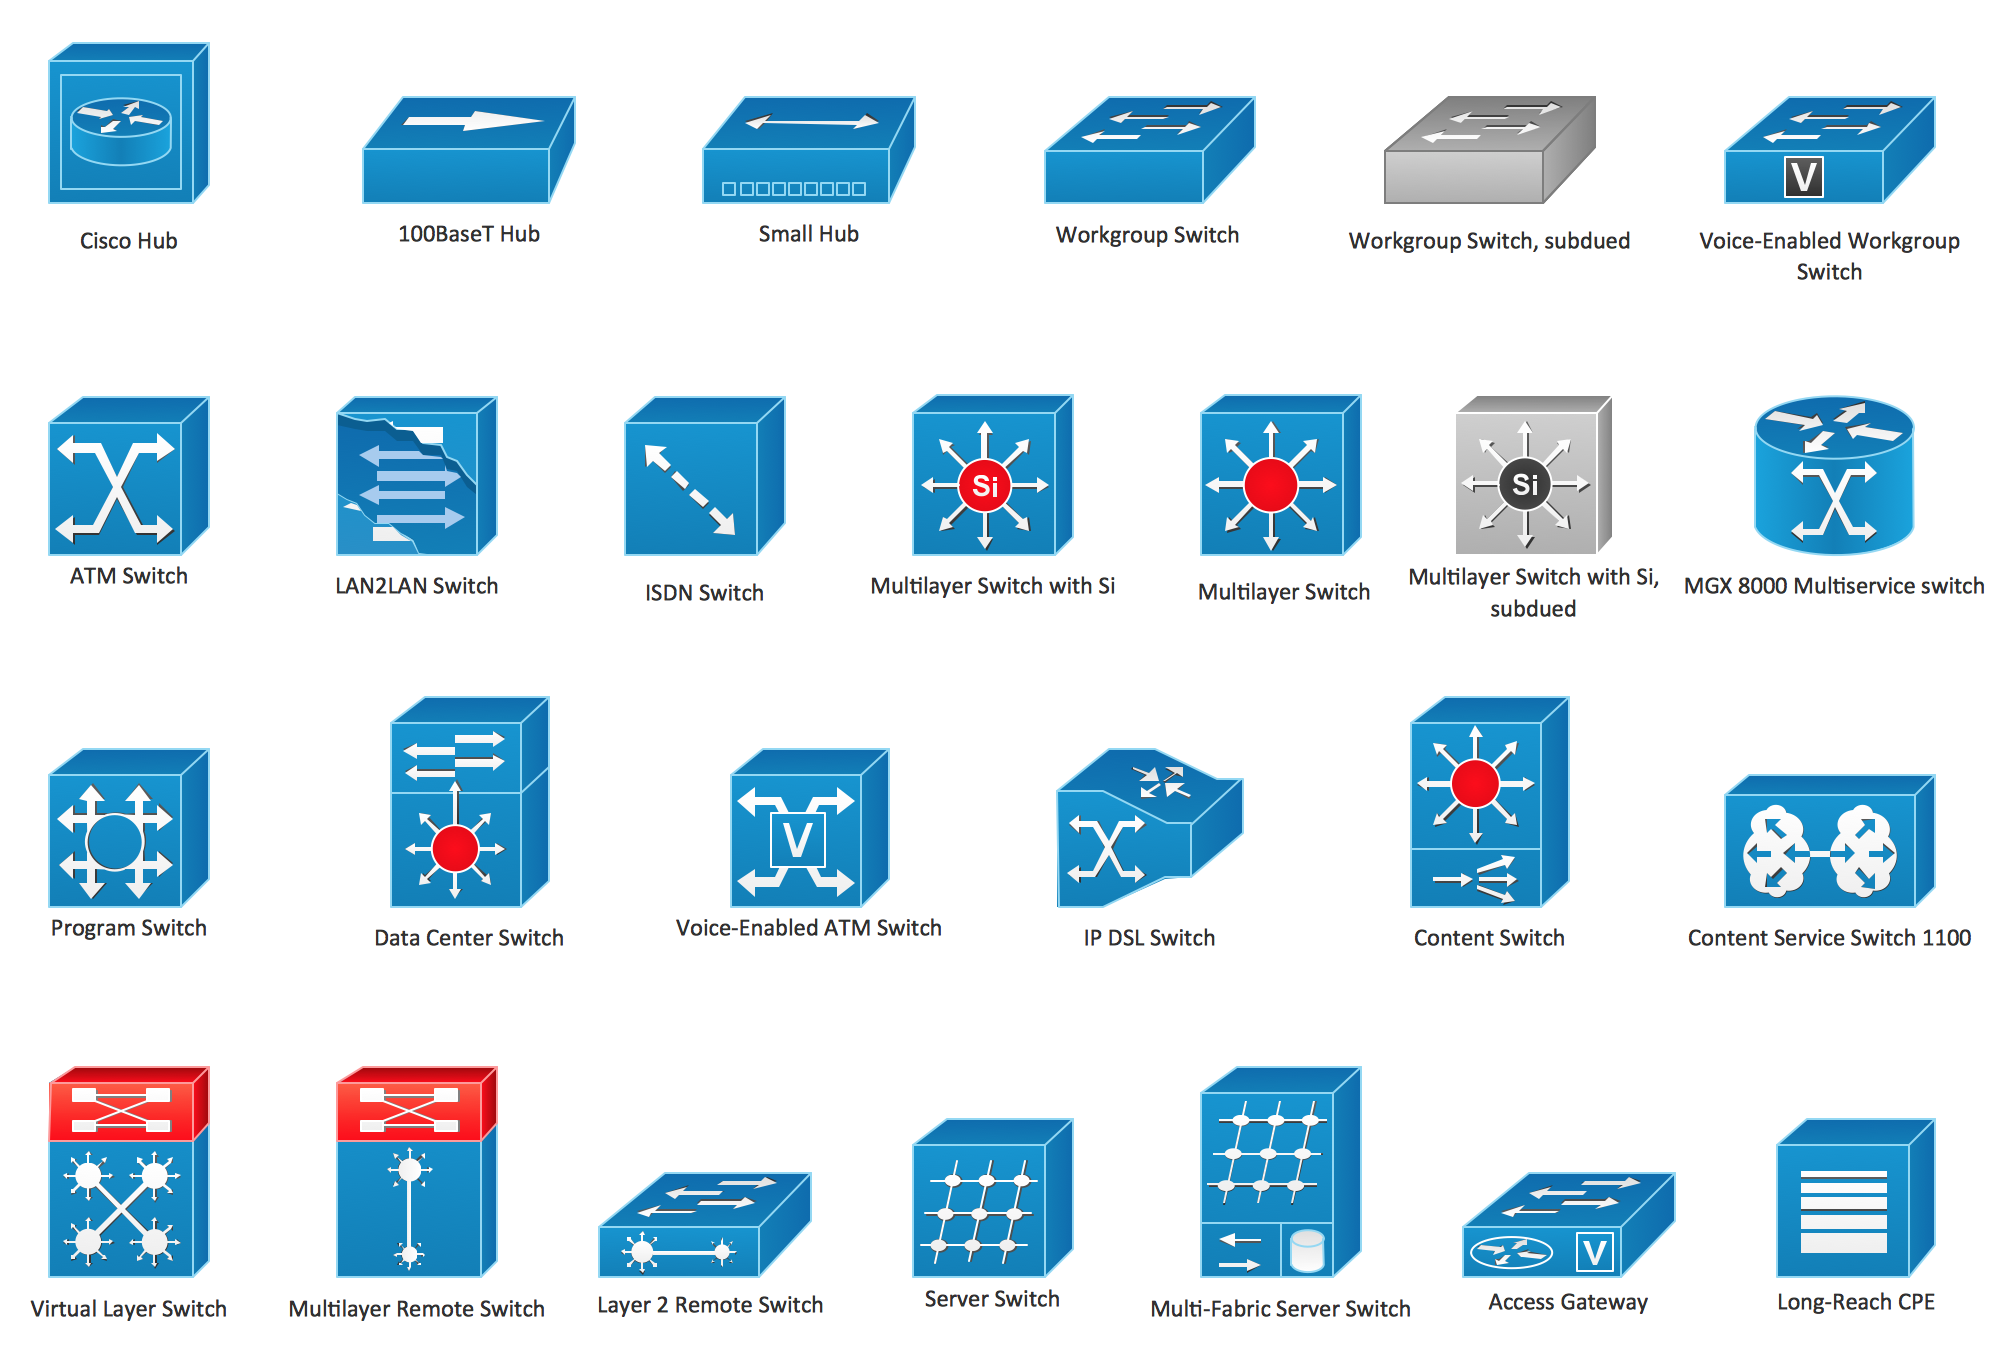
Picture: Cisco Switches and Hubs. Cisco icons, shapes, stencils and symbols
Related Solution:
There are many tools to manage a process or to illustrate an algorithm or a workflow. Flowcharting is one of those tools. However, it may be difficult to show complex processes that require multiple attributes or several people in a simple flowchart, so a cross-functional flowchart would be a solution for that situation. To create such flowchart, group processes and steps to labeled rows or columns, and divide those groups with horizontal or vertical parallel lines. It is worth mentioning that there are different types of cross-functional flowcharts, like opportunity or deployment flowchart.
This diagram shows a cross-functional flowchart that was made for a trading process. It contains 14 processes, distributed through 5 lines depicting the participants who interact with the process. Also there are connectors that show the data flow of information between processes. The cross-functional flowchart displays a detailed model of the trading process, as well as all participants in the process and how they interact with each other. The lines in the flowchart indicates the position, department and role of the trading process participants.
Picture: Cross-Functional Flowchart
Related Solution:
The excellent possibility to create attractive Cross Functional Flowcharts for step-by-step visualization the operations of a business process flow of any degree of detailing is offered by ConceptDraw’s Cross-Functional Flowcharts solution. The extensive selection of commonly used vector cross functional flowchart symbols allow you to demonstrate the document flow in organization, to represent each team member’s responsibilities and how processes get shared or transferred between different teams and departments.
Picture: Cross Functional Flowchart Symbols
Related Solution:
Collaboration software for small and medium business allows communicate with partners around the globe via Skype.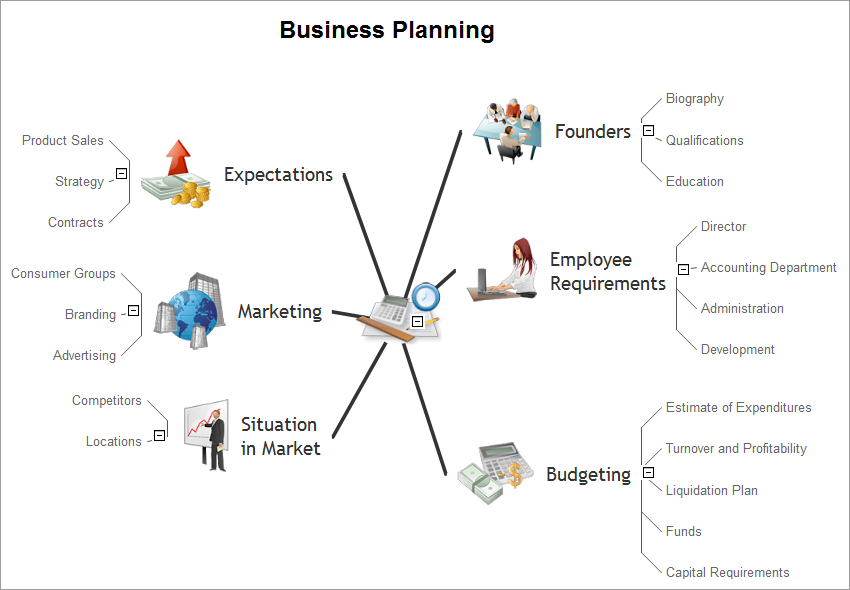
Picture: How to Collaborate in Business via Skype
Related Solution:
ConceptDraw DIAGRAM is effective software for a variety of activity fields. Now, extended with Sales Flowcharts solution from the Marketing area of ConceptDraw Solution Park it become also useful in the field of sales. It helps to design professional looking Sales Flowcharts, Sales Process Flowcharts, Sales Process Maps, Plans and Diagrams to effectively realize the process of selling a product or service, and to display the sales results.
Picture: Sales Process
Related Solution:
