MS Visio Look a Like Diagrams
|
ConceptDraw DIAGRAM software, being a great alternative to MS Visio on Mac, supports import of MS Visio files as well as swim-lane diagrams, flowcharts, project charts, orgcharts, cause-and-effect diagrams, decision tree charts, graphs, schemes, maps, plans and many other diagram types, which all can be created within a short period of time having the solutions available to be downloaded from ConceptDraw STORE. Let’s imagine you created some network diagram in order to describe the existing network structure. Physical network diagram is known to be used for presenting Telecommunications data (such as cable length) carrying a capacity or telecommunication type, servers with names, IP address (if it’s static), server role as well as domain name, location of network equipment (such as hubs, switches, modems, routers, bridges and printers) and the number of network users. You can always continue improving the way this diagram looks, importing it to ConceptDraw DIAGRAM and so, using the existing tools, which can be found in the so called “solutions” from ConceptDraw STORE. In this way, you can always make it possible to make the already made diagram look so much better, exploring the stencil libraries and picking the great as well as professionally looking design symbols for completing the drawing. Same about making other drawings. You can make Process and Instrumentation Drawing, Process Flow Diagram, EPC Diagram, Basic Flowchart, TQM Diagram, Cause and Effect Diagram, ER Diagram, Cross-Functional Flowchart, Fault Tree Analysis Diagram, Audit Diagram, Sales Flowchart, Work Flow Diagram, Data Flow Diagram, Accounting Flowcharts, as well as many more other ones, using ConceptDraw DIAGRAM software, exporting them to MS Visio, if needed, after. In order to create diagram in ConceptDraw DIAGRAM you can, first of all, open a new document in ConceptDraw DIAGRAM diagramming and drawing software, select one of the existing libraries from the needed solution, which can be found and so downloaded from ConceptDraw STORE. Then add any needed elements to the diagram by dragging them from the stencil library from the chosen solution to your document page. Add the next object by clicking on its icon from the “RapidDraw arrows” that pop up immediately when you bring the mouse cursor over the chosen object, modifying them any time you need by using the “Action button menu”. Once your diagram is done, you can then save it in the needed format as well as export it for using in the other applications, such as MS Visio.  Drawing Diagrams FastThe innovative “ConceptDraw Arrows10 Technology” included in ConceptDraw DIAGRAM application makes it a powerful drawing software that changes the way diagrams, charts, flowcharts, maps and other drawings can be produced, making the drawing process simpler and faster. Starting using it, you will find the ConceptDraw DIAGRAM application a powerful diagramming software that can help you to create the professional looking drawings using the well-designed objects from the design symbols libraries. In this way, ConceptDraw DIAGRAM software allows you to focus on work, not on the drawing process itself. Having ConceptDraw Arrows10 Technology means being able to draw the connectors with the smart behaviour that gives flexibility to your work process while creating MS Visio look alike diagrams on your Mac. What makes ConceptDraw DIAGRAM diagramming and drawing software so special is an access to lots and lots of the solutions, which all can be found in ConceptDraw STORE — the new product of CS Odessa, developed for enabling all ConceptDraw DIAGRAM users to make their drawings within a short period of time. Thus, every user has a chance to download ConceptDraw STORE from this site and so to get the solution they need to be able to use the pre-made design elements and previously created examples and templates of so many different flowcharts, charts, graphs, diagrams, maps, schemes and other drawings to use them as drafts, for example. |
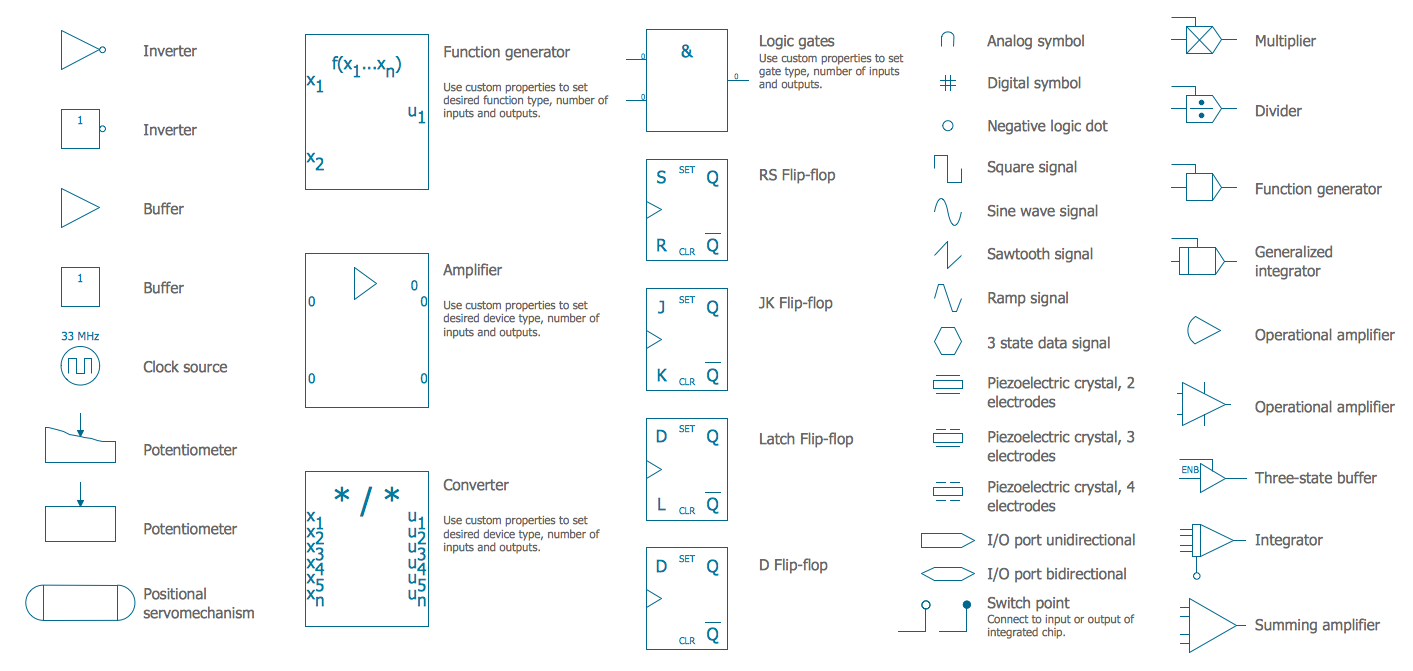
All solutions from ConceptDraw STORE are divided into areas, such as: Computer and Networks area includes “Active Directory Diagrams”, “AWS Architecture Diagrams”, “Azure Architecture”, “Cisco Network Diagrams”, “Computer Network Diagrams”, “Google Cloud Platform”, “Interactive Voice Response Diagrams”, “Network Layout Floor Plans”, “Rack Diagrams”, “Telecommunication Network Diagrams”, “Cloud Computing Diagrams”, “Network Security Diagrams”, “Vehicular Networking” and “Wireless Networks” solutions. At the same time the so called “Business Process” area of ConceptDraw STORE includes “Basic EPC Diagrams”, “Business Process Model and Notation”, “Classic Business Process Modelling”, “Process Flowcharts”, “Workflow Diagrams”, “Business Intelligence Dashboard”, “Business Process Diagrams”, “Business Process Mapping”, “Business Process Workflow Diagrams”, “Cross-Functional Flowcharts”, “Event-driven Process Chain Diagrams EPC”, “IDEF Business Process Diagrams”, “Logistic Dashboard” and “Logistics Flow Charts” solutions.

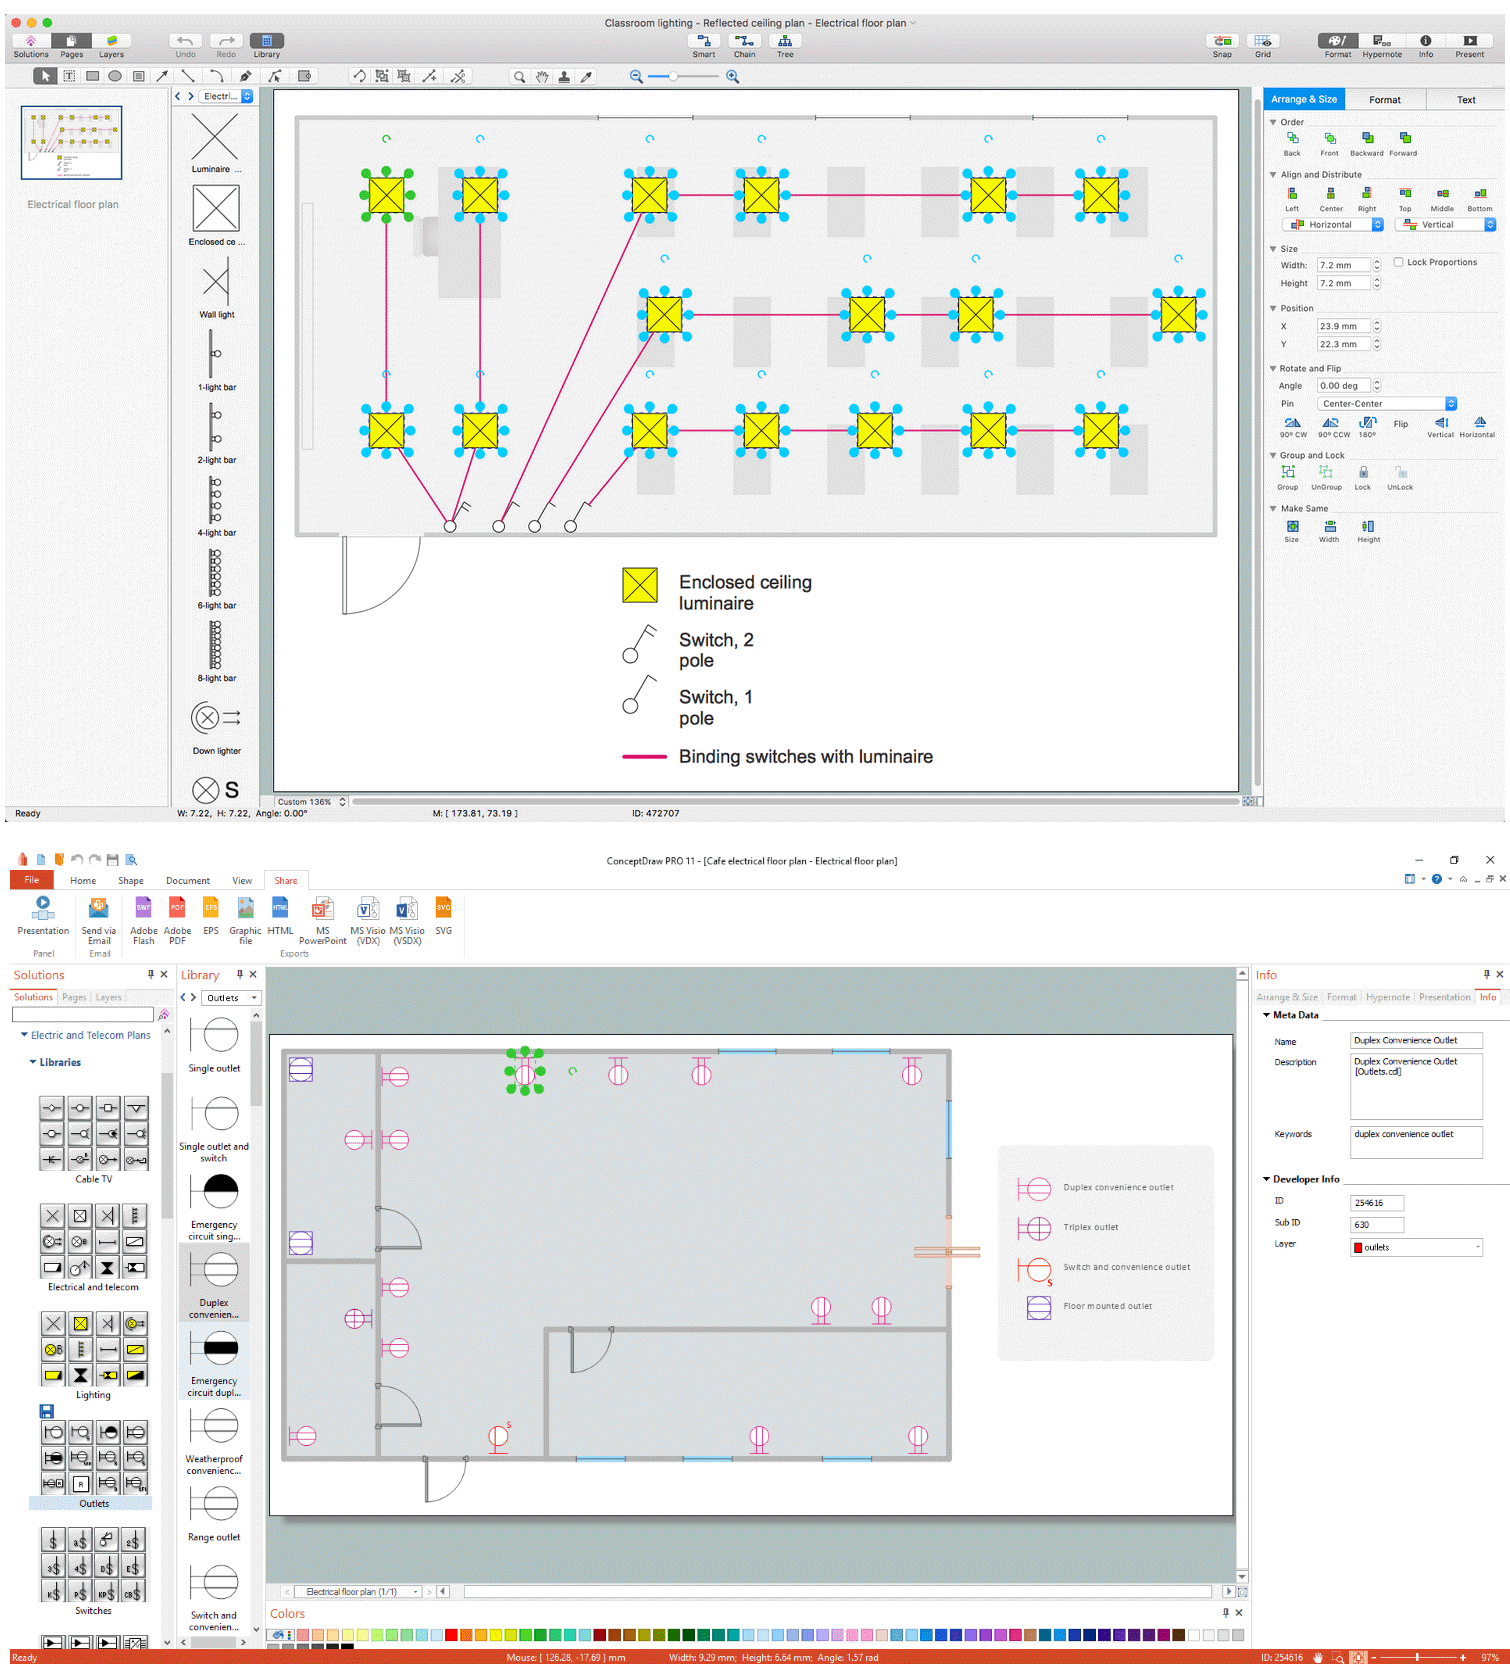
Sample 1. MS Visio look a like diagrams on Mac: Network topology diagram

Sample 2. MS Visio look a like diagrams on Mac: Business Process diagram
To compare ConceptDraw DIAGRAM and MS Visio, it’s obviously that the first one is more convenient in use and, providing the pre-made examples and templates makes ConceptDraw DIAGRAM application a better tool as having the previously created samples means having them as the users’ drafts for drawing their own great looking as well as professional charts, flowcharts, maps, diagrams and other schematics of different complexity. Having the stencil libraries full of design elements, which can be found and downloaded from Solution Park on this site as well as from ConceptDraw STORE, means having enough tools for making the ConceptDraw DIAGRAM users’ drawing smart enough to look as if the professional designer made those plans, schemes, charts and flowcharts. You can always import the files created in MS Visio to ConceptDraw DIAGRAM to continue working with them and to improve their content. So, it will help the MS Visio users to slowly get used to ConceptDraw DIAGRAM as a better and more convenient software.

This sample shows the Workflow Diagram that clearly illustrates stages a BPM consists of and relations between all parts of business. The Workflow Diagrams are used to represent the transferring of data during the work process, to study and analysis the working processes, and to optimize a workflow.