
Pic. 1. ConceptDraw DIAGRAM export menu.
Now you can share your ConceptDraw documents with MS Visio users.
Use thousands of templates and examples to share ConceptDraw documents with MS Visio users:
- Flowcharts
- Business Process Models
- UML Diagrams
- ERD Diagrams
- DFD Diagrams
- IDEF Diagrams
- Building Plans
- Landscape & Garden
- Network Diagrams
- Gantt charts
- Org Charts
- Mind Maps
- Business Infographics
- Dashboards
- Engineering diagrams
- Graphs and Charts
- GEO Maps
- SWOT Matrix
- Marketing Diagrams
- TQM Diagrams
- Value Stream Mapping
- Science and Education diagrams
- Software Development diagrams
- Finance and Accounting flowcharts
No need for any special drawing skills to create professional looking diagrams outside of your knowledge base. ConceptDraw DIAGRAM takes care of the technical details, allowing you to focus on your job, not the drawing.


Pic. 2. Examples: Exporting ConceptDraw DIAGRAM document to MS Visio® XML format file
All source documents are vector graphic documents. They are available for reviewing, modifying, or converting to a variety of formats (PDF file, MS PowerPoint, and many other graphic formats).
See also Samples:
TEN RELATED HOW TO's:
Communication via Internet nowadays is almost irreplaceable part of lifestyle. It’s needless to say that providing that communication is not a piece of cake, and network diagram software is useful for representing all the interconnections between network devices. These diagrams are also helpful for educational purposes.
This drawing depicts the network topology of the sample web studio. This is a physical type of network diagram. It is depicting the network, end-user equipment and connections between them. The given network has combined the both star and mesh network topology features. This diagram is a tool of network administrator. it delivers the actual information on location of servers, hubs, switches, routers, and other telecommunication equipment. The collection of network related symbols provided with ConceptDraw Network Diagrams solution represents the entire network components. All Symbols are standard. Therefore, network specialists can effortlessly decrypt this diagram.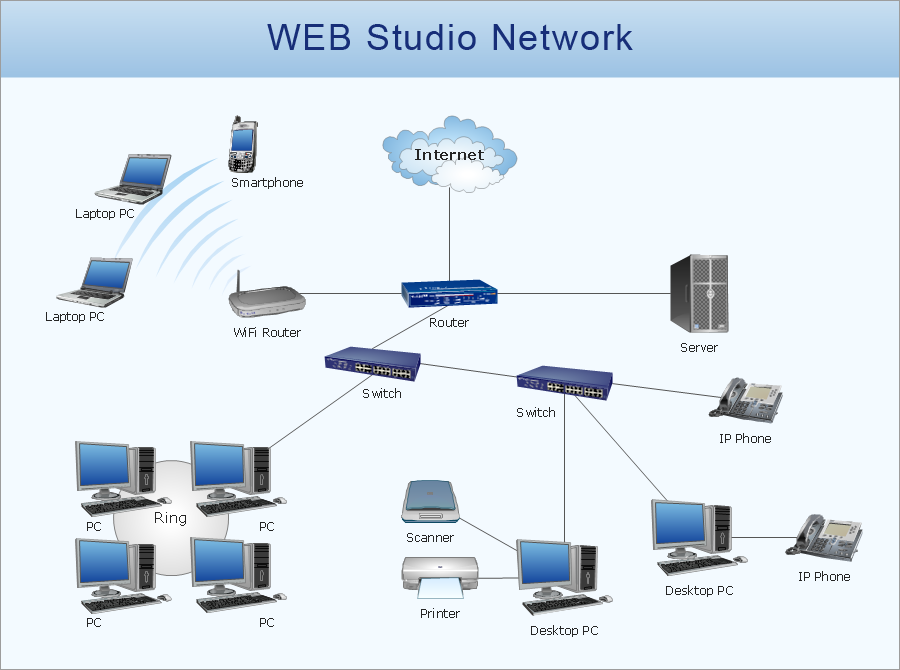
Picture: Network Diagram Software
Related Solution:
Subway infographic design elements of MetroMap and ConceptDraw software tools.
Picture: Subway infographic design elements - software tools
Related Solution:
ConceptDraw DIAGRAM enhanced with Audio, Video, Media solution is a helpful tool for illustration of a CCTV network. It contains library of vector cliparts of video and TV devices and different digital gadgets for drawing such illustrations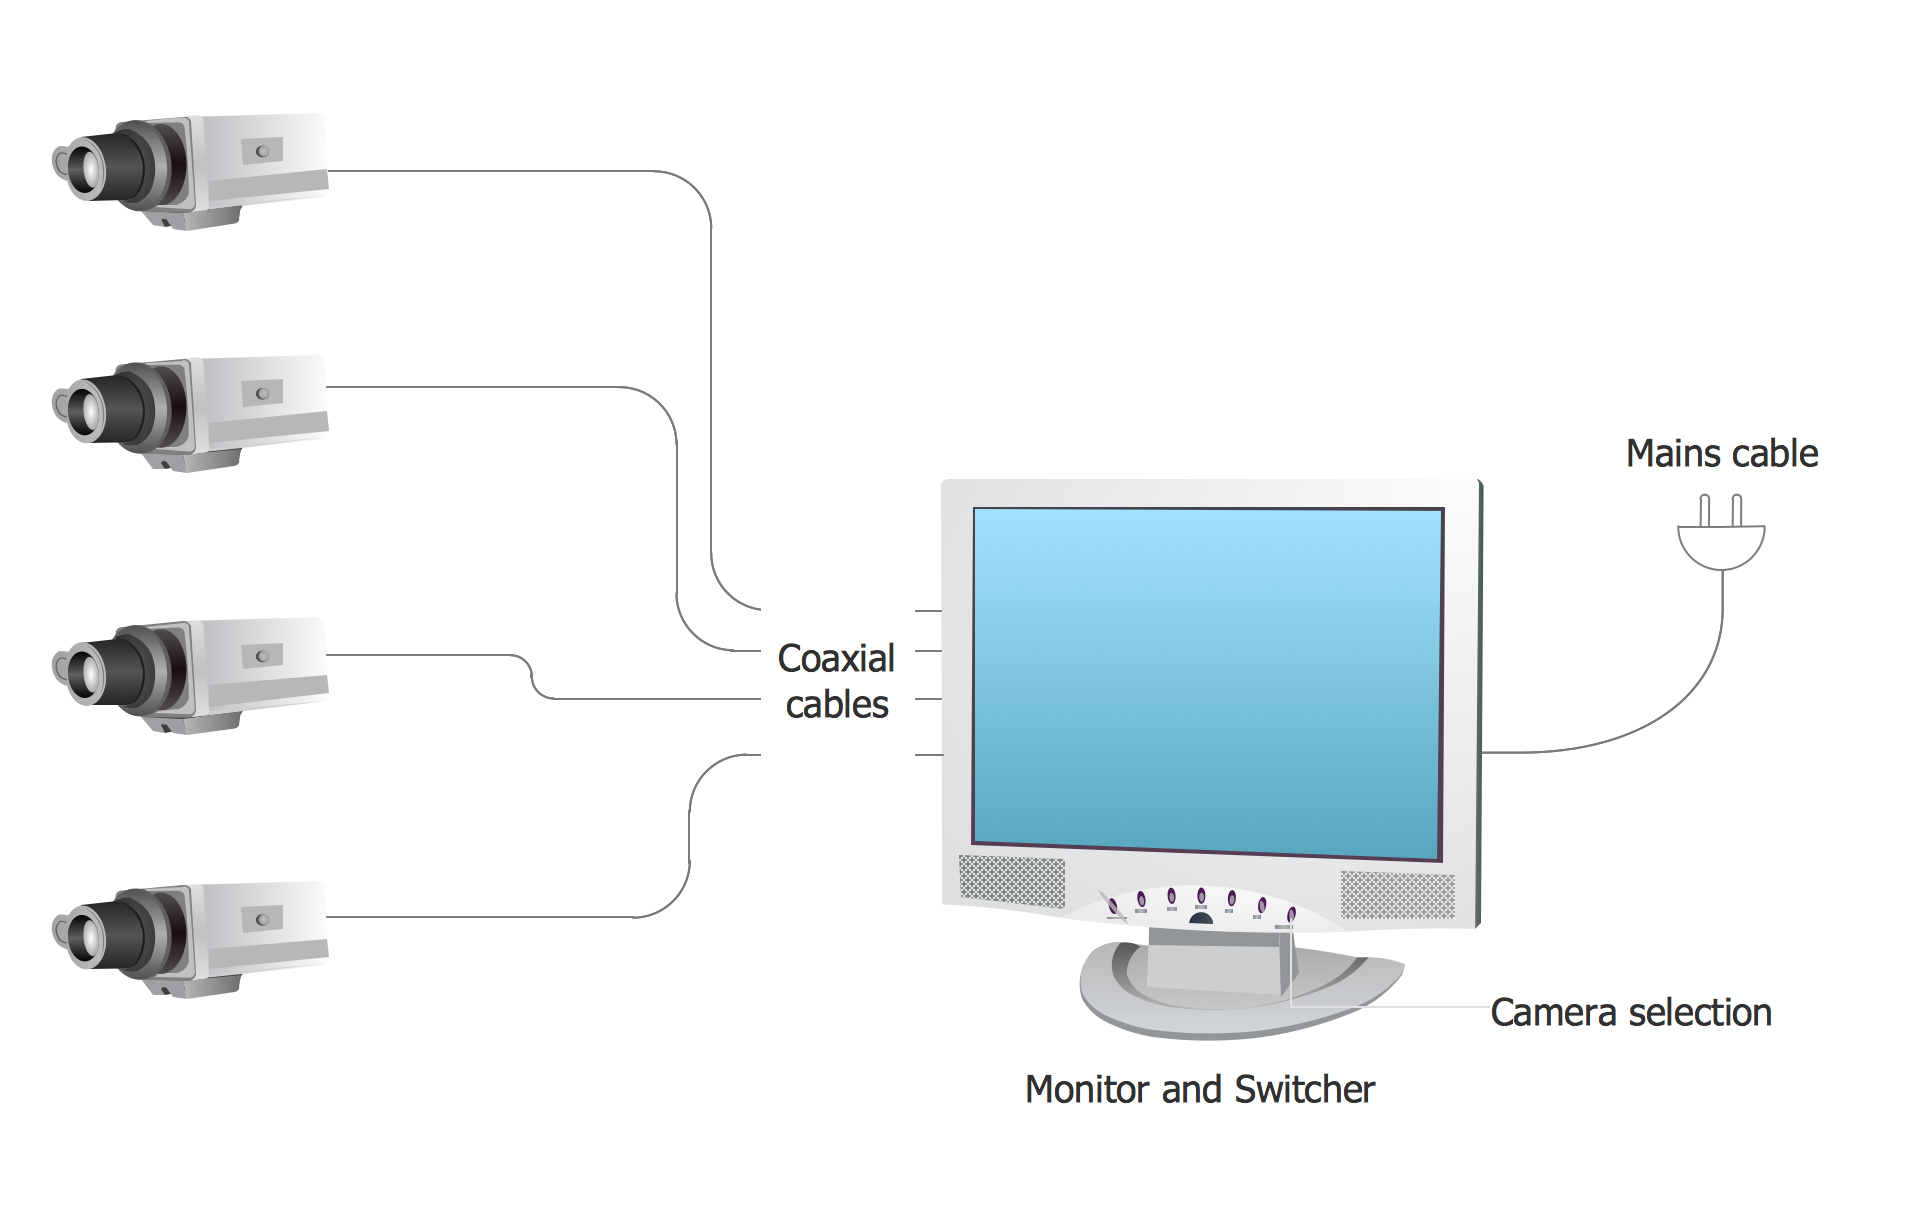
Picture: Basic CCTV System Diagram. CCTV Network Diagram Example
Related Solutions:
The CCTV is the process that carried out using the video cameras for transmitting the signal to the specific location, on the limited set of monitors. We are talking about the video cameras that are used for monitoring on such guarded objects as airports, banks, stores, military objects, etc. CCTV equipment is also used in the industrial installations, for surveillance in the public places, for recording the video on the digital video recorders.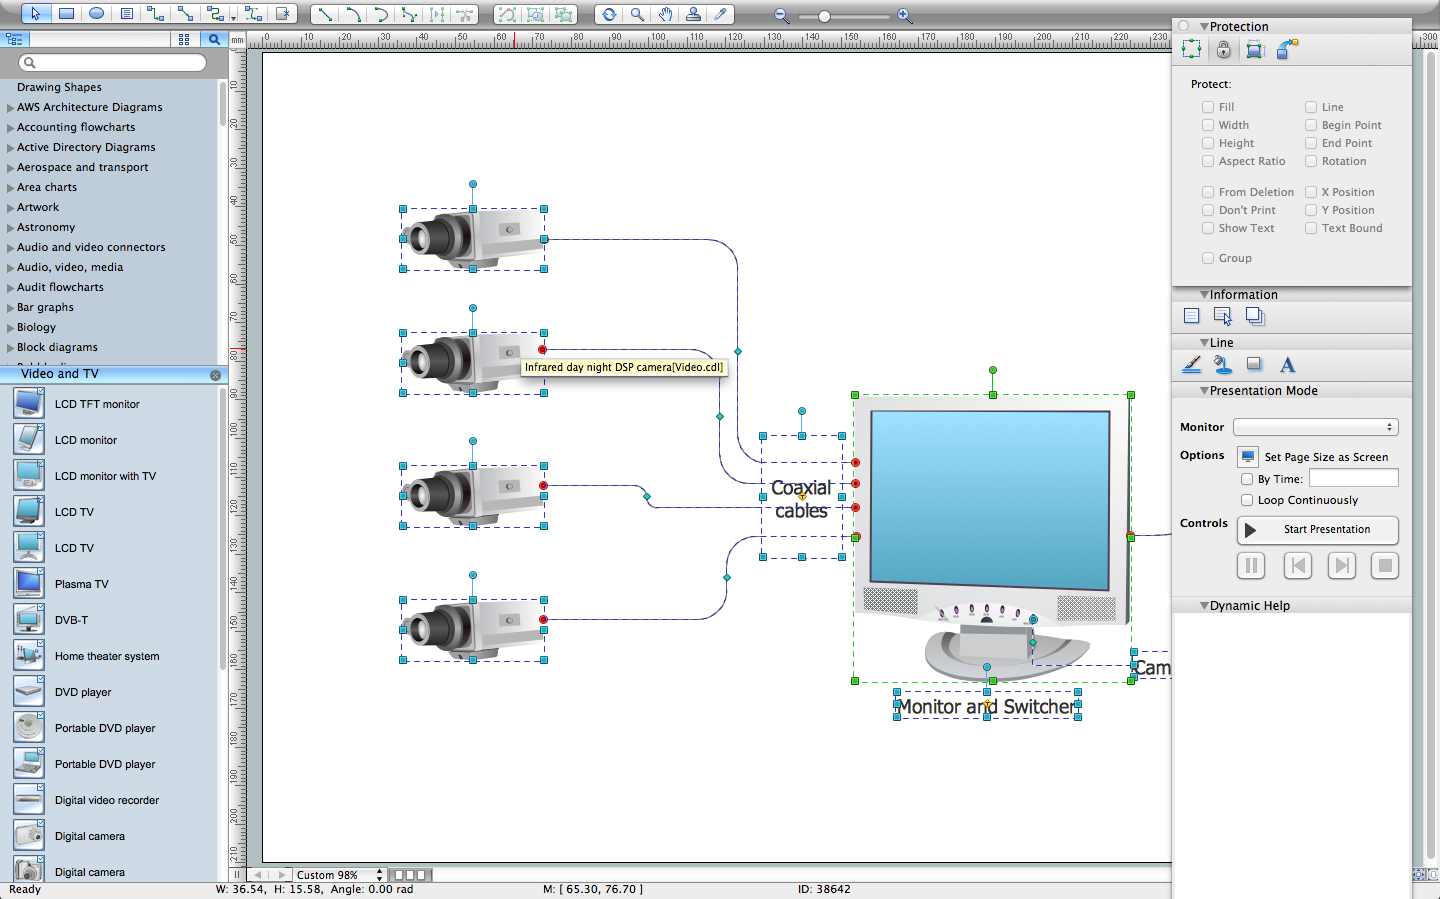
Picture: CCTV Network Diagram Software
Related Solutions:
Variable delay elements are often used to manipulate the rising or falling edges of the clock or any other signal in integrated circuits. Delay elements are also used in delay locked loops and in defining a time reference for the movement of data within those systems.
26 libraries of the Electrical Engineering Solution of ConceptDraw DIAGRAM make your electrical diagramming simple, efficient, and effective. You can simply and quickly drop the ready-to-use objects from libraries into your document to create the electrical diagram.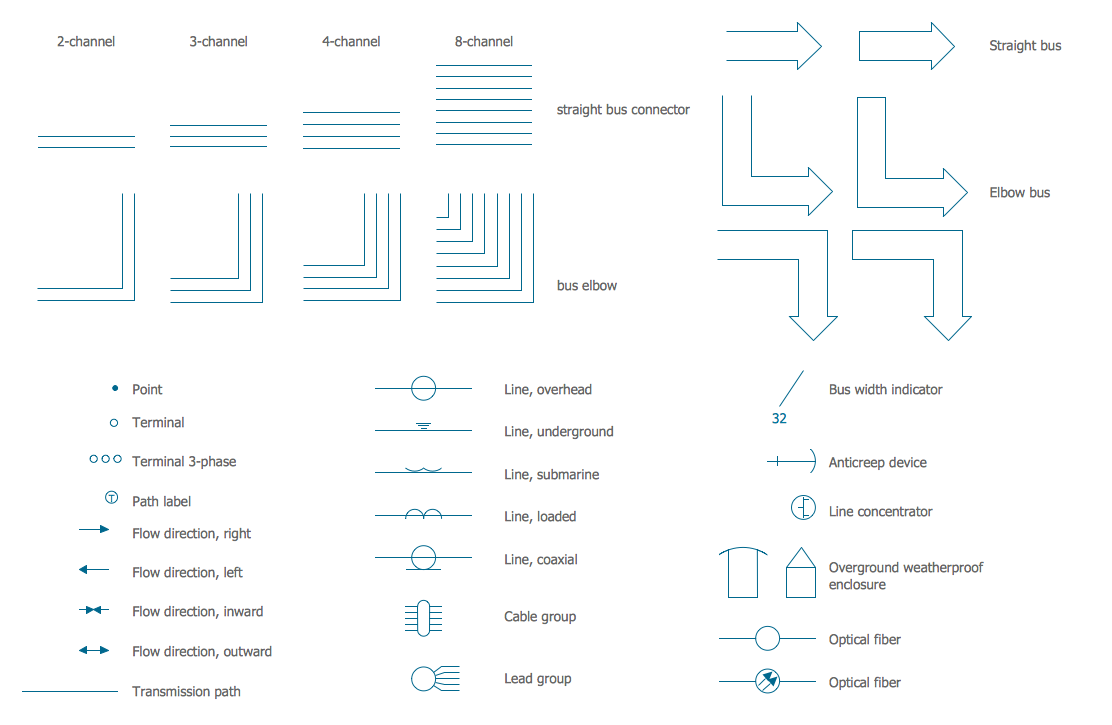
Picture: Electrical Symbols — Transmission Paths
Related Solution:
ConceptDraw DIAGRAM extended with IDEF0 Diagrams solution from the Software Development area of ConceptDraw Solution Park is a powerful diagramming and vector drawing IDEF0 software. All IDEF0 diagrams created in ConceptDraw DIAGRAM are vector graphic documents and can be reviewed, modified and converted to MS Visio XML format. To obtain the IDEF0 Visio documents from ConceptDraw DIAGRAM documents use the wide export possibilities of ConceptDraw DIAGRAM.
Picture: IDEF0 Visio
Related Solution:
ER-modeling nowadays is a very popular approach for database design. If you are tired of looking for a good entity relationship diagram Software for Mac, then your search is almost over. ConceptDraw DIAGRAM is a great tool for creating diagrams of any complexity with tons of editable samples and templates.
This diagram represents the vector library of the Chen’s and Crow’s Foot notation icons for drawing ERD (entity-relationships diagram). ConceptDraw Entity Relationship Diagram solution delivers the ability to visualize databases structure on both Mac and PC. The "bricks" entity-relationships models are the entity, and the relation. An entity is represented by a rectangle comprising the entity name. It means an object, information about which should be available and stored. A relation is intended to show a relations between two entities. There are several types of relations between entities. To show there are a number of different symbols for the types of relationships.
Picture: Entity Relationship Diagram Software for Mac
Related Solution:
Describing a workflow or approval process can take hours and be too complicated, especially since there are options to do it quickly and vividly. Diagrams called flowcharts replace long paragraphs of boring text and represent information in a graphic way. You can draw one on paper or you can use flowchart software to do it quickly and scalable. This kind of software is easy to use and you don’t need any special skills to start using it. In addition, there are a lot examples and predesigned templates on the Internet.
Flowcharts are a best tool for staking out a huge and complex process into some small readable parts. Surely, flowcharts can be drawn manually but the use of standard symbols that make it clear for a wide audience makes a software tool preferred for this task. The core for a successful flowchart is its simplicity. That is why often before beginning making flowchart through software, people draw the sketch on a piece of paper. Designing an effective flowchart means the combination of the data needed to be shown and the simplicity with which you depict it.
Picture: Flowchart Software: A Comprehensive Guide
Related Solution:
The VMware vNetwork Distributed Switch (vDS) is the new virtual switch (vSwitch) with vSphere 4 that extends the set of features of the VMware vNetwork Standard Switch (vSS). The VMware vSS is the base-level virtual networking alternative that extends the capabilities, configuration and appearance of the standard vSwitch in VMware ESX 3.5 to ESX 4.0 and vSphere 4.
This example was created in ConceptDraw DIAGRAM using the Computer and Networks Area of ConceptDraw Solution Park and shows the VMware vDS network diagram.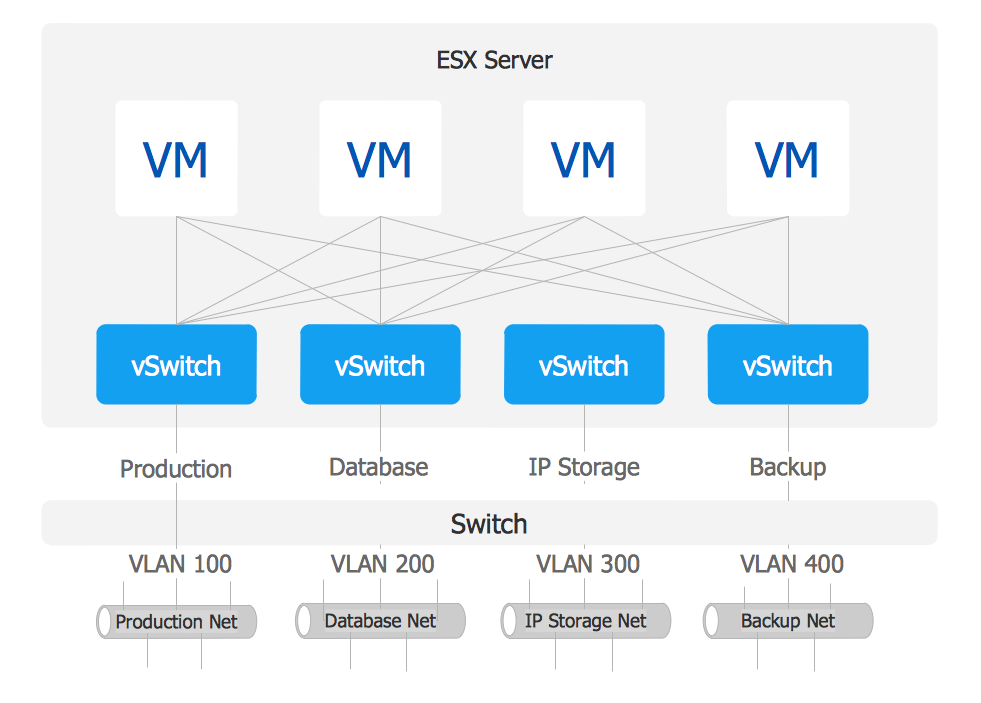
Picture: VMware vNetwork Distributied Switch (vDS). Computer and Network Examples
Related Solution:
Have you ever created the fire plans on the base of Fire Evacuation Plan Template? It's incredibly convenient and time-saving way. Let's try to make sure this with Fire and Emergency Plans solution for ConceptDraw DIAGRAM software.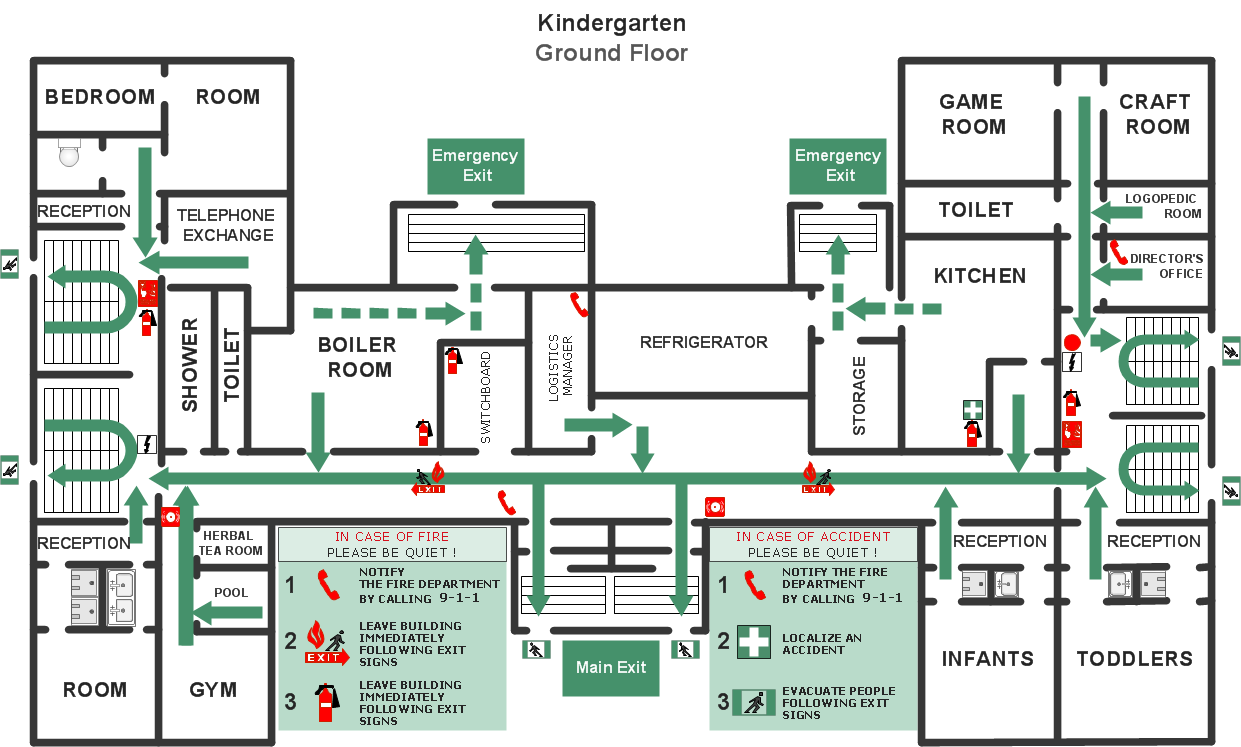
Picture: Fire Evacuation Plan Template
Related Solution:

