UML Diagram Visio
As we progress into the 21st century, our reliance on computer and information systems to facilitate business is greater than ever before. The global market is much too convoluted and relentless to be run on manpower and note-taking alone; software systems are crucial to a company when handling large amounts of data processing, customer transactions, or client databases. As such, their development and maintenance has become a key component in successful company operations.
To structure, plan, and control the development of these systems, a software development life cycle (SDLC) is developed and adhered to. Different methodologies have evolved to be applied for different purposes, based on technical, organizational, project and team needs, but generally all will use some combination of the following stages:
- Problem analyzing
- Market research
- Requirements analysis
- Design
- Implementation (coding)
- Testing
- Deployment
- Maintenance and bug fixing
How strictly this order is followed, and what level of planning and documentation is reached, will depend on the requirements of the business and capabilities of the software. A 'waterfall' approach to the SDLC would see each of these stages carried out in linear order, with detailed planning and risk assessment before coding is even begun. The 'extreme' approach involves a lot less planning and documentation, and focuses more on coding and continuous re-testing, ideal for a smaller system, or one where new components are being added as an ongoing process.
ConceptDraw DIAGRAM are primarily a macOS tool and you can use it to draw many UML diagram types.
How to do it?
Importing and Exporting MS Visio and ConceptDraw DIAGRAM Files
- To Import MS Visio Files to ConceptDraw DIAGRAM
- From the ConceptDraw DIAGRAM File menu, select Import.
- Select MS Visio VSDX.
- From the Open window, select the desired MS Visio file to be imported. Click Ok.
- To Export ConceptDraw DIAGRAM files to MS Visio:
- From the File menu, select Export.
- Select MS Visio VSDX.
- From the Open window, select the desired location folder. Click Ok.

Pic. 1. Importing and Exporting MS Visio and ConceptDraw DIAGRAM Files
This sample was created in ConceptDraw DIAGRAM diagramming and vector drawing software using the UML Class Diagram library of the Rapid UML Solution from the Software Development area of ConceptDraw Solution Park.
The document of ConceptDraw DIAGRAM with UML Class Diagram is a vector graphic document and can be reviewed, modified or convert to a MS Visio format.
This sample shows the UML Class Diagram that was created in ConceptDraw DIAGRAM on the Mac and then was opened for editing in MS Visio.
This sample describes the trade relations and can be used in business, in commercial relations.

Pic. 2. UML Diagram Visio & UML Diagram ConceptDraw
Using the 13 libraries of the Rapid UML Solution for ConceptDraw DIAGRAM you can create your own visual vector UML diagrams quick and easy.
UML Resource:
TEN RELATED HOW TO's:
Using diagrams, you can visualize the flow of the information or build a detailed data structure. There's no need to have a degree in software and database design with ConceptDraw DIAGRAM , because this software has all the tools needed in developing models and diagrams. Project planning, designing and prototyping was never so easy.
This UML diagrams can be used to visualize a model of the data base development process. A UML diagram shows a graphical view of a structure of software system: components and relationships.
Using Unified Modeling Language helps to depict logical and physical elements of a data base, visually represent requirements and sub-systems. UML diagrams allows developers to organize and predict critical issues, as well as collaborate data base information.
Picture: Software and Database Design with ConceptDraw DIAGRAM
Related Solution:
Definition, examples, layout options, best practices, and common mistakes for cross functional flowcharts (swimlane diagrams).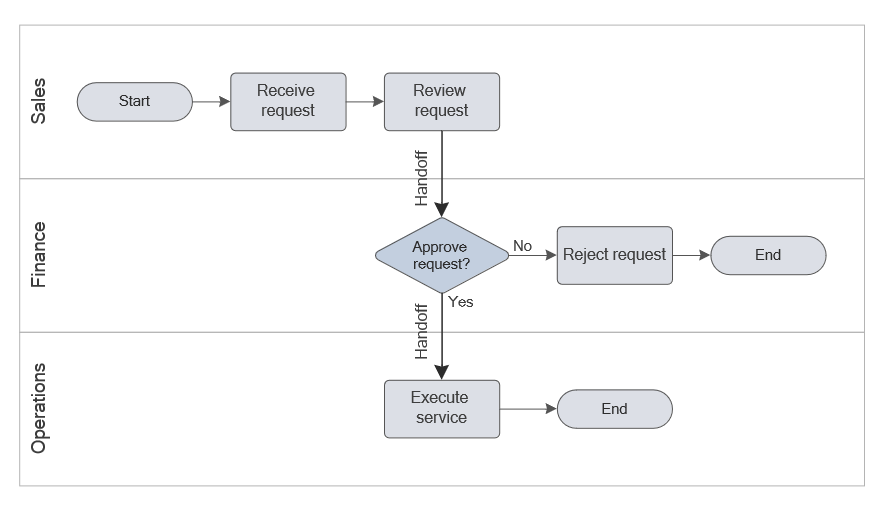
Picture: Cross Functional Flowchart (Swimlane Diagram): Definition, Structure, Examples, and How to Create
Related Solution:
The most easier way of creating the visually engaging and informative Sales Process Flowchart is to create the new ConceptDraw document and to use the predesigned vector symbols offered in 6 libraries of the Sales Flowchart Solution. There are more than six types of sales process flow diagrams, ConceptDraw DIAGRAM software is flowchart maker which include six collections of extended flowchart symbols for effective diagramming. There are main collections of color coded flowchart symbols: Sales Department, Sales Steps, Sales Workflow, Sales Symbols and special set of Sales Arrows and Sales Flowchart.
Picture: Sales Process Flowchart Symbols
Related Solution:
This sample was created in ConceptDraw DIAGRAM diagramming and vector drawing software using the Bar Graphs Solution from Graphs and Charts area of ConceptDraw Solution Park. It is Bar Graphs example, Sales Growth example, Column Chart Example - Sales Report.
Picture: Sales Growth. Bar Graphs Example
Related Solution:
This sample was created in ConceptDraw DIAGRAM diagramming and vector drawing software using the UML Sequence Diagram library of the Rapid UML Solution from the Software Development area of ConceptDraw Solution Park.
This sample shows the interactions of the customer with the system and is used at the registration on the sites.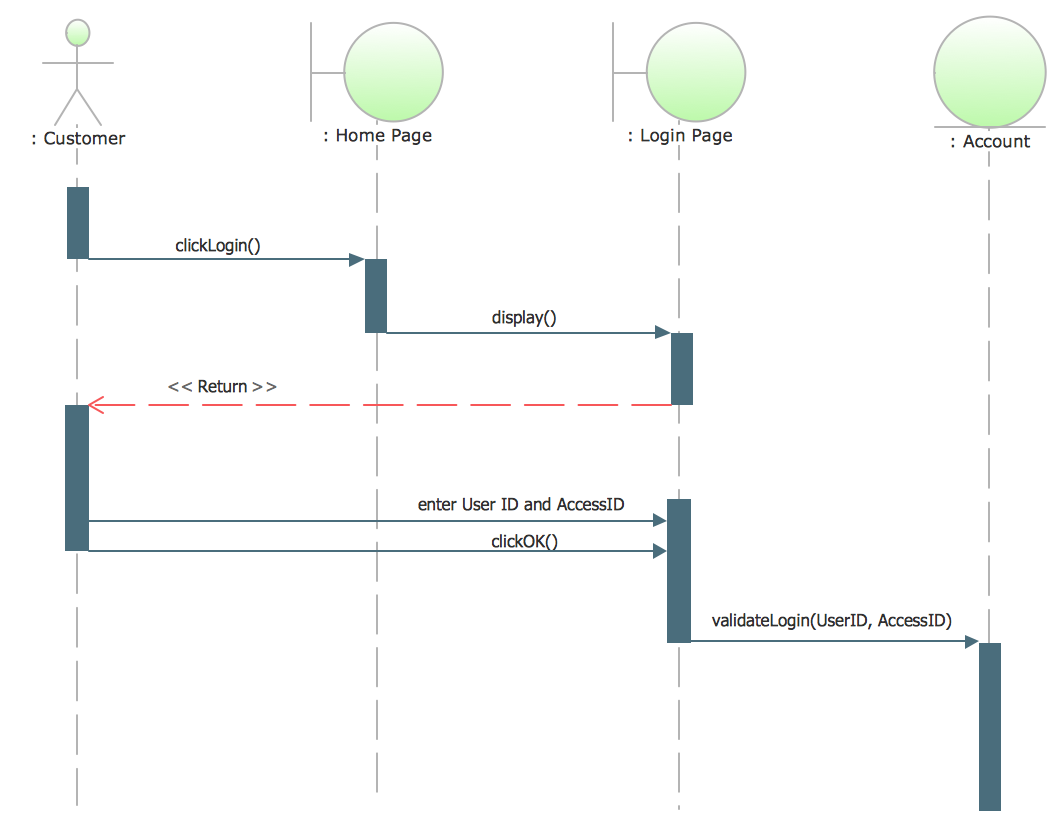
Picture: UML Sequence Diagram Example. SVG Vectored UML Diagrams Tools
Related Solution:
Draw Network Topology and Computer Network Diagrams, Designs, Schematics, and Network Maps using ConceptDraw in no Time!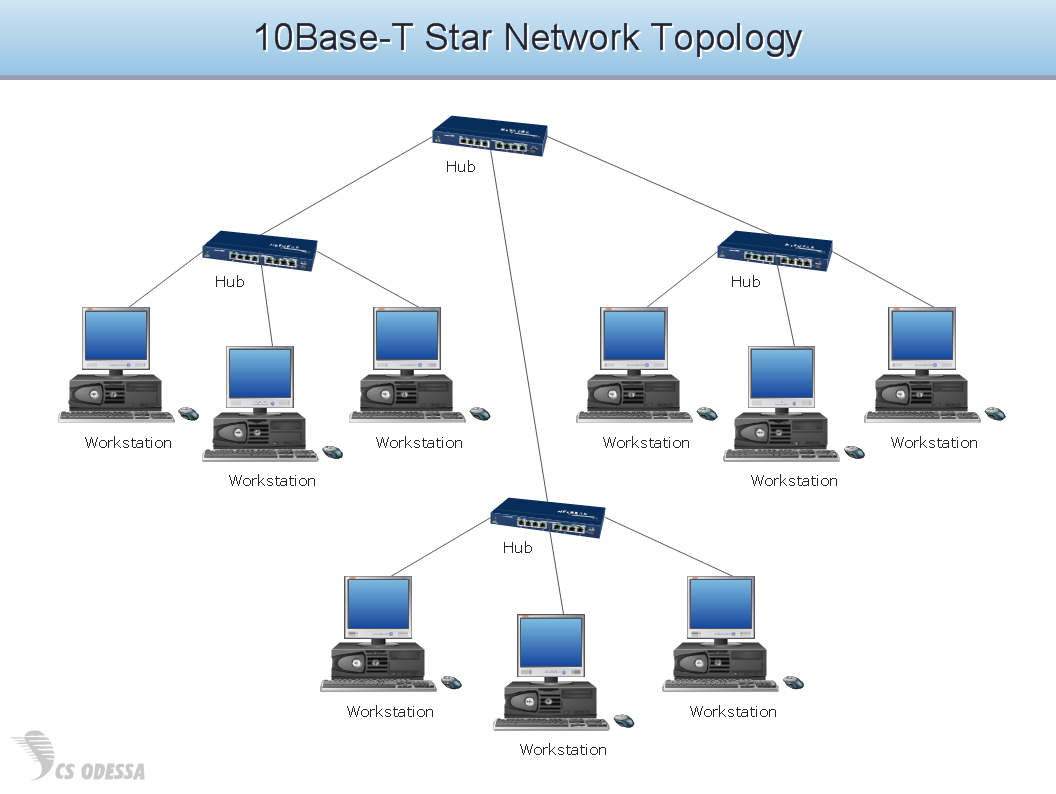
Picture: Network Diagram SoftwareTopology Network
Voice-over-Internet protocol (VoIP) is a protocol of the voice communications and multimedia sessions through the Internet or other packet-switched networks. VoIP systems use the data compression techniques, encapsulated in a data-packet stream over IP. They allows users to use regular telephone networks through any internet service provider and anywhere. VoIP is also called IP telephony, Internet telephony, Voice over broadband (VoBB).
This example was created in ConceptDraw DIAGRAM using the Computer and Networks Area of ConceptDraw Solution Park and shows the VoIP Network.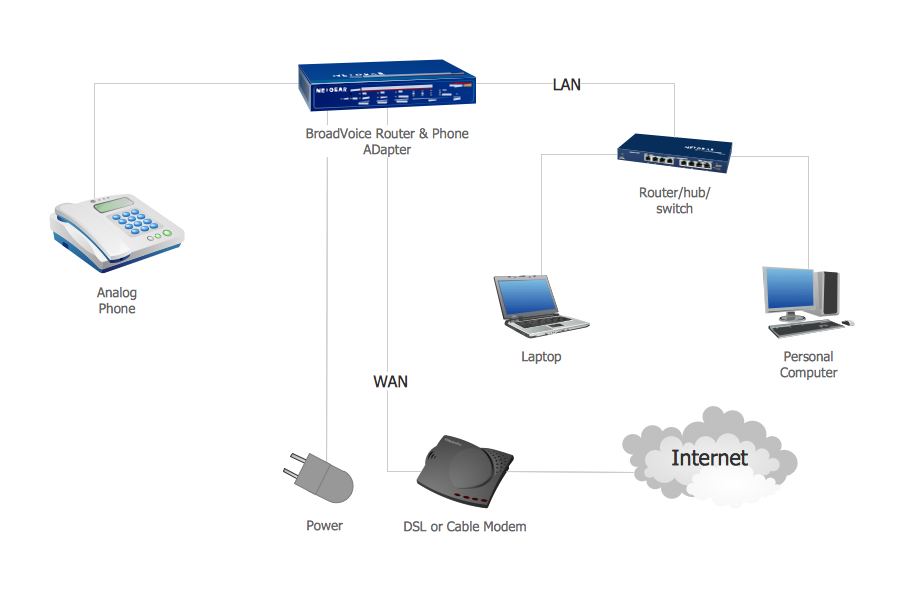
Picture: Network VOIP. Computer and Network Examples
Related Solution:
Perfect Network Diagramming Software with examples of LAN Diagrams. ConceptDraw Network Diagram is ideal for network engineers and network designers who need to draw Logical Network diagrams.
Picture: Network Diagram SoftwareLogical Network Diagram
Successful quality management implemented in a company of any size is a critical component of a company organization.
Picture: What is a Quality Management
Related Solution:
This sample shows the UML Class Diagram of delivery system. On this diagram you can see the classes that are connected with aggregation and composition associations indicated with the multiplicity. This sample can be used by delivery services, postal services.
Picture: UML Diagram for System
Related Solution:
