Made with
ConceptDraw
DIAGRAM 18

Program Evaluation and Review Technique
(PERT) with ConceptDraw DIAGRAM

PERT method (Program Evaluation and Review Technique) is developed by the Ministry of Defense of the USA in 1958 in the framework of the project Polaris. PERT diagram is one of the tools for project management. With its help it is possible to analyze the time which is necessary for project execution and the consequence of tasks which involved into the project. The main advantage of such diagram type over the other diagram types is the possibility of calculation of the project fulfillment critical path that is the consequence of tasks which has the minimal float for execution and on which the total time for the whole project execution depends. If the task on the critical path is delayed than the execution of the whole project is delayed. There for it is important to calculate the critical path of the whole project execution and pay the most attention to tasks which appear on this way.

PERT Diagram is a more realistic approach of a project's time estimate analysis. After PERT chart was constructed user can discover the shortest possible duration for entire project timescale. The project timeline is the longest chain that might be taken with connected tasks on the PERT Diagram. Completion of serial tasks need to be accomplished in a presented order. At a project timeline can be independent tasks that not linked with main sequence they are called parallel tasks. PERT diagram is more suitable for Critical Path Analysis than Gantt chart for the reason that it undoubtedly better figure task dependencies. Project managers customarily utilize both methodologies.

It should be considered that PERT diagram does not give you ready concrete decisions but it helps you to find these decisions.

PERT diagram is constructed by definite rules. It represents the set of tasks, connected between each other in the consecution of their execution.
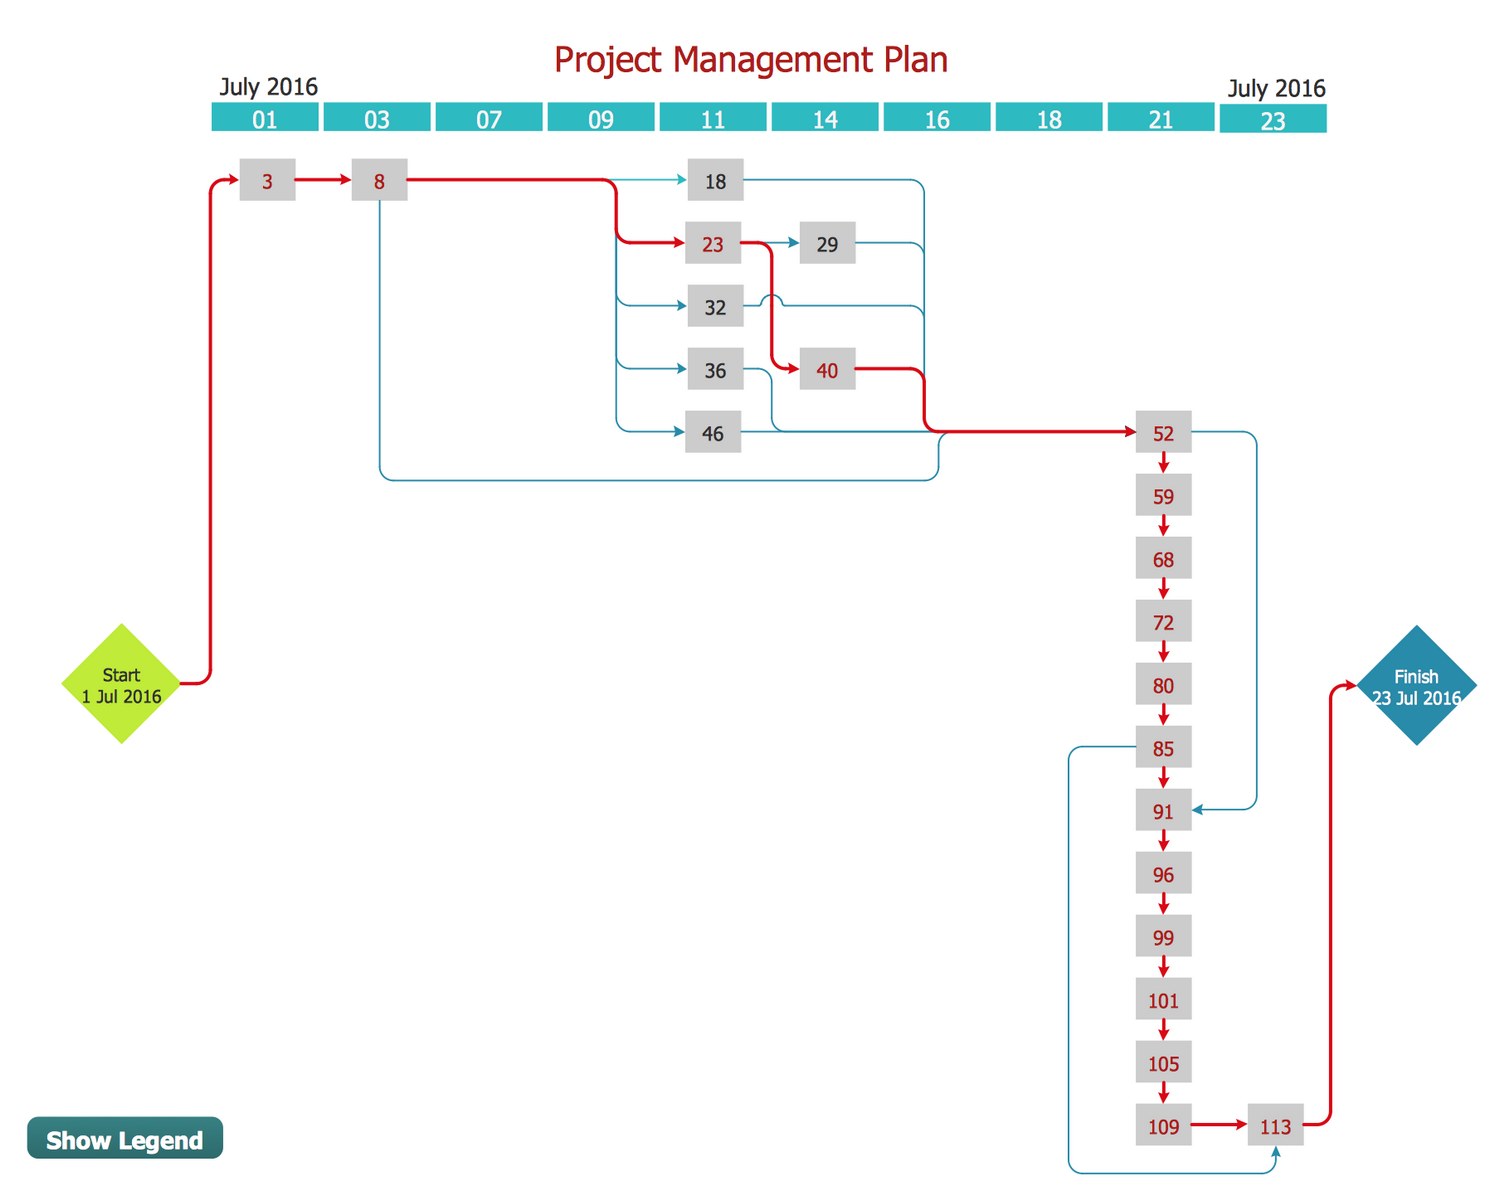
Program Evaluation and Review Technique (PERT) with ConceptDraw DIAGRAM title=

PERT benefits:

  • With a PERT method users can decide how to split project phases and choose the tasks' specification and dispose relations between them.
  • Different contractors involved in the project can coordinate the work on their tasks.
  • PERT determines schedule based on the availability of resources assigned to project tasks.
  • Decrease completion time of different tasks or supposed additional actions.
  • PERT utilizes resources within flexibility for implementing a thrift.
  • Attracting more management attention to critical stages of the project.

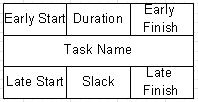
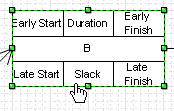
There are two variants of PERT diagram construction. In the first variant the duration is denoted on arrow connecting diagram nodes. Such diagram type is called AOA (activity on arrow).

The second type of PERT diagram is called AON (activity on node). In such diagram the information about the task duration is denoted in the diagram node and each task is represented in the form of rectangle with the definite set of fields. These are the task name, duration, early and late starts and early and late finishes of the task and also the float for execution of the given task.

Program Evaluation and Review Technique(PERT) Diagram

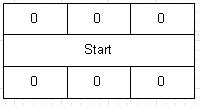
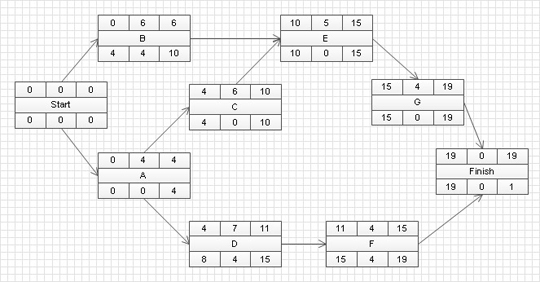
Pic 1. PERT Diagram — AON (activity on node)

With the help of ConceptDraw you can build diagrams of any type, but we recommend you using of AON variant, because such diagram type is easier for building and perception.

PERT diagram starts from the task which does not have duration and does not use resources and presents just a project start. This is done to denote the common start of the project as starting from the first day of the project several tasks are starting simultaneously. Analogously PERT diagram finishes with the task “finish”.

Program Evaluation and Review Technique - Start

Pic 2. PERT Diagram

No task is able to start before the preceding task is finished. Also each task may represent a separate project with its subtasks, which can be displayed on a separate diagram. In ConceptDraw this can be realized in the form of hyperlinks assigned to such tasks. These hyperlinks may point at some pages of your ConceptDraw document where the corresponding PERT diagrams are placed.

Program Evaluation and Review Technique - Link

Pic 3. PERT Diagram — Task

Objects for PERT diagrams building are gathered in a separate ConceptDraw objects library. To start working it is enough to launch PERT Chart template from ConceptDraw STORE.

To create a PERT diagram with ConceptDraw, it is enough to drag on a document page the number of ready objects, representing tasks, and then connect them between each other and fill out necessary task fields.

Program Evaluation and Review Technique Diagram

Pic 4. PERT Diagram with ConceptDraw

However, a Gantt chart gives more information than PERT diagram, and that assume to expand the information on it:

  • activity name
  • normal duration time
  • early start time (ES)
  • early finish time (EF)
  • late start time (LS)
  • late finish time (LF)
  • slack

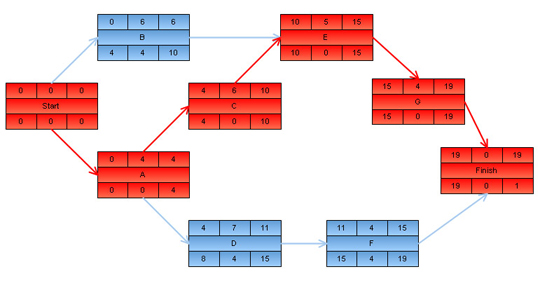
Task appeared on the calculated critical path are marked out with red color. This way any person is able to see at once tasks which require special attention.

Program Evaluation and Review Technique - Critical Path

Pic 5. PERT Diagram — Critical Path

ConceptDraw PERT diagram software works across any platform, meaning you never have to worry about compatibility again. ConceptDraw DIAGRAM allows you to make PERT diagram on PC or macOS operating systems.

The samples you see on this page were created in ConceptDraw DIAGRAM using the Seven Management and Planning Tools solution, and demonstrate the solution's capabilities and the results you can achieve using this solution.

Seven Management and Planning Tools solution

Program Evaluation and Review Technique <br>(PERT) with ConceptDraw DIAGRAM  *

Pic 6. Program Evaluation and Review Technique (PERT) Diagram — Software Development Plan

The following features make ConceptDraw DIAGRAM the best Program Evaluation and Review Technique (PERT) Diagram Software:

  1. You don't need to be an artist to draw professional looking diagrams in a few minutes.
  2. Large quantity of ready-to-use vector objects makes your drawing diagrams quick and easy.
  3. Great number of predesigned templates and samples give you the good start for your own diagrams.
  4. ConceptDraw DIAGRAM provides you the possibility to use the grid, rules and guides. You can easily rotate, group, align, arrange the objects, use different fonts and colors to make your diagram exceptionally looking.
  5. All ConceptDraw DIAGRAM documents are vector graphic files and are available for reviewing, modifying, and converting to a variety of formats: image, HTML, PDF file, MS PowerPoint Presentation, Adobe Flash, MS Visio.
  6. Using ConceptDraw STORE you can navigate through ConceptDraw Solution Park, managing downloads and updates. You can access libraries, templates and samples directly from the ConceptDraw STORE.
  7. If you have any questions, our free of charge support is always ready to come to your aid.


TEN RELATED HOW TO's:
Draw detailed Computer Network Diagrams, Designs, Schematics, and Network Maps with ConceptDraw DIAGRAM in no time! Pre-drawn shapes representing computers, network devices plus smart connectors help create accurate diagrams and documentation.Network Diagramming with ConceptDraw DIAGRAM  *
Picture: Network Diagramming with ConceptDraw DIAGRAM
Project timeline is a type of chart which allows visually represent the chronology of works for the project, placing the key points of the project (milestones) on a timescale. You need to make professional looking project timeline? Create it with ConceptDraw DIAGRAM! ConceptDraw DIAGRAM extended with Timeline Diagrams Solution from the Management Area is the best timeline diagrams softwareProject Timeline *
Picture: Project Timeline
Related Solution:
Nodes of any computer network are somehow organized in a hierarchy or a layout. Some of the common layouts like star network topology are more reliable and some like ring topology withstand high loads better. It is also important to distinguish logical topologies from physical. This diagram represents a typical view of the star network topology. The star network topology is one of the most frequently used network topologies in the majority of office and home networks. It is very popular because of its low cost and the easy maintenance. The plus of the star network topology is that if one computer on the local network is downed, this means that only the failed computer can not send or receive data. The other part of the network works normally. The minus of using star network topology is that all computers are connected to a single point-switch, or hub. Thus, if this equipment goes down, the whole local network comes down.Star Network Topology *
Picture: Star Network Topology
Related Solution:
Project progress on web: delivering project status to remote teams and stakeholders via Skype.How To Show Project Progress Peport on Web *
Picture: How To Show Project Progress Peport on Web
Related Solution:
Every good manager has to predict different situations that might occur in any process. If only every of them Swot Analysis Examples at that time, I could have succeeded in my career. Unfortunately I didn't have any notion about it. This is a sample of SWOT diagram. This is also a mean of marketing strategy elaboration. Before as filling this table, marketing manager has to investigate both external and internal factors. The effective SWOT analysis helps to gain benefits from opportunities and decrease threats by conversion of strengths and weaknesses into advantage. The SWOT and TOWS Analysis solution to ConceptDraw offers a number of template matrices for SWOT, designed to support a marketing strategy development process.Swot Analysis Examples *
Picture: Swot Analysis Examples
The Seven Management and Planning Tools is a tool for Root Cause Analysis Tree Diagram drawing. This diagram is for Root Cause Analysis. Analyze the root causes for factors that influenced the problem. This diagram is constructed separately for each highly prioritized factor. The goal of this is to find the root causes for the factor and list possible corrective action.Root Cause Analysis *
Picture: Root Cause Analysis
Using the Business Diagrams Solution you can create your own professional-looking Venn Diagrams quick and easy.Venn Diagram Example - 3 Circle Venn Diagram
Picture: 3 Circle Venn Diagram. Venn Diagram Example
Related Solution:
The Total Quality Management Diagram solution helps you and your organization visualize business and industrial processes. Create Total Quality Management diagrams for business process with ConceptDraw software.Total Quality Management Business Diagram *
Picture: Total Quality Management Business Diagram
Related Solution:
ConceptDraw DIAGRAM is workflow diagram software enhanced by numerous extentions from ConceptDraw Solution Park. It inludes many professional workflow diagrams, examples and ready to use workflow diagram and workflow symbols. Workflow symbol collections include symbols for Processes, Planning, Scheduling, Flow Control, In-Transit Process Visibility. The best workflow diagram software you may find is ConceptDraw DIAGRAM. ConceptDraw DIAGRAM is world-known diagramming software that works for both Windows and Mac OS X platforms. The software contains complete set of features allows to draw diagrams faster. ConceptDraw DIAGRAM extended with the Workflow Diagram solution provides additional libraries, templates and samples for drawing professional workflow diagrams.Workflow Diagram Software *
Picture: Workflow Diagram Software
Related Solution:
Waterfall chart shows the changing of the value from one state to another through the series of intermediate changes. The waterfall diagrams are widely used in the business. They are used to represent the set of figures and allow link the individual values to the whole.Waterfall Bar Chart *
Picture: Waterfall Bar Chart
Related Solution:
ConceptDraw
DIAGRAM 18