Made with
ConceptDraw
DIAGRAM 17

Developing Entity Relationship Diagrams

Entity Relationship diagrams are the powerful tool for clear and visual modeling the relationships between database entities. When developing Entity Relationship Diagrams are used a set of common block objects and lines to describe the structure of a database.

Use the ConceptDraw DIAGRAM software extended with Entity-Relationship Diagram (ERD) solution from the Software Development area of ConceptDraw Solution Park for designing ER diagrams, which offers the predesigned commonly used Entity relationship symbols and ER objects. Thanks to them you can make the ERDs easy understandable for all your colleagues.

Developing Entity Relationship Diagrams *

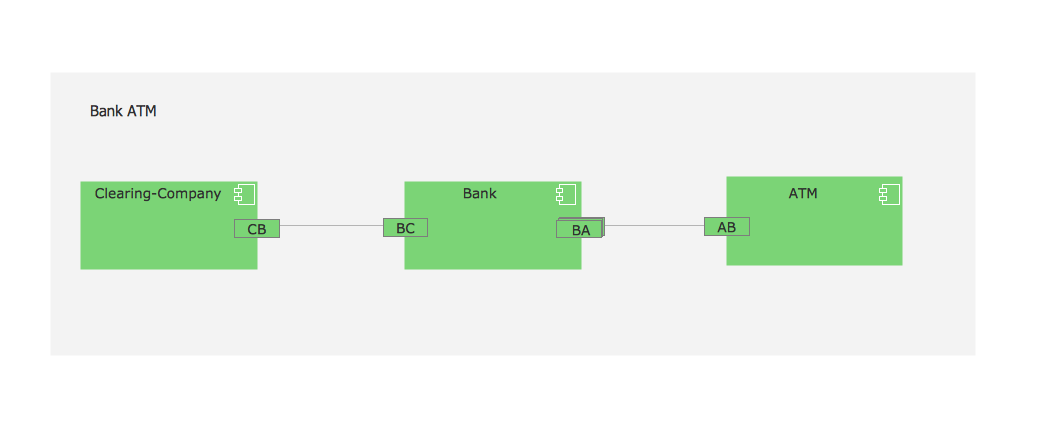
Sample 1. Entity Relationship Diagram (ERD), crow's foot notation


How to Build an Entity Relationship Diagram

When you need to visually represent the structure of relational database, Entity relationship diagram (ERD) is the best type of diagram for that case.

Most entity-relationship diagrams can be built with objects from Flowchart solution or ERD Solution which contains inbuilt templates. Follow these steps to create your own custom ERD diagram.

Don't be frightened if it looks complex, ConceptDraw DIAGRAM makes it easy to create an ERD, and hundreds of other diagrams, in minutes.

  • Start drawing with Entity object from Crow's foot ERD object.
    Note: This object contains several levels:
    1 - object itself
    2 - lines in the object
    3 - separate cell.
  • It is possible to set different setting to each level.
  • To switch from level to level, click on object with separate clicks when it's selected.

    Developing Entity Relationship Diagram

  • Add text.
  • Change object's color.

    Developing Entity Relationship Diagram

  • Copy Teachers table.
  • Add new rows via drop-down menu.
    Note: Adding and removing is always performed from a bottom row.
  • New added row will have same preferences as bottom one.

    Developing Entity Relationship Diagram

  • Paste copied table as many times as you need.

    Developing Entity Relationship Diagram

  • Filling the table.
    Note: To fill a separate cell, select it clicking with 3 separate clicks.
  • Delete excess rows via drop-down menu for each table.

    Developing Entity Relationship Diagram

  • Use M:1 (many-to-one) connector from ERD Crow’s Foot Notation library.
  • Connect needed rows of tables.

    Developing Entity Relationship Diagram

  • If you want to change connectors' type, select all connectors with held Shift button and click on Smart connector icon at ribbon.
  • To change connectors' elbow position, pull the yellow control dot.

    Developing Entity Relationship Diagram

  • Select tables from left and set the same distribution.

    Developing Entity Relationship Diagram

  • You may block the horizontal moving for object, so figure might be moved only vertically.

    Developing Entity Relationship Diagram

  • Use M:M (many-to-many) connector from ERD Crow’s Foot Notation library.
  • Set the needed connection.
    Note: When connector's end reaches connection point, it changes its appearance.

    Developing Entity Relationship Diagram

  • Edit connector's path manually with yellow control dots.

    Developing Entity Relationship Diagram

  • Select all with command+A.
  • Inspectors - Line - remove object lines (stroke).

    Developing Entity Relationship Diagram

  • Export your document to one of graphic formats.

    Developing Entity Relationship Diagram

  • Set the format and quality.

    Developing Entity Relationship Diagram

  • Your file is ready!

    Developing Entity Relationship Diagram

The Entity-Relationship Diagram (ERD) solution from ConceptDraw Solution Park extends ConceptDraw DIAGRAM ector graphics and diagramming software with the ability to describe successfully a database using the Entity-Relationship model and easy create ERD.


Video. How to Build an Entity Relationship Diagram (2min 05sec)

Use ConceptDraw DIAGRAM enhanced with Entity Relationship Diagram (ERD) solution to draw you own ER diagrams using Chen's or Crow's Foot notations.


TEN RELATED HOW TO's:
How to Draw ER Diagrams? With Entity-Relationship Diagram (ERD) solution from the Software Development Area for ConceptDraw Solution Park you are able to draw ER diagram with no problem. It includes 45 predesigned icons advocated by popular Chen's and Crow’s Foot notations that can be used when describing an enterprise database.How to Draw ER Diagrams *
Picture: How to Draw ER Diagrams
Related Solution:
ConceptDraw DIAGRAM diagramming and vector drawing software offers the Entity-Relationship Diagram (ERD) Solution from the Software Development Area for ConceptDraw Solution Park. How many examples contains the Entity-Relationship Diagram (ERD) Solution! All Entity Relationship Diagram examples were designed and saved for ConceptDraw DIAGRAM users. Now they are available from ConceptDraw STORE.Entity Relationship Diagram Examples *
Picture: Entity Relationship Diagram Examples
Related Solution:
Flow chart is a diagrammatic representation of an algorithm and essential part of planning the system. Flow charts are widely used in technical analysis and programming for easy writing programs and explaining them to others. So, one of the most popular type of flow charts is Technical Flow Chart. Technical Flow Chart can be drawn by pencil on the paper, but it will be easier to use for designing a special software. ConceptDraw DIAGRAM diagramming and vector drawing software extended with Flowcharts Solution from the "Diagrams" Area of ConceptDraw Solution Park will be useful for this goal.Technical Flow Chart *
Picture: Technical Flow Chart
Related Solution:
Database design is an important part of any project, as databases become more and more complex nowadays. To make the model more representative, entity relationship diagrams are widely used in software engineering area. These diagrams show sets of entities as rectangles connected via lines labeled with their cardinalities. This an example of the ER-diagram developed to store information regarding some online role-playing game. It includes three main elements of ER diagram: entities, relationships and attributes. The entities, attributes and relationships on this ER-diagram is depicted according to the Chen's notation. Chen's notation for Entity Relationship diagrams admits using of rectangles to depict entities, ovals for attributes and ,at least, diamonds to show relationships. ConceptDraw Entity-Relationship Diagrams solution was applied as ERD software to create this diagram.ConceptDraw DIAGRAM ER Diagram Tool *
Picture: ConceptDraw DIAGRAM ER Diagram Tool
Related Solution:
Data modeling is actively applied in analysis and uses wide set of methods for description the data requirements in a system. One of the most popular and well-known is the ERD method of database modeling. The best ERD tool for the Mac and Windows is ConceptDraw DIAGRAM software extended with the Entity-Relationship Diagram (ERD) solution from the Software Development Area for ConceptDraw Solution Park, which is sharpened for professional ERD drawing and data modeling with Entity Relationship Diagram.Data Modeling with Entity Relationship Diagram *
Picture: Data Modeling with Entity Relationship Diagram
Related Solution:
Database structures are usually described by ER-diagrams which represents entities as boxes with lines-connections between them. You can create any entity-relationship diagram (ERD) by means of ConceptDraw DIAGRAM using ready-to-use templates and special libraries containing all the needed symbols and shapes. Creating a model for your database from now on can take just a few minutes. ERD (entity relationship diagram) designed to show the logical structure of databases. It intended to depict the relationships between data components (entities). ERDs are a popular tool for software engineers and architects. Using ERD they can manage the every aspect of database design. Also ERD can be used as guidelines for testing and communications before software release. This diagram represents the file reference system of the WordPress web platform. Because entity relationship diagrams have such a broad application area through the prevalence of database technology, it can be applied for a wide range of users.Entity-Relationship Diagram (ERD) <br>with ConceptDraw DIAGRAM  *
Picture: Entity-Relationship Diagram (ERD) with ConceptDraw DIAGRAM
Related Solution:
ConceptDraw DIAGRAM extended with Mathematics solution from the Science and Education area is a powerful diagramming and vector drawing software that offers all needed tools for mathematical diagrams designing. Mathematics solution provides 3 libraries with predesigned vector mathematics symbols and figures: Solid Geometry Library, Plane Geometry Library and Trigonometric Functions Library.Mathematics Symbols *
Picture: Mathematics Symbols
Related Solution:
ConceptDraw DIAGRAM Comparison with Omnigraffle Professional and MS Visio. All source ConceptDraw documents are vector graphic documents. They are available for reviewing, modifying, or converting to a variety of formats: PDF file, MS PowerPoint, MS Visio, and many other graphics formats.ConceptDraw DIAGRAM Presentation
Picture: ConceptDraw DIAGRAM Comparison with Omnigraffle Professional and MS Visio
Related Solution:
ConceptDraw
DIAGRAM 17