
Example 1. Process Flow Diagram Symbols
Chemical and Process Engineering Solution offers large collection of predesigned Chemical and Process Diagrams templates and samples which are available from ConceptDraw STORE.
Numerous ready-to-use process flow diagram symbols are also included in the Chemical and Process Engineering Solution and are grouped in 8 libraries. All they are represented here, you can click to enlarge previews.
Use of these predesigned process flow diagram symbols is a fastest way of professional process and chemical engineering drawing. They will help you draw any chemical or process flow diagram in mere minutes. Simply drag the needed objects from the libraries to the document and arrange them.
Use your chemical and process flow diagrams created in ConceptDraw DIAGRAM in your work, education, scientific, or any other activity. They will always have a success and will help you easily explain your thoughts to the colleagues.

Example 2. Process Flow Diagram — Crude Oil Distillation Unit
This sample was created in ConceptDraw DIAGRAM software using the process flow diagram symbols from the libraries of Chemical and Process Engineering Solution. It shows the detailed Process Flow Diagram of the Crude Oil Distillation Unit. An experienced user spent 20 minutes creating this sample.
Use the Chemical and Process Engineering Solution for ConceptDraw DIAGRAM Solution Park to create your own professional looking Process Flow Diagrams fast, easy and effective.
All source documents are vector graphic documents. They are available for reviewing, modifying, or converting to a variety of formats (PDF file, MS PowerPoint, MS Visio, and many other graphic formats) from the ConceptDraw STORE. The Chemical and Process Engineering Solution is available for all ConceptDraw DIAGRAM or later users.
TEN RELATED HOW TO's:
Use ConceptDraw DIAGRAM software as powerful electrical engineering software and apply switches and relays electrical symbols in ✔️ electrical circuit diagrams, ✔️ electrical drawings, ✔️ electrical schematics, ✔️ wiring diagrams, ✔️ electrical blueprints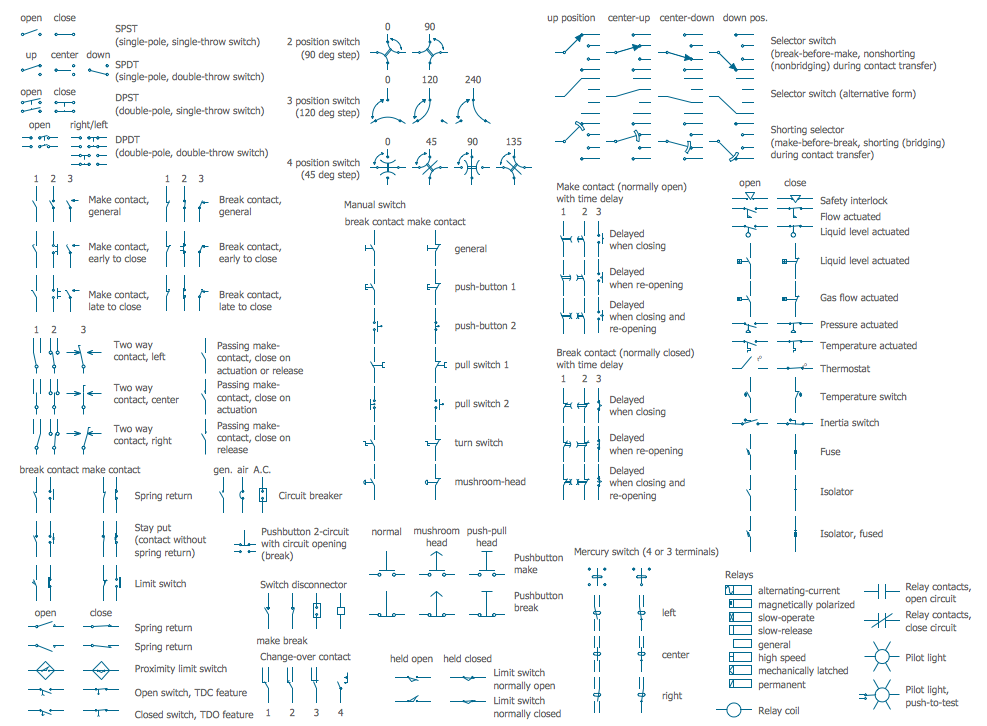
Picture: Electrical Symbols — Switches and Relays
Related Solution:
This sample shows the Flowchart of the testing the work of the lamp and decision making about what to do to lamp will work.
Picture: Samples of Flowchart
Related Solution:
If you need create a Process and Instrumentation Diagram, it is convenient to design it in ConceptDraw DIAGRAM software which offers powerful Chemical and Process Engineering Solution from the Industrial Engineering Area.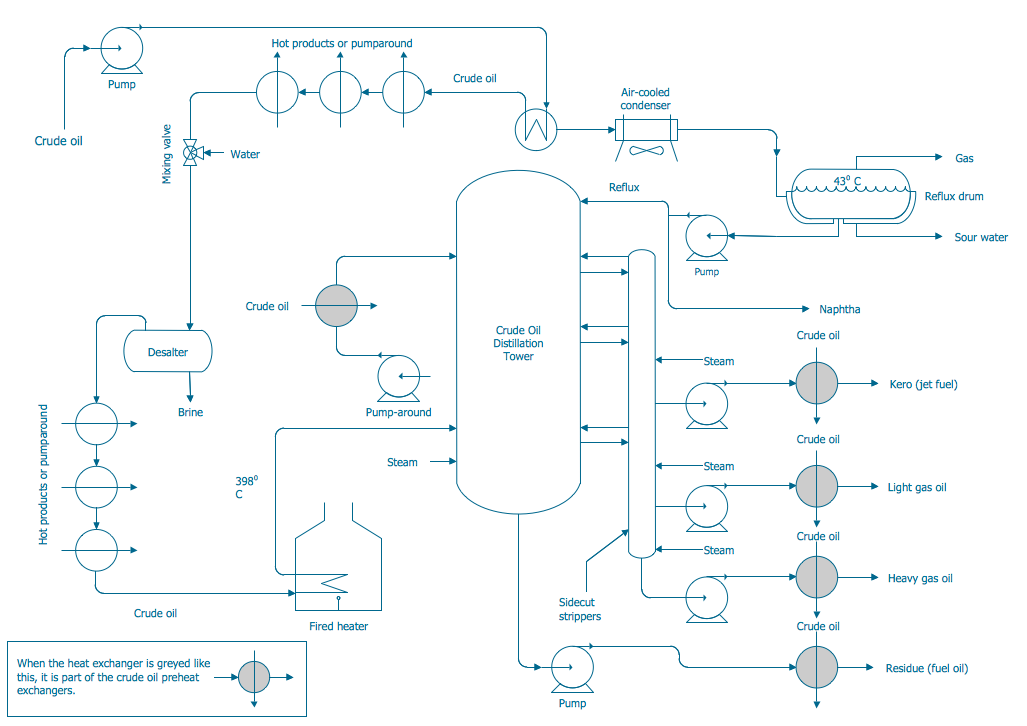
Picture: Process and Instrumentation Diagram
Related Solution:
ConceptDraw DIAGRAM diagramming and vector drawing software extended with Chemical and Process Engineering Solution from the Industrial Engineering Area of ConceptDraw Solution Park offers you the set of useful tools for easy drawing various Process Diagrams.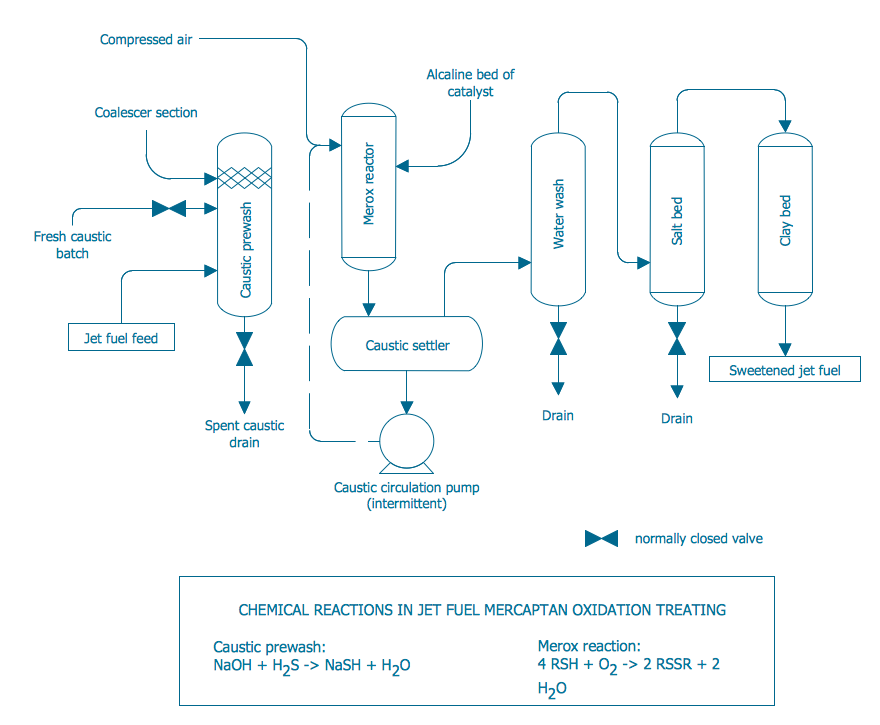
Picture: Process Diagrams
Related Solution:
Start your business process mapping with conceptDraw DIAGRAM and its Arrows10 Technology. Creating a process map, also called a flowchart, is a major component of Six Sigma process management and improvement. Use Cross-Functional Flowchart drawing software for business process mapping (BPM).
Use a variety of drawing tools, smart connectors and shape libraries to create flowcharts of complex processes, procedures and information exchange. Define and document basic work and data flows, financial, production and quality management processes to increase efficiency of you business.
Picture: Cross Functional Flowchart for Business Process Mapping
ConceptDraw DIAGRAM enhanced with Flowcharts Solution is the best flow chart maker online design software. Use it to ✔️ create clear and actionable Flowcharts, ✔️ improve decision-making, ✔️ enhance problem-solving in various scenarios, ✔️ enhance creativity and productivity across industries, ✔️ streamline workflows
Picture: Flow Chart Online
Related Solution:
Event-Driven Process Chain Diagrams for improvement throughout an organisation.
ConceptDraw DIAGRAM - software that reduces the time needed to create a business process model.
Picture: Graphical Symbols to use in EPC diagrams
Related Solution:
Use ConceptDraw DIAGRAM diagramming and business graphics software for drawing your own PM life cycle flow charts.
Picture: Program to Make Flow Chart
Related Solution:
Flow chart is a diagrammatic representation of an algorithm and essential part of planning the system. Flow charts are widely used in technical analysis and programming for easy writing programs and explaining them to others. So, one of the most popular type of flow charts is Technical Flow Chart.
Technical Flow Chart can be drawn by pencil on the paper, but it will be easier to use for designing a special software. ConceptDraw DIAGRAM diagramming and vector drawing software extended with Flowcharts Solution from the Diagrams Area of ConceptDraw Solution Park will be useful for this goal.
Picture: Technical Flow Chart
Related Solution:
Chemical and Process Engineering solution contains variety predesigned process flow diagram elements relating to instrumentation, containers, piping and distribution necessary for chemical engineering, and can be used to map out chemical processes or easy creating various Chemical and Process Flow Diagrams in ConceptDraw DIAGRAM.Picture: Process Flow Diagram Symbols
Related Solution:


