
Example 1. Network Diagram Software
You can use the appropriate stencils from the Computer Network Diagrams libraries of symbols for network components and points, diagrams for LAN and WAN, schematics and wiring drawings:
- Computer Network
- Computer Peripheral Devices
- Computers and Network Isometric
- External Digital Devices
- Internet Symbols
- Logical Network Diagram
- Cable Network
- LAN Network Diagrams
- Logical Symbols
- Network Hardware
- LAN Physical Office Network Diagrams

Example 2. Design Symbols — Computers and Network Isometric
Computer Network Diagrams solution provides also collection of samples and templates. They are the good examples and can be used as the base for your own LAN Diagrams.
The sample below was created in ConceptDraw DIAGRAM diagramming and vector drawing software enhanced with Computer Network Diagrams Solution and shows the LAN Network Diagram.

Example 3. Simple LAN diagram
Use ConceptDraw DIAGRAM program with Computer Network Diagrams solution as effective tools to create your own professional looking LAN diagrams and LAN network diagram quickly and easily. It helps clearly represent and communicate network architecture, physical office network diagrams, topology, and design to IT and telecom engineers, stakeholders and end-users.

Example 4. LAN Diagrams solution
All source documents are vector graphic documents. They are available for reviewing, modifying, or converting to a variety of formats (PDF file, MS PowerPoint, MS Visio, and many other graphic formats) from the ConceptDraw STORE. The Computer Network Diagrams Solution is available for all ConceptDraw DIAGRAM or later users.
TEN RELATED HOW TO's:
Near field communication (NFC) is a wireless communication technology that allows smartphones and other similar devices to establish the radio communication with each other on the short distance around 10 centimeters (4 inches).
This example was created in ConceptDraw DIAGRAM using the Computer and Networks Area of ConceptDraw Solution Park and shows the Near field communication (NFC) network.
Picture: Near field communication (NFC). Computer and Network Examples
Related Solution:
Wireless Networks solution from ConceptDraw Solution Park extends ConceptDraw DIAGRAM to help network engineers and designers efficiently illustrate wireless network mode diagrams.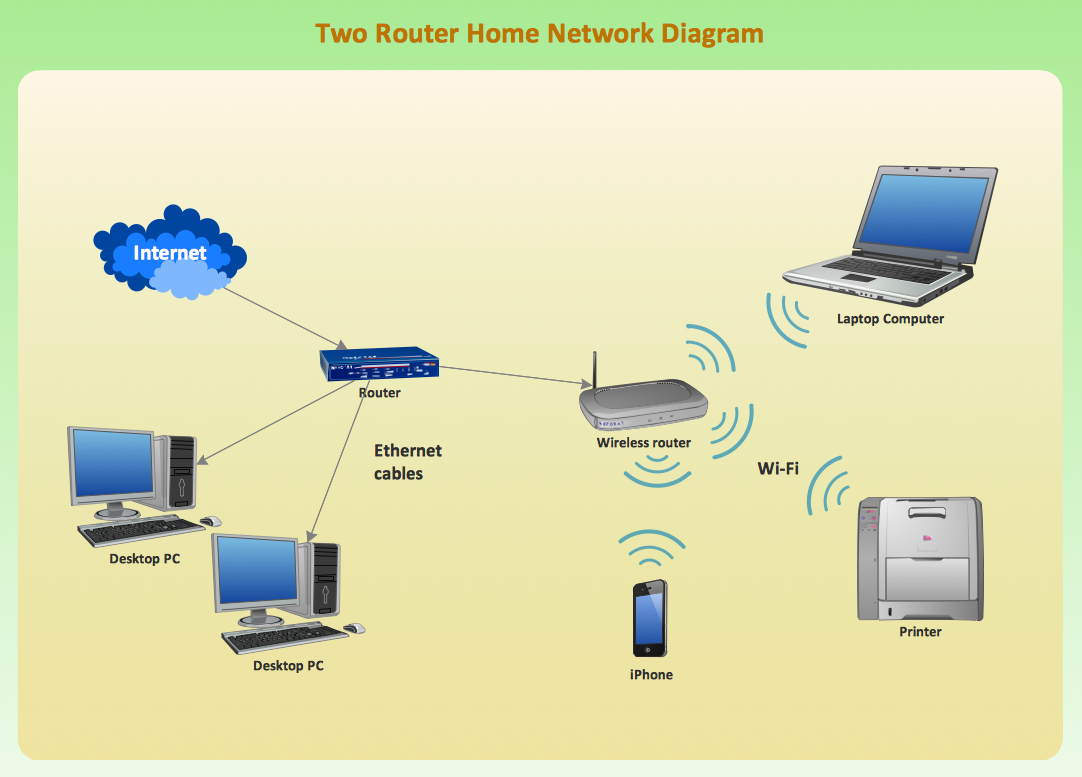
Picture: Wireless Network Mode
Related Solution:
There are plenty of diagramming tools, the question is to choose the most suitable for your needs. For example, you can choose ConceptDraw DIAGRAM as organizational chart software and get fascinating results in a few minutes. An orgchart is useful for any corporation.
This is an example of a hierarchical organization scheme of the company. It has tree-like structure. Each middle manager is subordinated to a few employees, and he is accountable to one of the top managers. Every type of organizational composition of businesses may be presented in the view of an organizational chart that is supported by ConceptDraw Organisational Charts solution. There are number of ways of building a structure of business organization, establishing how it should function.
Picture: ConceptDraw DIAGRAM - Organizational chart software
Related Solution:
The Rapid UML solution from Software Development area of ConceptDraw Solution Park includes 13 vector stencils libraries for drawing the UML 2.4 diagrams using ConceptDraw DIAGRAM diagramming and vector drawing software.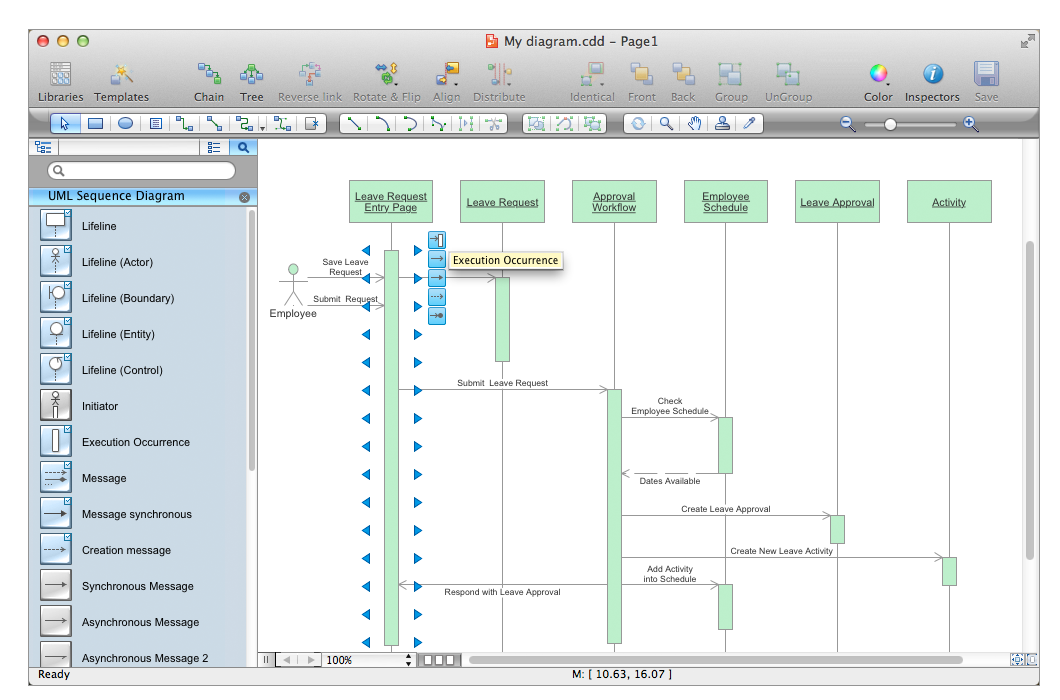
Picture: Design Elements for UML Diagrams
Related Solution:
Event-Driven Process chain Diagrams for improvement throughout an organisation.
ConceptDraw DIAGRAM - software that reduces the time needed to create a business process model.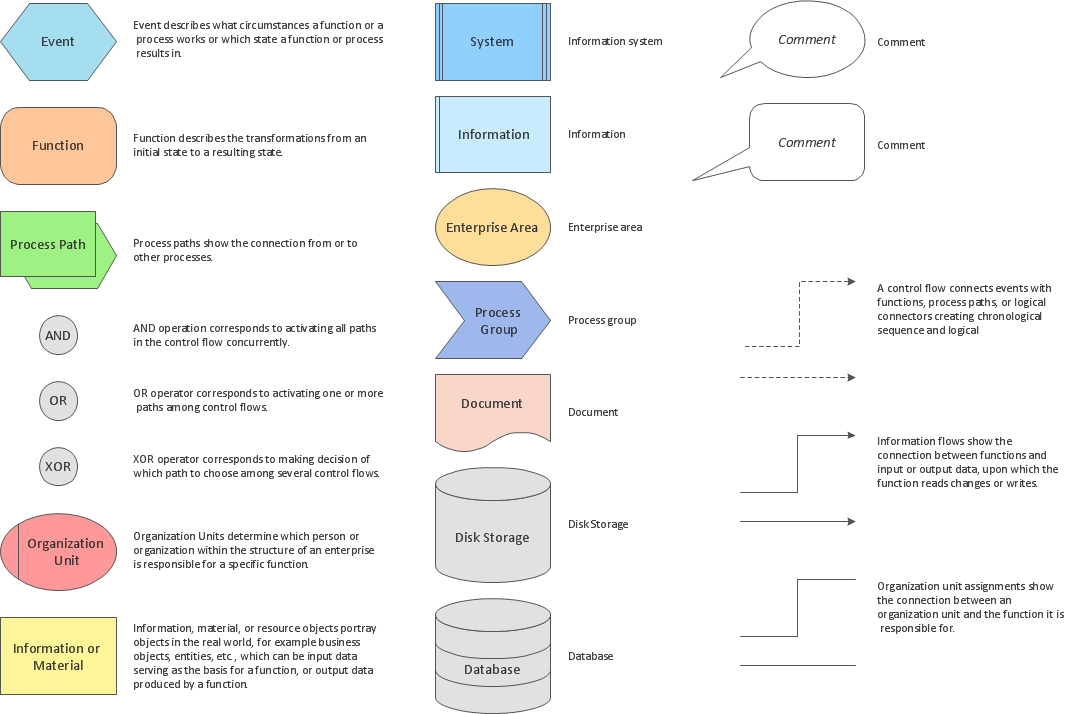
Picture: Software for Drawing EPC Diagrams
Related Solution:
Try ConceptDraw program, the perfect drawing tool for creating all kinds of great-looking drawings, charts, graphs, and illustrations.
Picture: Basic Diagramming
Related Solution:
This sample shows the Flowchart of the testing the work of the lamp and decision making about what to do to lamp will work.
Picture: Samples of Flowchart
Related Solution:
Of course it is possible to keep network records in text documents, but it is very difficult to use them later. A more sound way to keep such documentation is to create a network diagram that might represent either logical network structure or physical. These diagrams are easy to understand and you will thank yourself later.
There is a physical network diagram. It is a tool to represent, maintain and analysis of network equipment and interconnections. Network diagram depicts the actual network information in the attractive clear graphic form. One can learn here the LAN cable length, telecommunication type and carrying capacity. The diagram depicts servers, IP address and domain name as well. Also it shows location of hubs, switches, modems, routers, and other network equipment. The sets of special symbols and images delivered with ConceptDraw Network Diagrams solution are used to show network components. Symbols have a standard view. Therefore, various specialists can read the network diagram without any discrepancies.
Picture: Network diagrams with ConceptDraw DIAGRAM
Related Solution:
In the case of origin of an emergency is very important to have a correct, clear and comprehensible action plan which will help you to react quicker and to make right decisions. ConceptDraw DIAGRAM software extended with Fire and Emergency Plans solution from the Building Plans Area of ConceptDraw Solution Park provides extensive drawing tools for quick and easy creating fire and emergency plans, and also a set of various templates and samples, among them the Emergency Action Plan Template.
Picture: Emergency Action Plan Template
Related Solution:
Electrical Engineering Solution used together with ConceptDraw DIAGRAM drawing facilities makes short a work of drawing various electrical and electronic circuit schemes. A library of vector objects composed from symbols of Analog and Digital Logic elements of electric circuit includes 40 symbolic images of logic gates, bistable switches of bi-stable electric current, circuit controllers, amplifiers, regulators, generators, etc. All of them can be applied in electronic circuit schemes for showing both analog and digital elements of the circuit.
Electrical Engineering Solution used together with ConceptDraw DIAGRAM drawing facilities makes short a work of drawing various electrical and electronic circuit schemes. A library of vector objects composed from symbols of Analog and Digital Logic elements of electric circuit includes 40 symbolic images of logic gates, bistable switches of bi-stable electric current, circuit controllers, amplifiers, regulators, generators, etc. All of them can be applied in electronic circuit schemes for showing both analog and digital elements of the circuit.
Picture:
Electrical Diagram Symbols F.A.Q.
How to Use Electrical ConceptDraw Diagram Software
Related Solution:


