
Example 1. Target Diagram - Marketing Mix Wheel
Target and Circular Diagrams Solution offers a Target Diagrams library with 13 vector objects for drawing Target Diagrams of various designs. Simply drag any of them and add the text.

Example 2. Target Diagrams Library Design Elements
Each of these objects can be used as is or changed - you can add/remove elements and tiers, change color style and resize without loss a quality.

Example 3. Target Diagram - Foreign Trade
Target and Circular Diagrams Solution provides also variety of Target Diagram examples and samples. They are available for viewing and editing from ConceptDraw STORE.

Example 4. Target Diagram - Marketing Plan
The Target Diagram samples you see on this page were created in ConceptDraw DIAGRAM software using the Target and Circular Diagrams Solution. An experienced user spent 5 minutes creating every of them. These samples were included in Target and Circular Diagrams Solution, you can find them in ConceptDraw STORE.
Use the Target and Circular Diagrams Solution for ConceptDraw DIAGRAM software to create your own professional looking Target Diagram of any complexity quick, easy and effective.

Example 5. Target Diagram Solution
All source documents are vector graphic documents. They are available for reviewing, modifying, or converting to a variety of formats (PDF file, MS PowerPoint, MS Visio, and many other graphic formats) from the ConceptDraw STORE. The Target and Circular Diagrams Solution is available for all ConceptDraw DIAGRAM or later users.
TEN RELATED HOW TO's:
ConceptDraw DIAGRAM is a powerful software that helps you create professional looking cross-functional flowcharts with the well-designed objects. ConceptDraw DIAGRAM allows you to focus on work, not the drawing process. ConceptDraw Arrows10 Technology allows to draw connectors with smart behavior that gives flexibility to you during work process.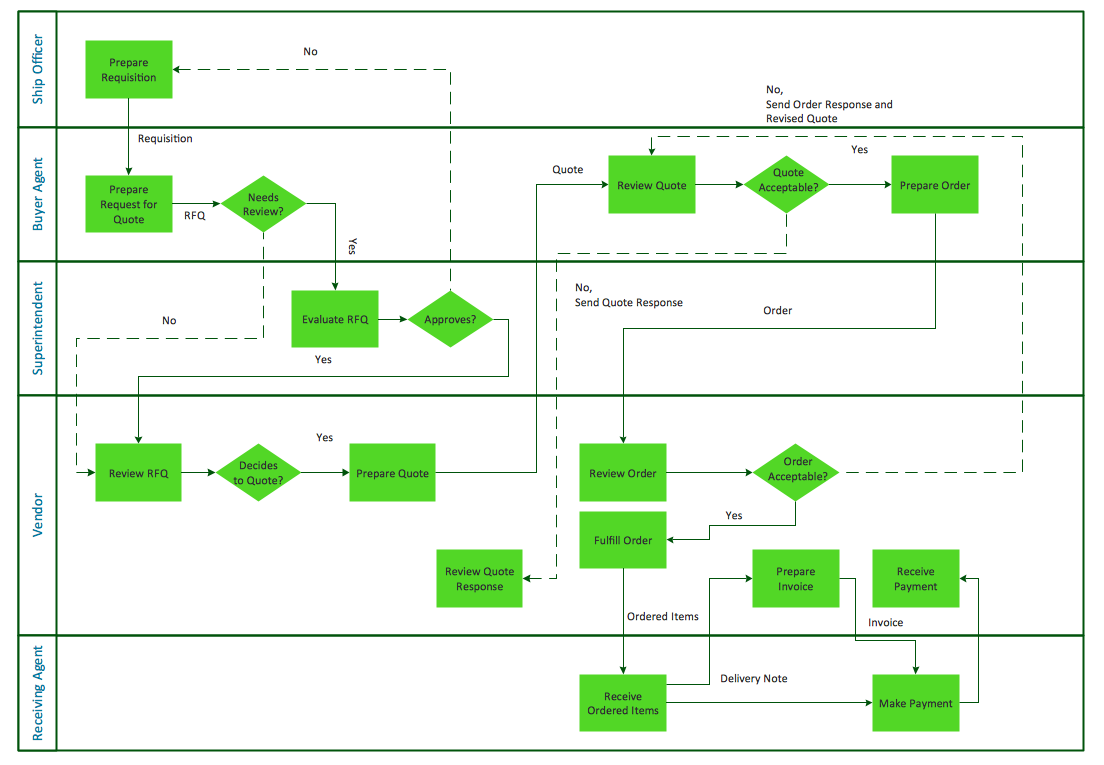
Picture: Horizontal Cross Functional Flowchart
Related Solution:
Connecting objects manually in ConceptDraw DIAGRAM is a snap:
- points;
- Connecting groups of objects;
- Auto-routing;
- Connectors text;
- Snap to Guides ;
- Quick.
Picture: ConceptDraw Arrows10 Technology
You need to draw the Circular Arrows Diagram, Segmented Diagram or Circular Flow Diagram? Any of these diagrams can be fast and easy designed in ConceptDraw DIAGRAM software, which offers the Business Diagrams Solution from the Management Area with extensive drawing tools, predesigned samples and circular flow diagram template. The use of ready template is the easiest way of drawing.
Picture: Circular Flow Diagram Template
Related Solution:
Maps surround us everywhere in our life, study, work, traveling, they are widely used in geography, history, politics, economics, and many other fields of science and life activity. But designing of maps is usually complex and labor-intensive process. Now we have the possibility to make easier this process - ConceptDraw DIAGRAM diagramming and vector drawing software extended with Australia Map Solution from the Maps Area of ConceptDraw Solution Park will help us in easy drawing detailed Australia map.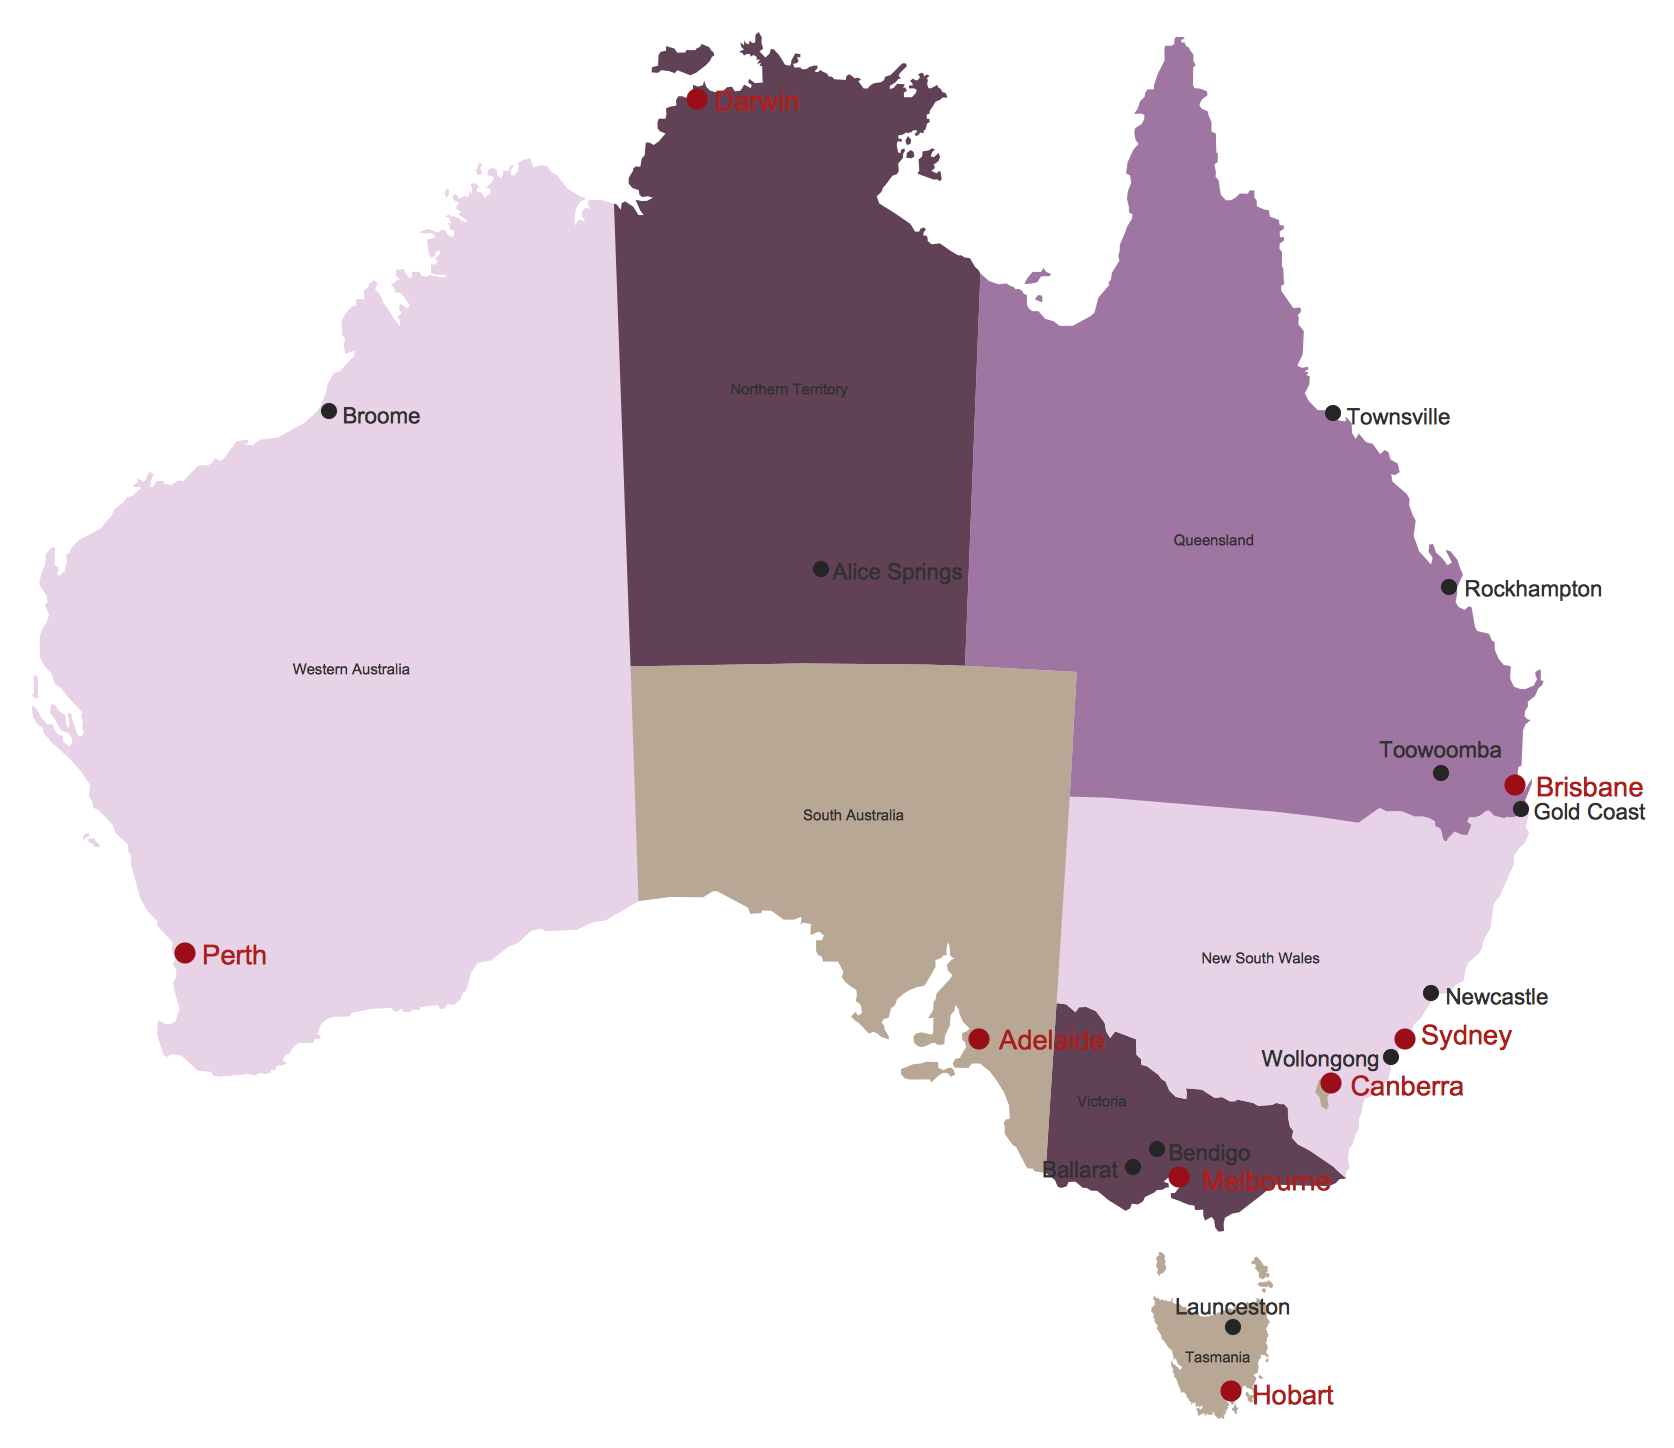
Picture: Australia Map
Related Solution:
This sample shows the Flowchart that displays the process of the achievement the consensus, in other words solving for the acceptable solution.
This Flowchart has start point. The rectangles on it represent the steps of the process and are connected with arrows that show the sequence of the actions. The diamonds with yes/no shows the decisions. The Flowcharts are widely used in marketing, business, analytics, government, politics, engineering, architecture, science, manufacturing, administration, etc.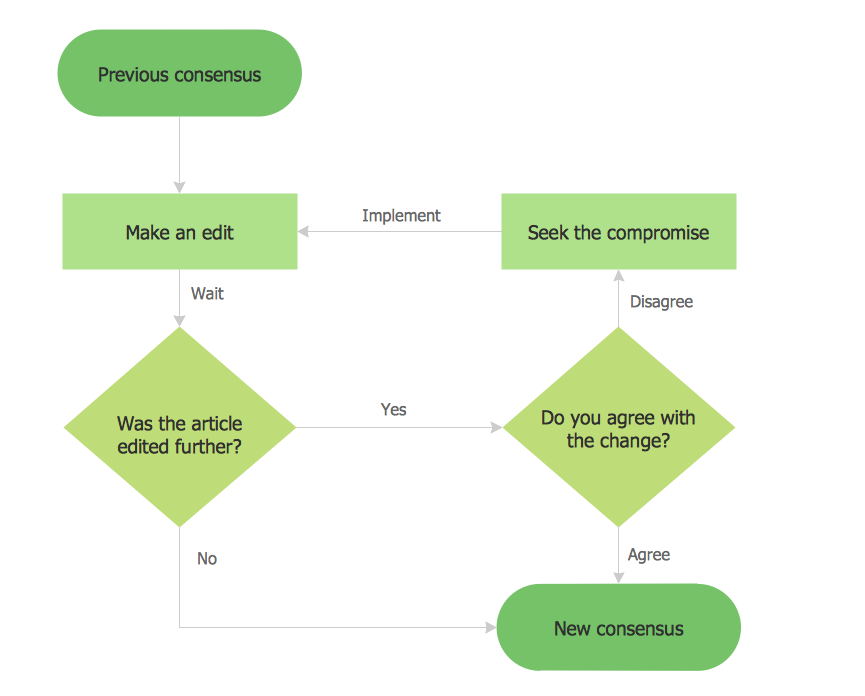
Picture: Example Basic Flowchart. Flowchart Examples
Related Solution:
The Circle Diagrams are the diagrams which represent the central element surrounded by other items in a circle. This type of diagram is very popular and widely used in marketing and management, for process modeling, market, resource, time and cost analysis, for visualization causes and effects. If you dream to design the Circle Diagrams quick and easy – the ConceptDraw DIAGRAM software extended with Business Diagrams Solution from the Management Area is exactly what you need.
Picture: Circle Diagrams
Related Solution:
Interactive tool helps you find the appropriate response to social media mentions quickly.
Picture: How to Use the ″Online Store PR Campaign″ Sample
Related Solution:
Venn diagrams are illustrations used in the branch of mathematics known as set theory.
Use ConceptDraw DIAGRAM to quick and easy design your own Venn Diagram of any complexity.
Picture: Venn Diagram
Related Solution:
SWOT analysis is an effective method of business planning, the question is how to do it. The most obvious way is to make a SWOT analysis in a Word document, which is not very convenient. Luckily, you can use software like ConceptDraw DIAGRAM that has features and templates made especially for SWOT analyzing.
A SWOT Analysis is a manager's means of the strategic planning. It is used to define and classify considerable internal moments (strengths and weaknesses) and external forces (opportunities and threats) a business faces. You can use ConceptDraw MINDMAP to determine and organize factors utilized for SWOT analysis, and represent them in the SWOT matrix using ConceptDraw DIAGRAM. Using mind maps empowers you to explore and rank a lot of data engaged for SWOT analysis as well as recognize the relations between various pieces of information.
Picture: How to Make SWOT Analysis in a Word Document
Related Solution:
In software engineering, it is important to understand how the system would cooperate with external sources, like data sources. To give this information a visual representation, data flow diagrams (DFD) were used for years. The entire system is usually divided into smaller ones, and all of them process data flows in appropriate ways.
The visualizing business processes which engages the data transfer, is commonly preformed using DFDs (data flow diagrams). DFD is used to show the data flow processing and transformation. This DFD represents the electronic system of a customer purchase. It was created using Gane/Sarson notation. Data flow diagrams helps you to sort through and clarify transferring process making it available for analysis, and representation. ConceptDraw DFD solution introduces the vector library, containing the full set of icons from DFD notations.
Picture: Data Flow Diagram (DFD)
Related Solution:


