Business and Finance Illustrations Example
|
These examples of business and finance illustrations, diagrams and infographics are contained in the Business and Finance solution from Illustration area of ConceptDraw Solution Park. You can easy customize these examples to illustrate your own business and finance documents, presentations and websites using ConceptDraw DIAGRAM diragramming and vector drawing software.
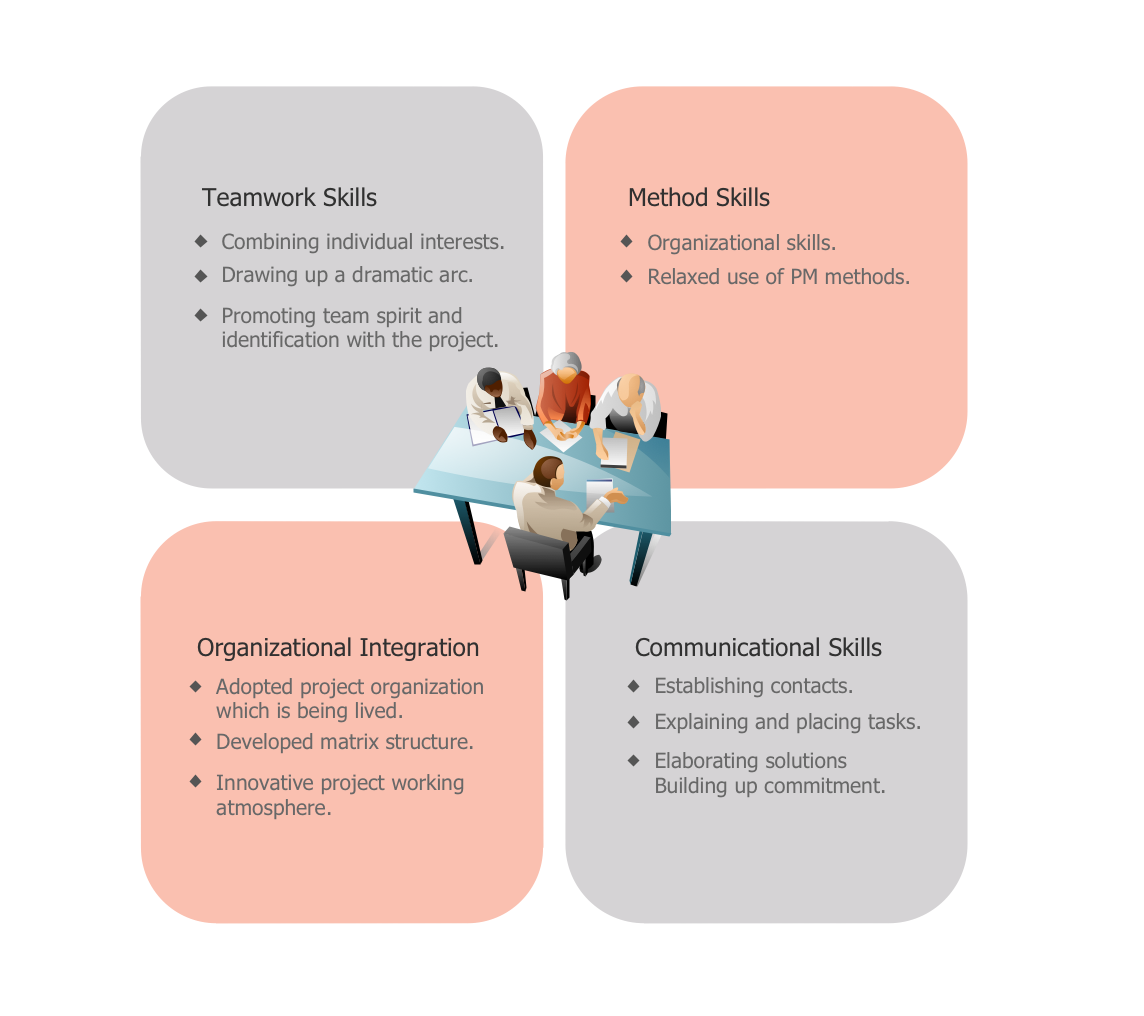 Example 3. Project Management Example 3. Project Management
|
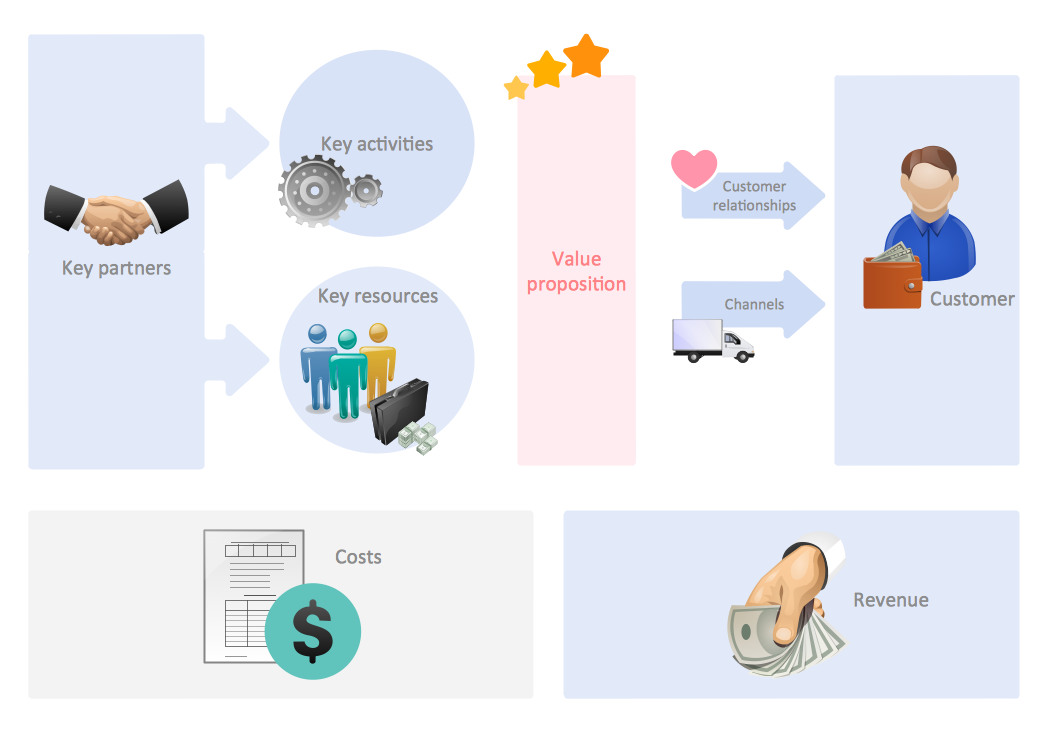

Example 6. Ways of Making Money
TEN RELATED HOW TO's:
UML Sequence Diagram can be created using ConceptDraw DIAGRAM diagramming software contains rich examples and template. ConceptDraw is perfect for software designers and software developers who need to draw UML Sequence Diagrams.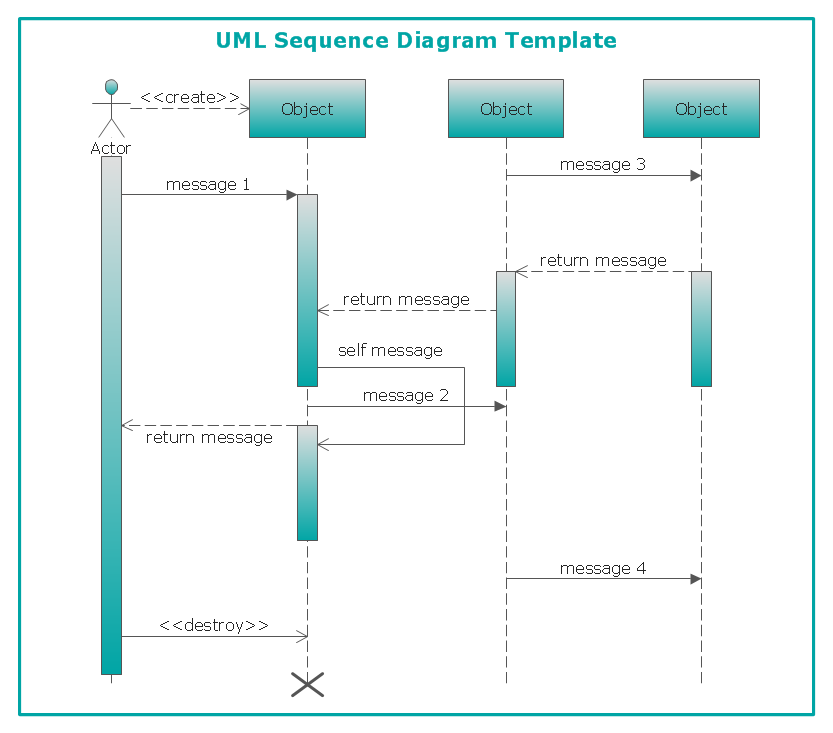
Picture: UML Sequence Diagram
Working with information can be quite tedious, furthermore, some data can be quite difficult to perceive without any graphic representation. So, to facilitate your work, you can use business diagrams, such as simple flowcharts or Gantt charts for project management and orgcharts for clarifying your company structure. You can use a proper software, like ConceptDraw Pro, draw them on paper, or use whiteboards, but it is more convenient to use a digital tool.
This diagram shows a cross-functional flowchart that was made fore telecom service provider. A workflow of a common telecommunication service provider has a rather branched structure. Thus, it is useful to have a flow chart to visualize the sequences and interrelations of the work flow steps. Business process flowchart contains 17 processes and 4 decision points,that are distributed through 2 lines depicting the participants involved. Also there are connectors that show the data flow within processes. This flowchart displays a detailed model of the telecom service trading process, as well as all participants in the process and how they interact with each other.
Picture: Business diagrams & Org Charts with ConceptDraw DIAGRAM
ConceptDraw DIAGRAM is a powerful tool for business and technical diagramming.
Software Development area of ConceptDraw Solution Park provides 5 solutions:
Data Flow Diagrams, Entity-Relationship Diagram (ERD), Graphic User Interface, IDEFO Diagrams, Rapid UML.
Picture: Software Diagram Examples and Templates
Related Solution:
Sometimes, when it is difficult to create a functional space plan or to rearrange existing one, the art of interior design comes in. It doesn't matter, if you need a cozy bedroom or an office layout plan, you should use appropriate tools to make your design great.
While making a floor plan of a new office it could be useful to apply some design elements such as furniture and office equipment. This diagram presents an office furniture objects that can be used for office interior design planning, or making office furniture and equipment layouts. This vector stencils library is supplied with ConceptDraw Office Layout Plans solution. It contains more then 30 vector objects of office interior for making office floor plans including an office space layout plans and furniture arrangement.
Picture: Interior Design. Office Layout Plan Design Element
Related Solution:
ConceptDraw DIAGRAM is the best software for illustration the network topologies. It's very easy and quickly to design the network topology diagrams of any kinds and complexity in ConceptDraw DIAGRAM diagramming and vector drawing software using the Computer and Networks solution from Computer and Networks area of ConceptDraw Solution Park.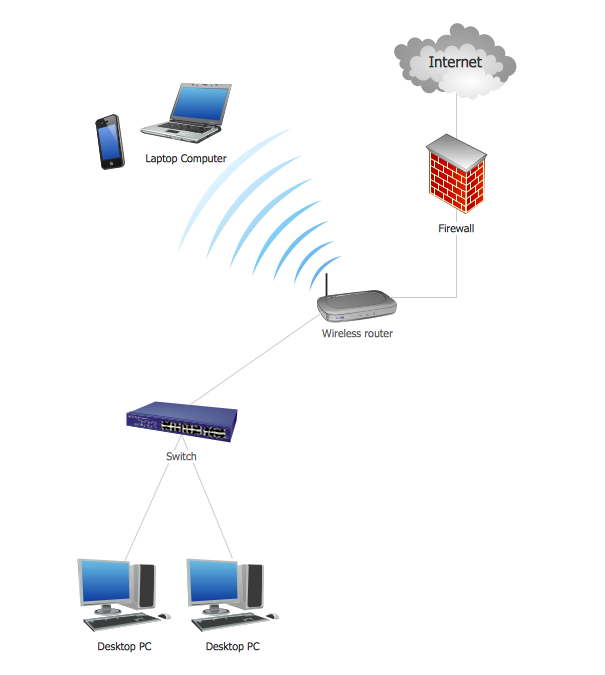
Picture: Network Topology Illustration
Related Solution:
A Home Area Networks (HAN) is a type of local area network that is used in an individual home. The home computers can be connected together by twisted pair or by a wireless network. HAN facilitates the communication and interoperability among digital devices at the home, allows to easier access to the entertainments and increase the productivity, organize the home security.
This example was created in ConceptDraw DIAGRAM using the Computer and Networks Area of ConceptDraw Solution Park and shows the home network diagram.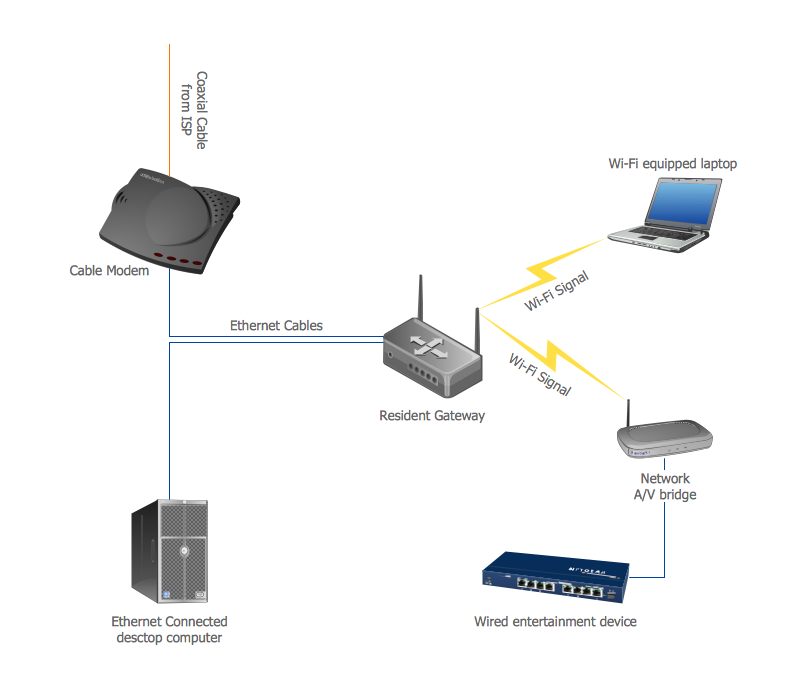
Picture: Home area networks (HAN). Computer and Network Examples
Related Solution:
There are many ways to define the flow of information within a system. Structured-systems analysis method often uses data flow diagrams to show data flow, data storages and data processing visualization. These diagrams are easy to develop and quite useful.
Here is a dataflow diagram presenting an example of the manufacturing process flow. The oval process shapes represent a process that controls data within the current system. The process may produce data or make some action based on data. Data flows are represented by lines. They show the movement of information through the system. The direction of the data flow is depicted by the arrow. The external entities are shown by rectangles. They represent the external entities interacting with the system. The data store objects (unclosed rectangles) are used to show data bases participating in a process flow.
Picture: Data Flow Diagram
Related Solution:
Building plans are usually very complicated and a hard work to do. It would be nice to use a proper drawing software to facilitate the task. Design a site plan quick and easily with all the stencils and samples from ConceptDraw libraries.
This drawing shows content of the ConceptDraw vector libraries related to the site planning and arrangement of the living environment. ConceptDraw delivers about 50 libraries containing near one and a half thousands vector objects that will help you to design territory arrangement plans and make the Site plan sketches. You can use the Parking and Roads library for designing a parking space, or drawing transport management schemes. The Site Accessories library provides a number of objects, that allow you to depict various equipment of vehicle access control, street lamps, benches, trash cans and other items of the street environment.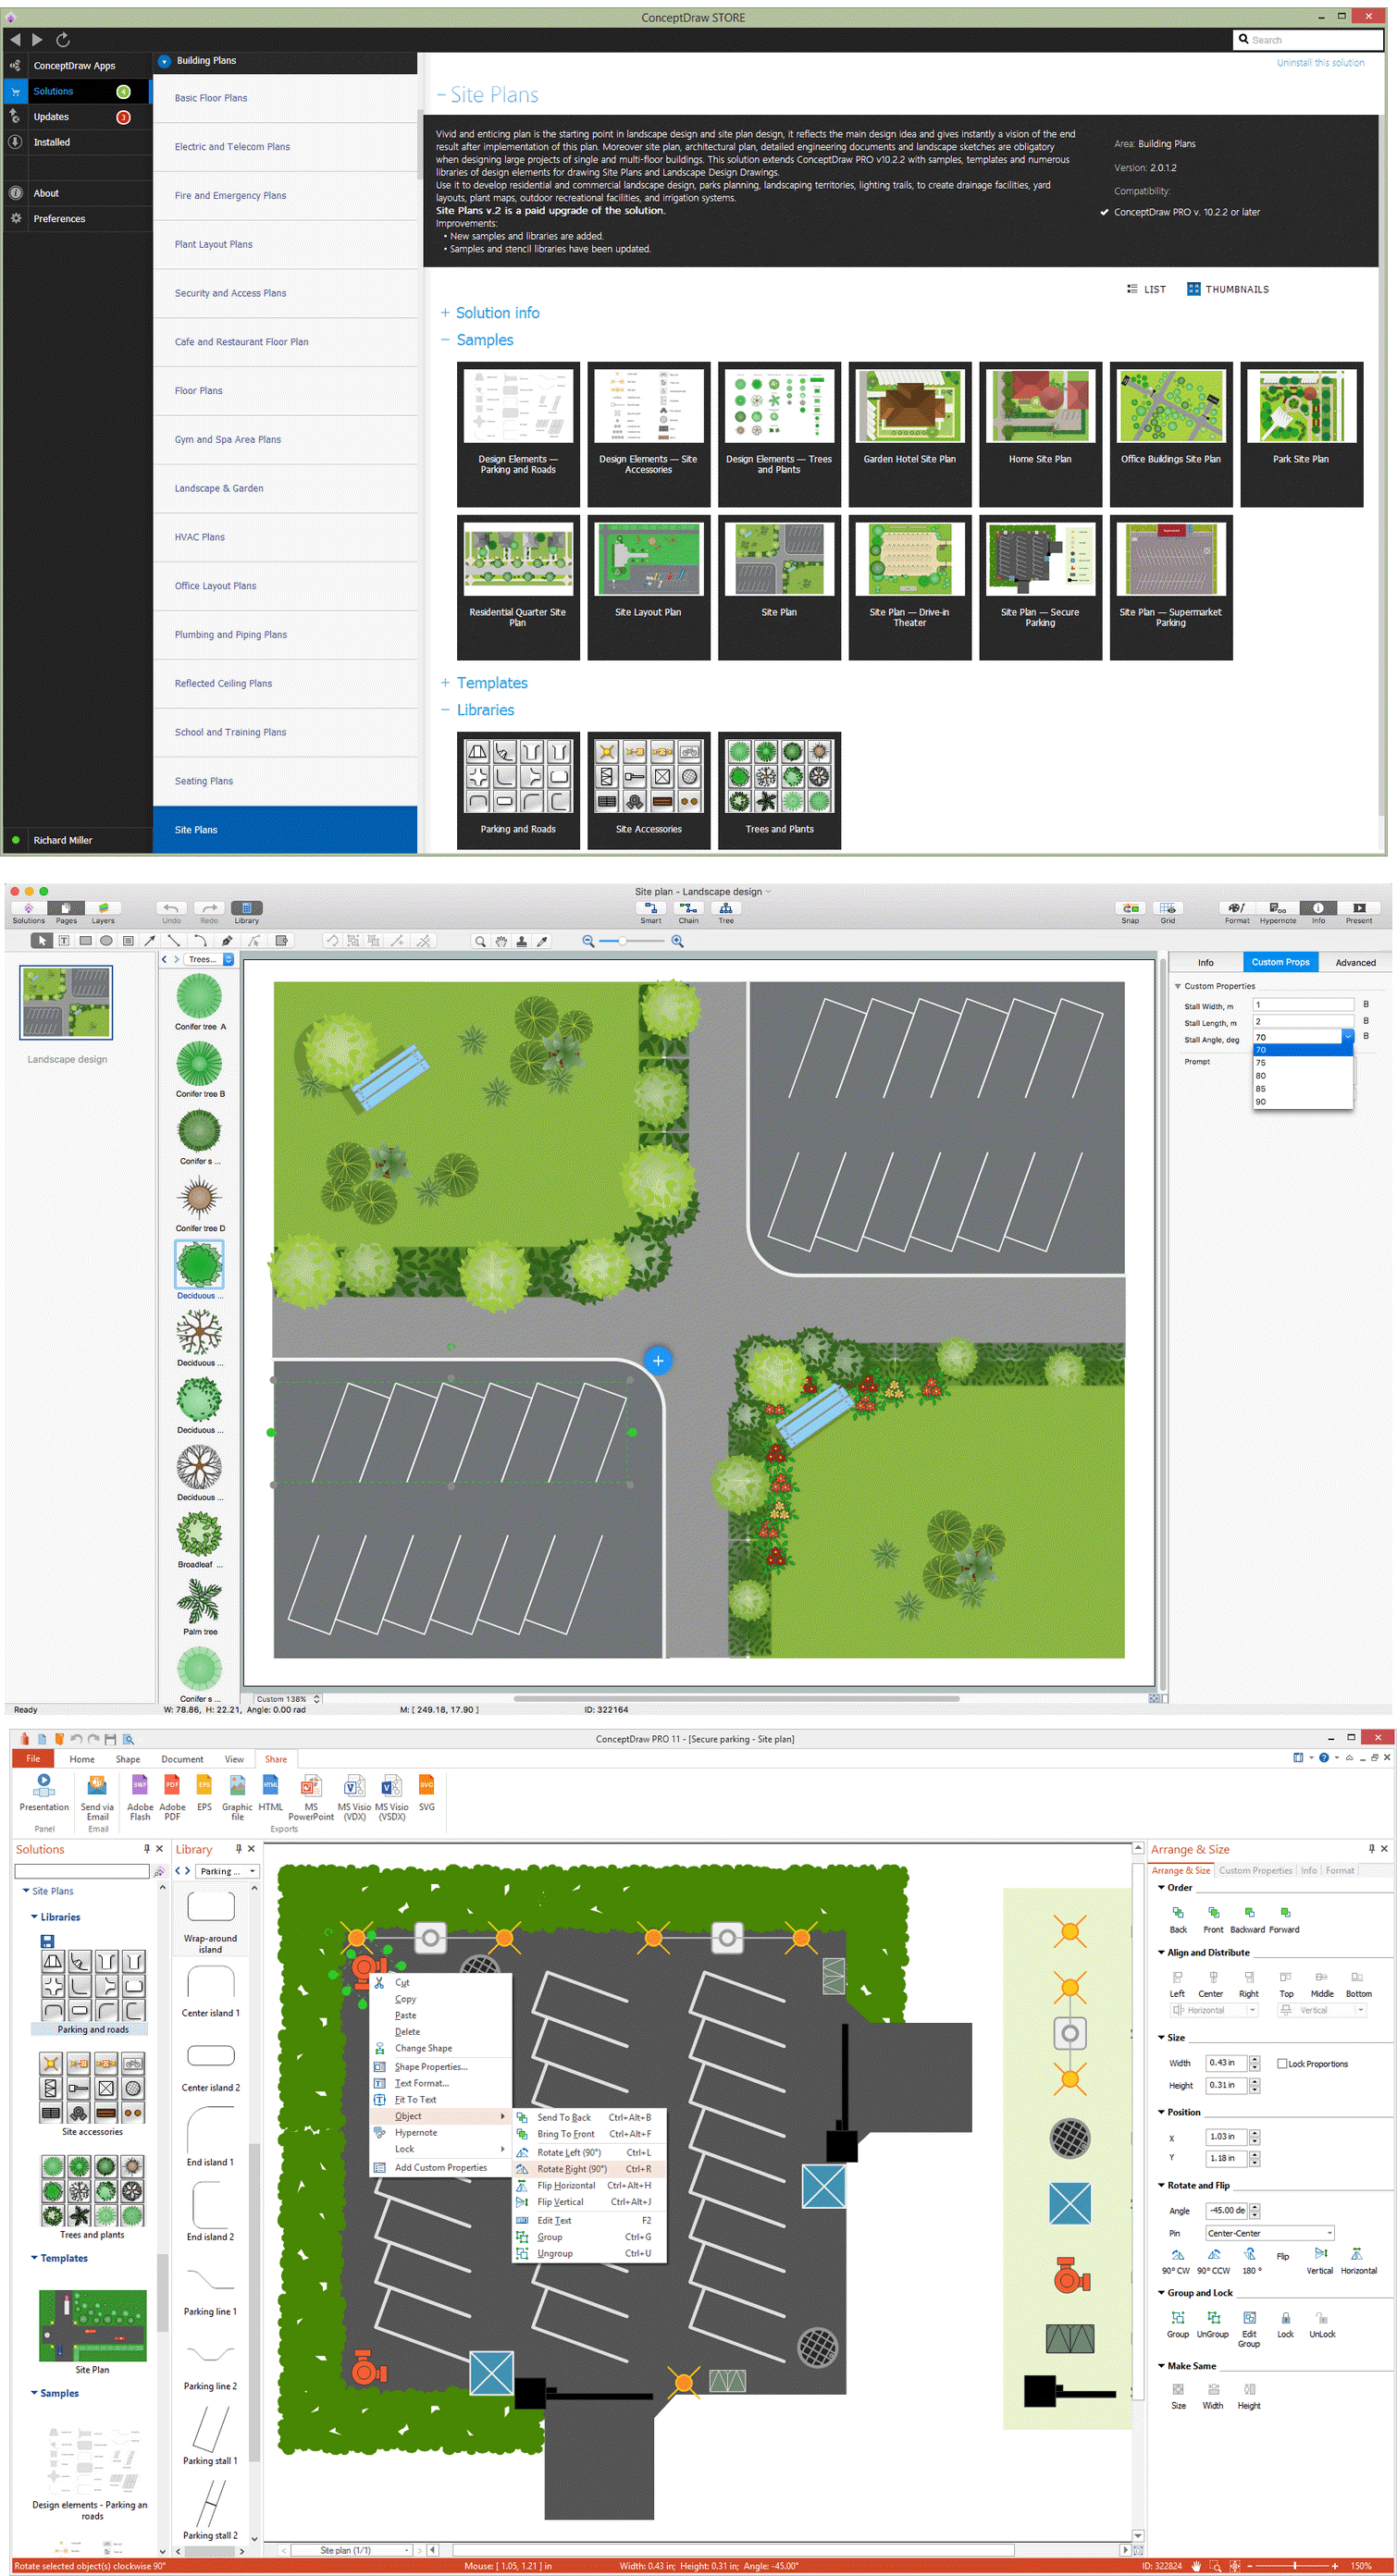
Picture: Building Drawing Software for Design Site Plan
Related Solution:
A model of a system is defined as a set of hierarchical diagrams representing the asynchronous process of data transformation from the moment it is input to the system to the moment it is output to the user. To demonstrate how a process transforms the initial data, you should design a data flow diagram using a DFD Library included in ConceptDraw DIAGRAM Solution Park. Start your diagramming experience now!
You can use this library of symbols related to data flow diagrams (DFD) to design data-oriented or process-oriented models along with data process diagrams. This vector objects library It is a part of ConceptDraw solution designed for data flow diagramming, along with corresponding samples and templates. A data flow diagram is a 2D flowchart that depicts the sequence of particular activities and operations operations and activities which is accompanied by the dynamic flow of some data.
Picture: Design Data Flow. DFD Library
Related Solution:
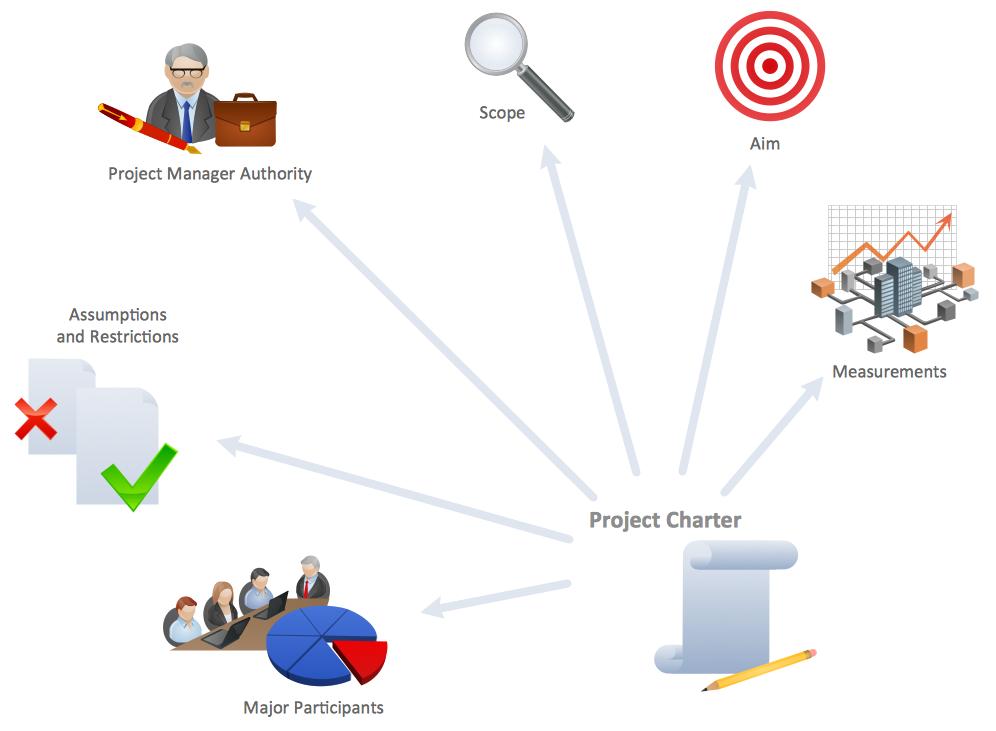
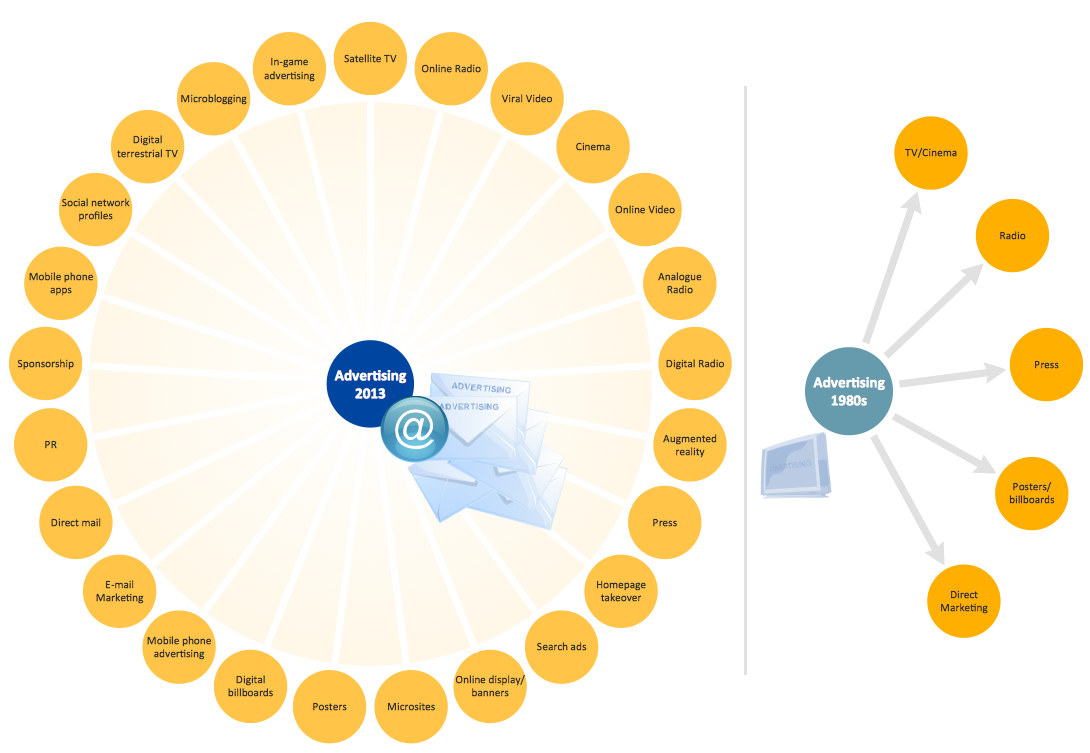
What Is a Circle Spoke Diagram? It is a diagram which has a central item surrounded by other items in a circle. The Circle Spoke Diagrams are often used to show the features or components of the central item in marketing and management documents and presentations. ConceptDraw DIAGRAM extended with Business Diagrams Solution from the Management Area is the best software for creating Circle-Spoke Diagrams.
Picture: What Is a Circle Spoke Diagram
Related Solution:
ConceptDraw
DIAGRAM 18