Flow Chart Symbols
Flow chart
Flowcharts are used in designing and documenting simple processes or programs. Like other types of diagrams, they help visualize what is going on and thereby help understand a process, and perhaps also find flaws, bottlenecks, and other less-obvious features within it. There are many different types of flowcharts, and each type has its own repertoire of boxes and notational conventions.
A flowchart is described as "cross-functional" when the page is divided into different swimlanes describing the control of different organizational units. A symbol appearing in a particular "lane" is within the control of that organizational unit. This technique allows the author to locate the responsibility for performing an action or making a decision correctly, showing the responsibility of each organizational unit for different parts of a single process.
Common alternative names include:
- flowchart,
- process flowchart,
- functional flowchart,
- process map,
- process chart,
- functional process chart,
- business process model,
- process model,
- process flow diagram,
- work flow diagram,
- business flow diagram.
The terms "flowchart" and "flow chart" are used interchangeably.
Flowcharting software
ConceptDraw DIAGRAM is a professional flowchart software. Over 20 flow chart symbols and stencils in libraries allow you to make great-looking flowcharts. Use RapiDraw technology clicking on direction arrows to add a new object to the flowchart. This way you make awesome flowchart at the moment.
Pic. 1. Flowcharting Software Including Flow Chart Symbols

Pic. 2. Flow Chart Symbols
ConceptDraw DIAGRAM is Flowcharts creating software also known as professional flowchart maker. The built-in examples allow users to start drawing any type of flowchart simply. The vector flow chart symbols from object libraries are designed objects you can use adding to flowcharts for the best result.
Common Flow chart Symbols:
| Symbol |
Shape Name |
Symbol Description |
| Common Symbols |
 |
Terminator |
Shows start of a flowchart or its end. |
 |
Process |
Show a Process or action step. Indicates any processing function. |
 |
Flow Line (Arrow, Connector) |
Flow line connectors show the direction that the process flows |
 |
Decision |
Indicates a decision point between two or more paths in a flowchart. |
 |
Document |
This shape shows a Document in a flowchart. |
 |
Connector |
Indicates an inspection point. |
 |
Data |
Can represents any type of data in a flowchart. |
 |
Delay |
Indicates a delay in the process. |
 |
Preparation |
Indicates a modification to a process, such as setting a switch or initializing a routine. |
 |
Subroutine |
Indicates a predefined (named) process, such as a subroutine or a module. |
 |
Off-page connector |
Use this shape to create
a cross-reference and hyperlink from a process on one page to a process on another page. |
ConceptDraw DIAGRAM diagramming and vector graphics software provides stencils library with flow chart symbols, samples and templates for drawing flow charts.

Pic. 3. Flow Chart Examples
TEN RELATED HOW TO's:
Do you need to draw a check order process flowchart?
Use the intuitive product - ConceptDraw.
Picture: Check Order Process Flowchart. Flowchart Examples
Related Solution:
ConceptDraw DIAGRAM diagramming and vector drawing software extended with Flowcharts Solution from the 'Diagrams' area of ConceptDraw Solution Park is a powerful tool for drawing Flow Charts of any complexity you need. Irrespective of whether you want to draw a Simple Flow Chart or large complex Flow Diagram, you estimate to do it without efforts thanks to the extensive drawing tools of Flowcharts solution, there are professional flowchart symbols and basic flowchart symbols. This sample shows the Gravitational Search Algorithm (GSA) that is the optimization algorithm.
Picture: Simple Flow Chart
Related Solution:
In ConceptDraw DIAGRAM it really is sp simple to draw even the most complex cross-functional flowcharts. Use the RapidDraw technology and Cross-Functional libraries in ConceptDraw DIAGRAM for the best results.
Picture: How to Simplify Flow Charting — Cross-functional Flowchart
Related Solution:
The library with 40 vector stencils is included in the ConceptDraw Value Stream Mapping solution.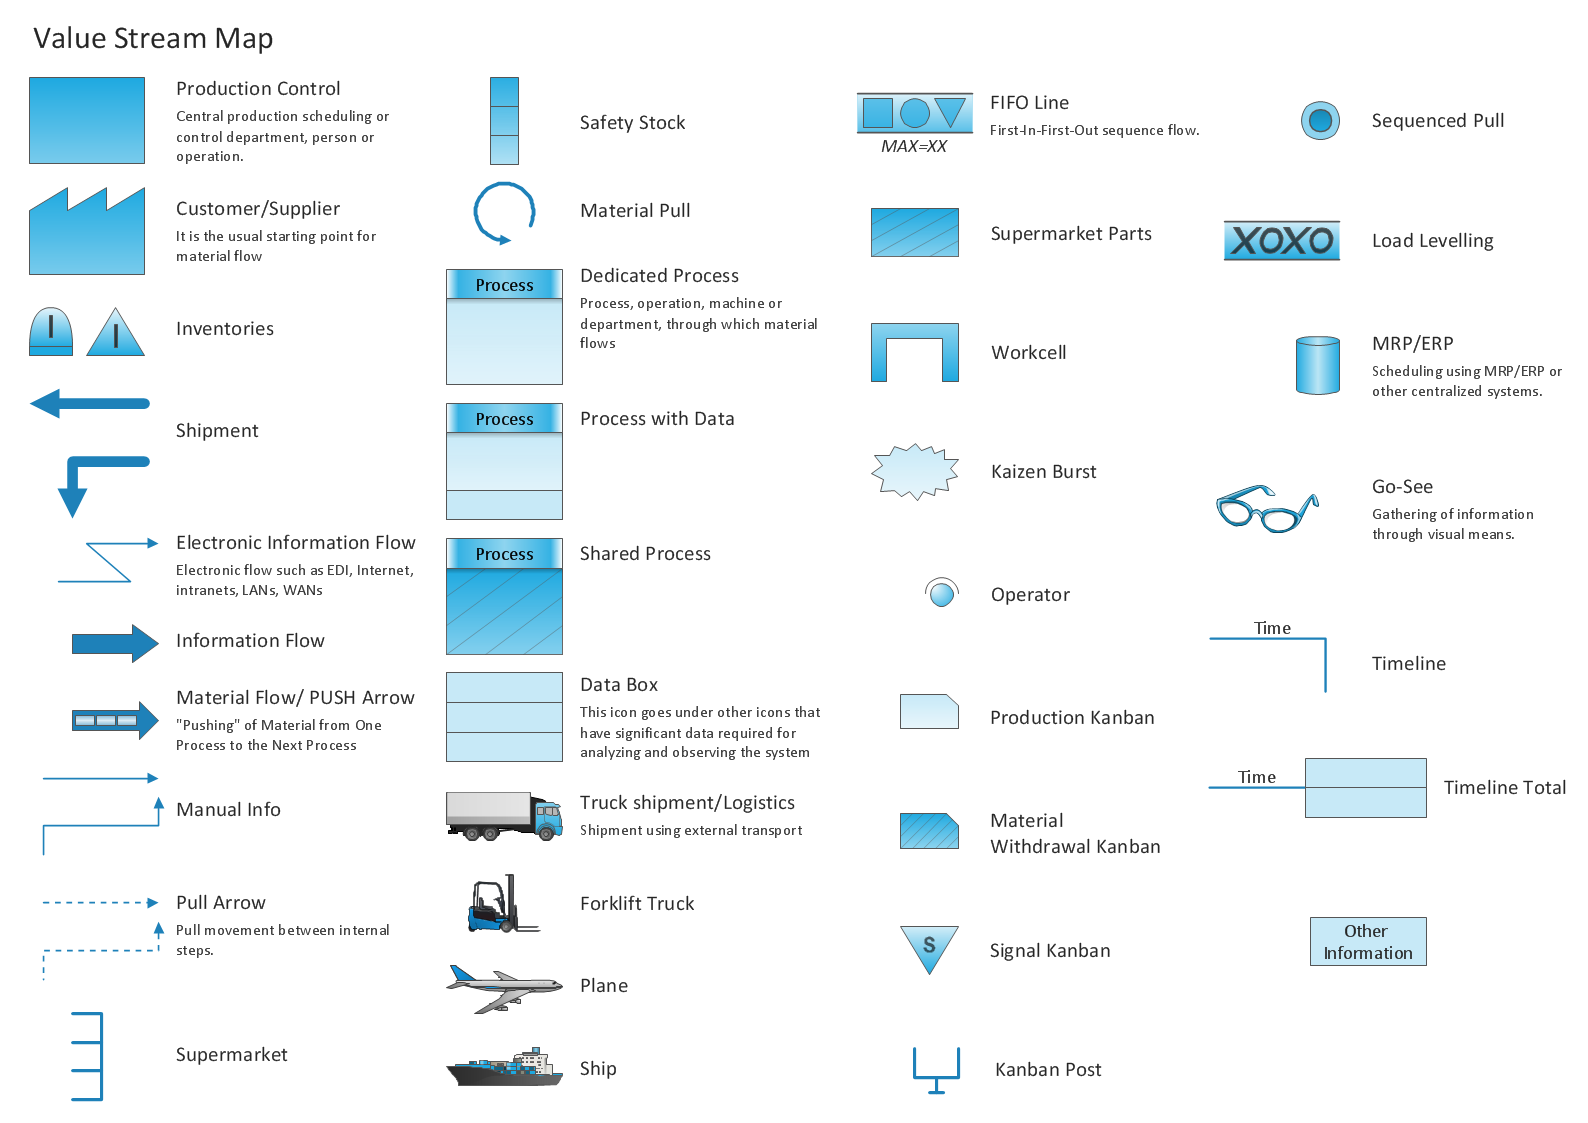
Picture: Value Stream Mapping Icons
Related Solution:
The purchasing process follows very specific guidelines and includes a purchasing cycle flowchart and receiving process flow chart. Common key elements of purchasing process.
It is important to know how purchasing processes work and how each operation is done.
Picture: Purchase Process Flow Chart,Receiving Process Flow Chart,Accounting Flowchart Example.
Related Solution:
When talking about engineering, one should define all the terms used, so anybody could understand the topic. Typical network glossary contains definitions of numerous network appliances, types of networks and cable systems. The understanding of basic is crucial for server management, network administration and investigating problems.
The network glossary defines terms related to networking and communications. The most of glossary items has their visual representation in ConceptDraw DIAGRAM libraries of the Computer Network Diagrams solution. This illustration presents a local area network (LAN) diagram. It designed to show the way the interaction of network devices in a local network. The diagram uses a library containing symbols of network equipment, connections and the end-point devices such as network printer, hubs, server, modem and finally computers (PC, mac, laptop). This diagram depicts a physical LAN topology.
Picture: Network Glossary Definition
Related Solution:
Accounting flowchart is a pictorial way to represent the flow of data in an organization and the flow of transactions process in a specific area of its accounting or financial department. Accounting Flowcharts solution contains the full set of standardized accounting flowchart symbols which will help you design in minutes various types of Accounting Flowcharts including such popular diagrams which represent the whole accounting process: Purchasing Flowchart, Receiving Flowchart, Voucher Payable Flowchart, Treasurer Flowchart, Payment Flowchart.
Picture: Accounting Flowchart Purchasing Receiving Payable and Payment
Related Solution:
26 libraries of the Electrical Engineering Solution of ConceptDraw DIAGRAM make your electrical diagramming simple, efficient, and effective.
Picture: Electrical Symbols — Thermo
Related Solution:
Multiprotocol Label Switching (MPLS) is a mechanism in high-performance telecommunication networks that implements the data transfer from one network node to another using the labels.
ConceptDraw DIAGRAM is a powerful network diagramming and vector drawing software that provides the Computer and Networks solution with wide set of ready-to-use predesigned vector stencils and examples to help you design the MPLS Networks quick and easy.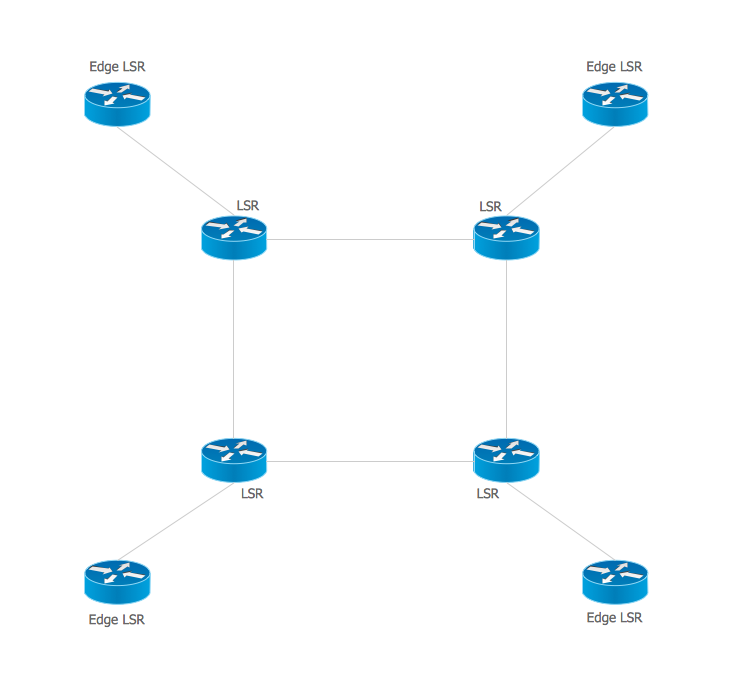
Picture: Multiprotocol Label Switching (MPLS). Computer and Network Examples
Related Solution:
A flowchart is a picture of the separate steps of a process in sequential order.
ConceptDraw DIAGRAM is a Process Flowcharts software. This software includes basic package of process flow examples. The software contains object libraries with vector stencils that allows you use RapidDraw technology. By clicking on direction arrows you can add a new object to the flowchart.
Picture: Example Process Flow
Related Solution:

