How to Use the ″Online Store PR Campaign″ Sample
Using the ConceptDraw Social Media Response solution improves quality of content in social media and helps build an active customer community. It allows companies to be more effective in timely messaging thanks to the ability for rapid response to a customer′s post in social media. This saves budget for companies who use social media for promoting and as a lead generation tool.
The Social Media Response solution creates interactive social media flow charts and action mind maps. The solution includes a video tutorial and a number of samples helping social media teams refine and organize their response process. There are materials to help trainers and consultants develop a social media strategy and provide training for social media groups on how to effectively accomplish their daily work.

Sample 1. Online-Store-Social-Media-Response-Flowchart
See also Samples:
-
Mind Maps
-
Idea Communication
-
Marketing — Social Media
TEN RELATED HOW TO's:Accounting flowchart is a system of processes to represent accounting system of an organization. If you need to know how accounting processes work and how each operation is done, the Accounting Flowcharts Solution for ConceptDraw DIAGRAM has a predesigned library, tips, methods and symbols for easy drawing an Accounting Flowchart.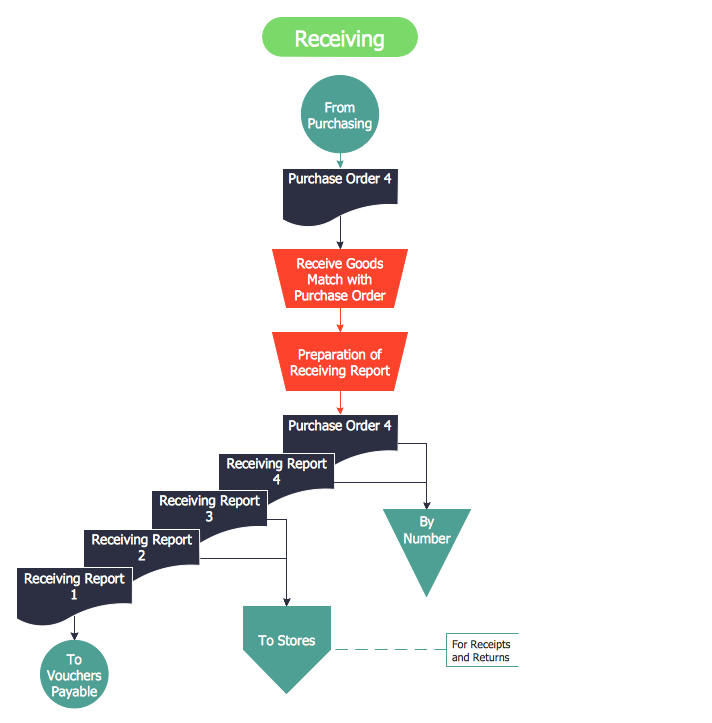 Picture: Accounting FlowchartRelated Solution:The role of ConceptDraw MINDMAP is to organize and plan idea development and communicate between process participants. Mind maps are convenient to prepare presentations for team and management and send task lists and related information.
 Picture: Product OverviewA family evening in a restaurant can be just charming, the problem is to find a one. If you spend an extra day to create a good restaurant floor plan, that will surely brings more clients. By the time your restaurant gets more popular, don’t forget about the quality of service. The restaurant floor plan you see on this page was made with ConceptDraw DIAGRAM in accompanied with Cafe and Restaurant Plans solution. It introduces facilities of the solution and demonstrates the results, you can obtain if you deploy ConceptDraw tools for generating floor plans and interior designs for cafe, restaurants or other catering establishments. A little less than three hundred vector objects, and a set of built-in templates and a set of examples will maintain your creativeness.
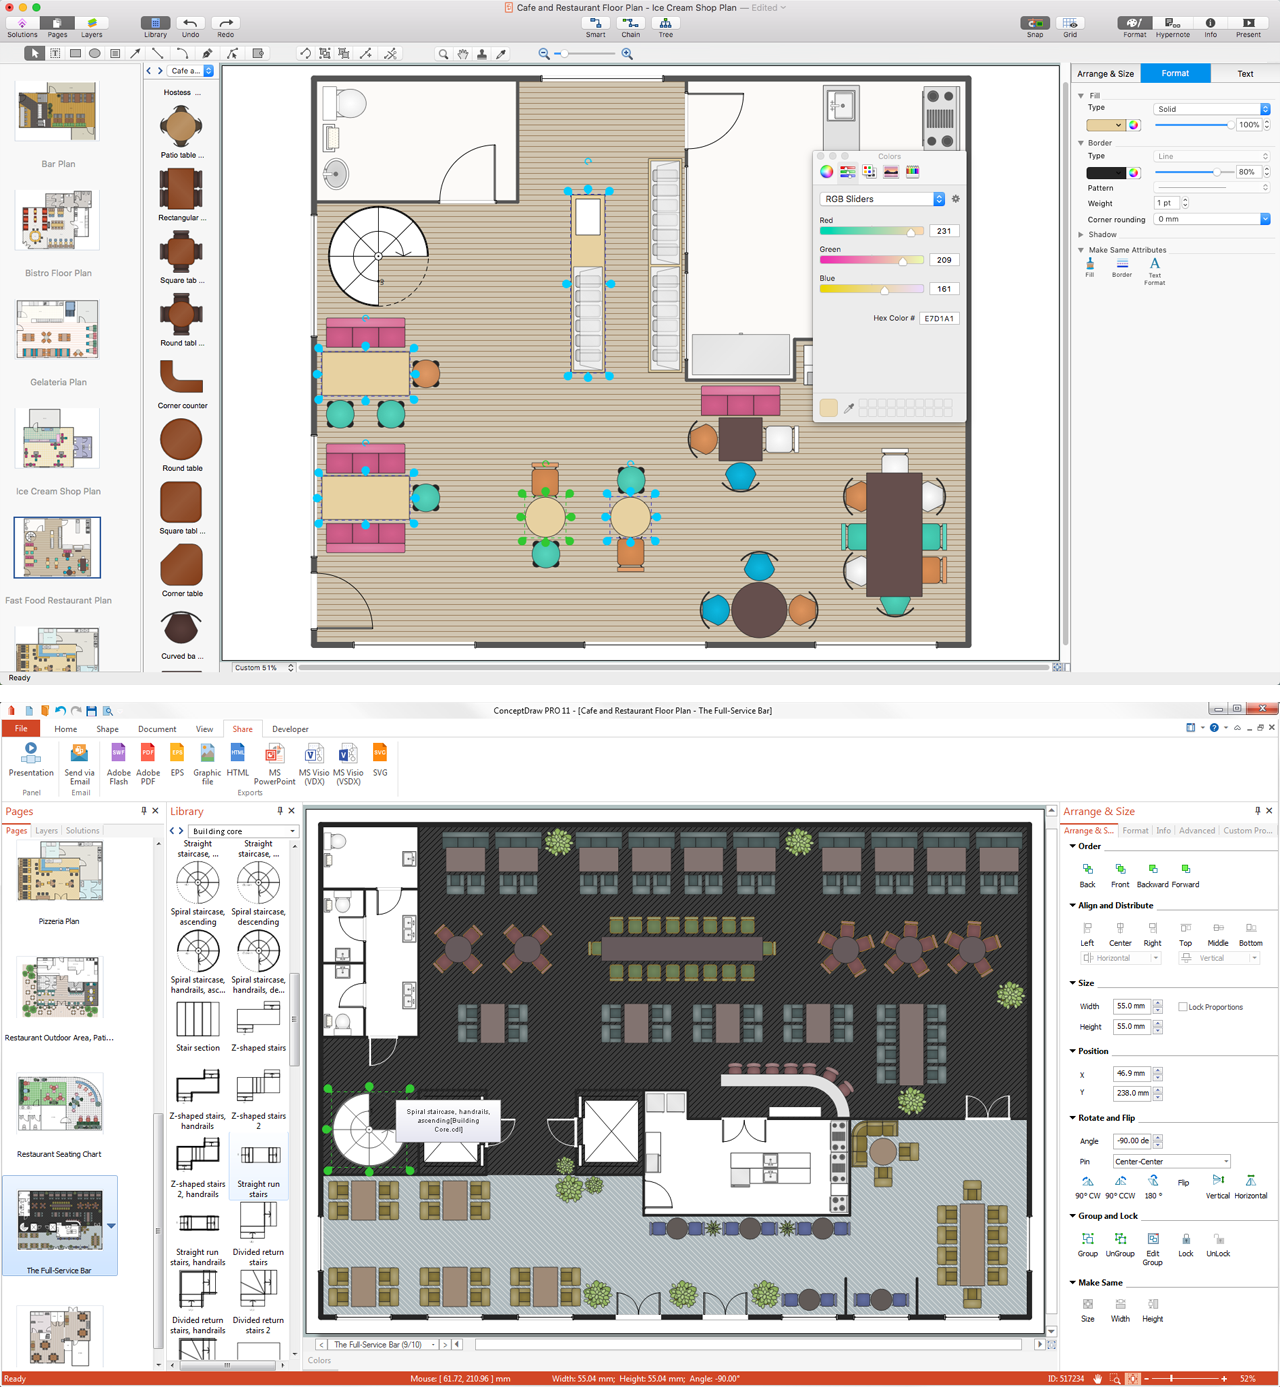 Picture: Restaurant Floor PlansRelated Solution:To create an Audit Process FlowChart you only need Conceptdaw Software.
 Picture: Basic Audit Flowchart. Flowchart ExamplesRelated Solution:ConceptDraw DIAGRAM diagramming and vector drawing software extended with Flowcharts Solution from the 'Diagrams' area of ConceptDraw Solution Park is a powerful tool for drawing Flow Charts of any complexity you need. Irrespective of whether you want to draw a Simple Flow Chart or large complex Flow Diagram, you estimate to do it without efforts thanks to the extensive drawing tools of Flowcharts solution, there are professional flowchart symbols and basic flowchart symbols. This sample shows the Gravitational Search Algorithm (GSA) that is the optimization algorithm.
 Picture: Simple Flow ChartRelated Solution:This template was created in ConceptDraw DIAGRAM diagramming and vector drawing software using the Block Diagrams Solution from the “Diagrams” area of ConceptDraw Solution Park. This template shows the Product Proposal Diagram on that is displayed the sequence of the product planning steps. This diagram is convenient, visual and clear.
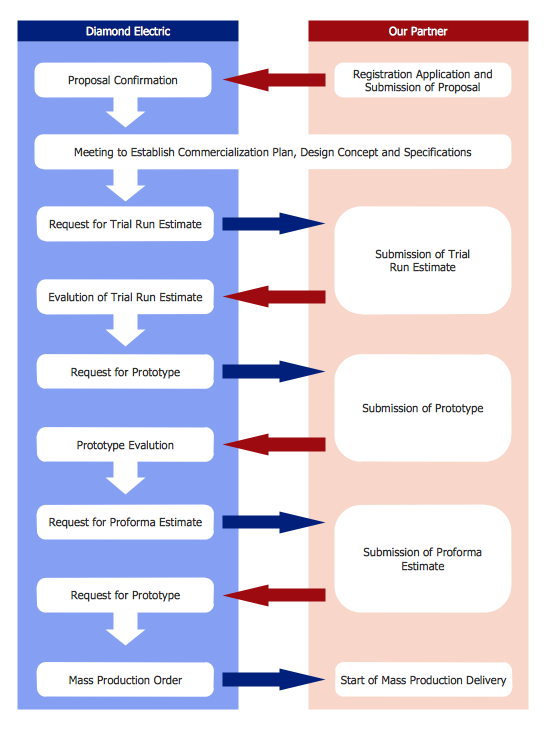 Picture: Product Proposal TemplateRelated Solution:The Involvement Matrix can identify the distribution of responsibilities and identify roles in a group or team. Use the Involvement Matrix to specify roles and responsibilities of actions in problem solving. ConceptDraw Office suite is a software for corrective actions planning.
 Picture: CORRECTIVE ACTIONS PLANNING. Involvement MatrixInteractive tool helps you find the appropriate response to social media mentions quickly. There are materials to help trainers and consultants develop a social media strategy and provide training for social media groups on how to effectively accomplish their daily work.
 Picture: How to Present a Social Media Response Plan DFD to Your TeamRelated Solution:Interactive tool helps you find the appropriate response to social media mentions quickly.
 Picture: What Is an Action Mind MapRelated Solution:The Rapid UML solution from Software Development area of ConceptDraw Solution Park includes 13 vector stencils libraries for drawing the UML 2.4 diagrams using ConceptDraw DIAGRAM diagramming and vector drawing software.
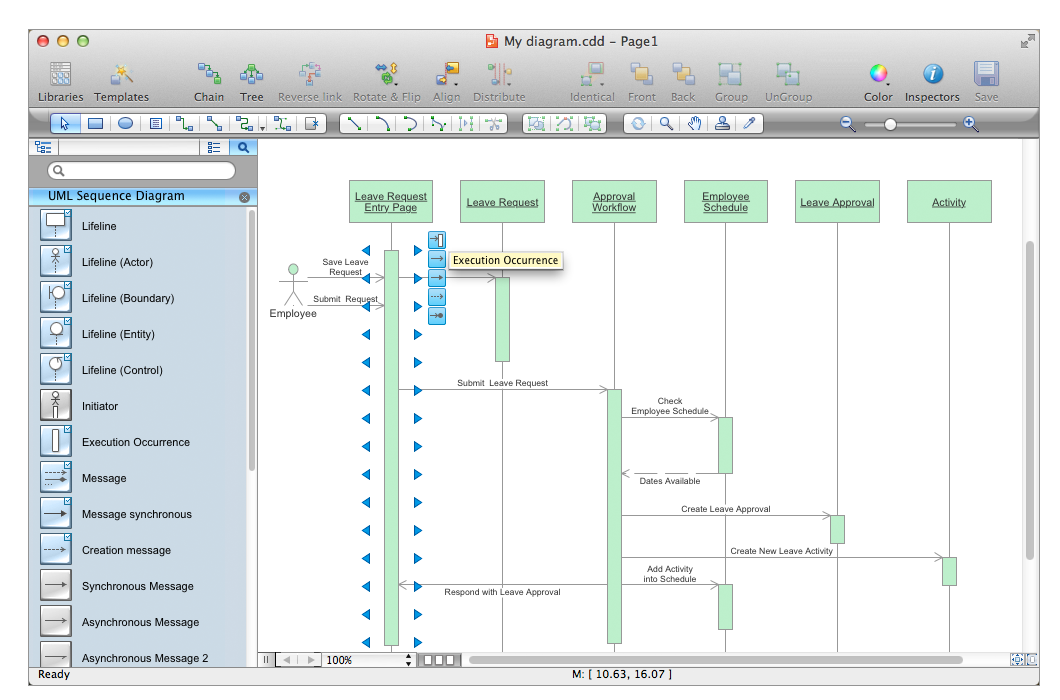 Picture: Design Elements for UML DiagramsRelated Solution:ConceptDrawDIAGRAM 18