The Building Blocks Used in EPC Diagrams
Event-driven Process Chain
The Event-driven Process Chain (EPC) Diagrams allows managers visually present process models for they business implementation.
ConceptDraw DIAGRAM is a powerful intelligent vector graphics engine for drawing graphics like EPC diagrams. Event-driven Process Chain Diagrams solution includes 10+ Blocks that you can modify and make your own graphics.

Pic.1 Design elements for EPC diagrams (Win, Mac).
Stencil library EPC Diagram Shapes from Event-driven Process Chain Diagrams solution provides 23 vector design elements for drawing event-driven process chain diagrams.
Use design elements from the EPC Diagram Shapes library for drawing your EPC diagrams to plan resources and improve business processes.
TEN RELATED HOW TO's:
Event-Driven Process Chain Diagrams for improvement throughout an organisation.
ConceptDraw DIAGRAM - software that reduces the time needed to create a business process model.
Picture: EPC for Configuring an Enterprise Resource Planning
Related Solution:
It’s very easy, quick and convenient to draw the Event-driven Process Chain (EPC) diagrams in ConceptDraw DIAGRAM diagramming and vector drawing software using the Event-driven Process Chain Diagrams Solution from the Business Processes area of ConceptDraw Solution Park.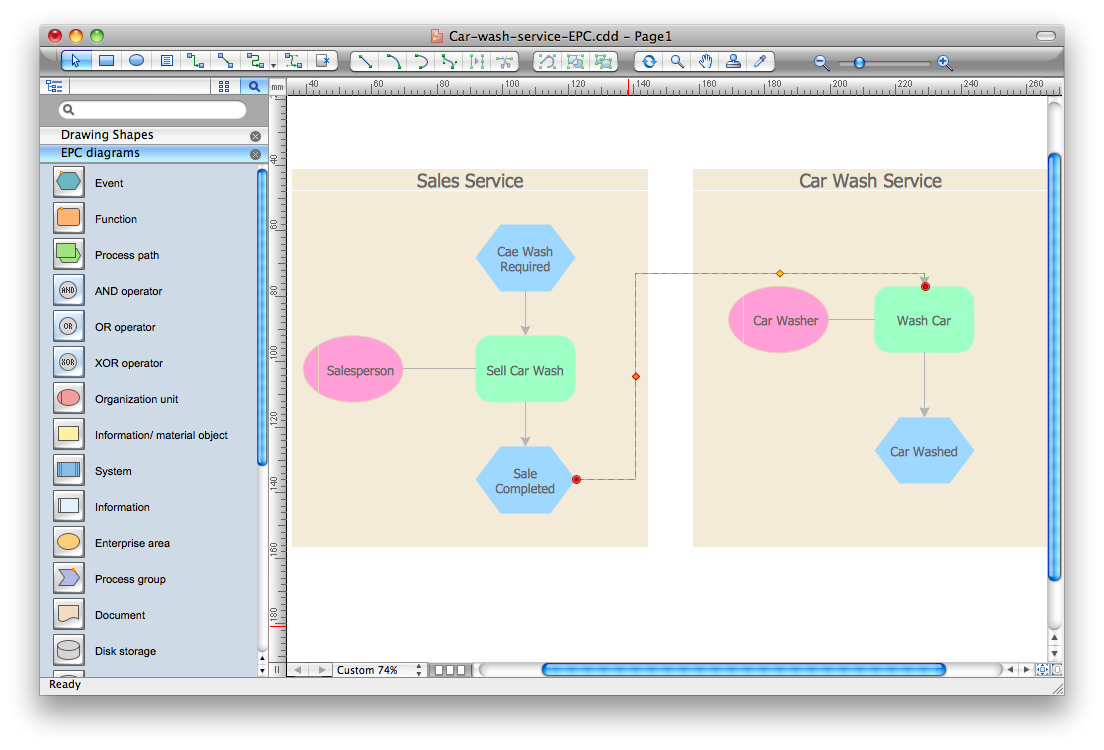
Picture: Event-Driven Process Chain Diagram Software
Related Solution:
Use ConceptDraw DIAGRAM diagramming and vector graphics software to visually model your own IT construction processes.
Picture: How to Create a Process Flowchart
Related Solution:
Sequence Diagrams shows how objects communicate with each other in terms of a sequence of messages. Also indicates the lifespans of objects relative to those messages.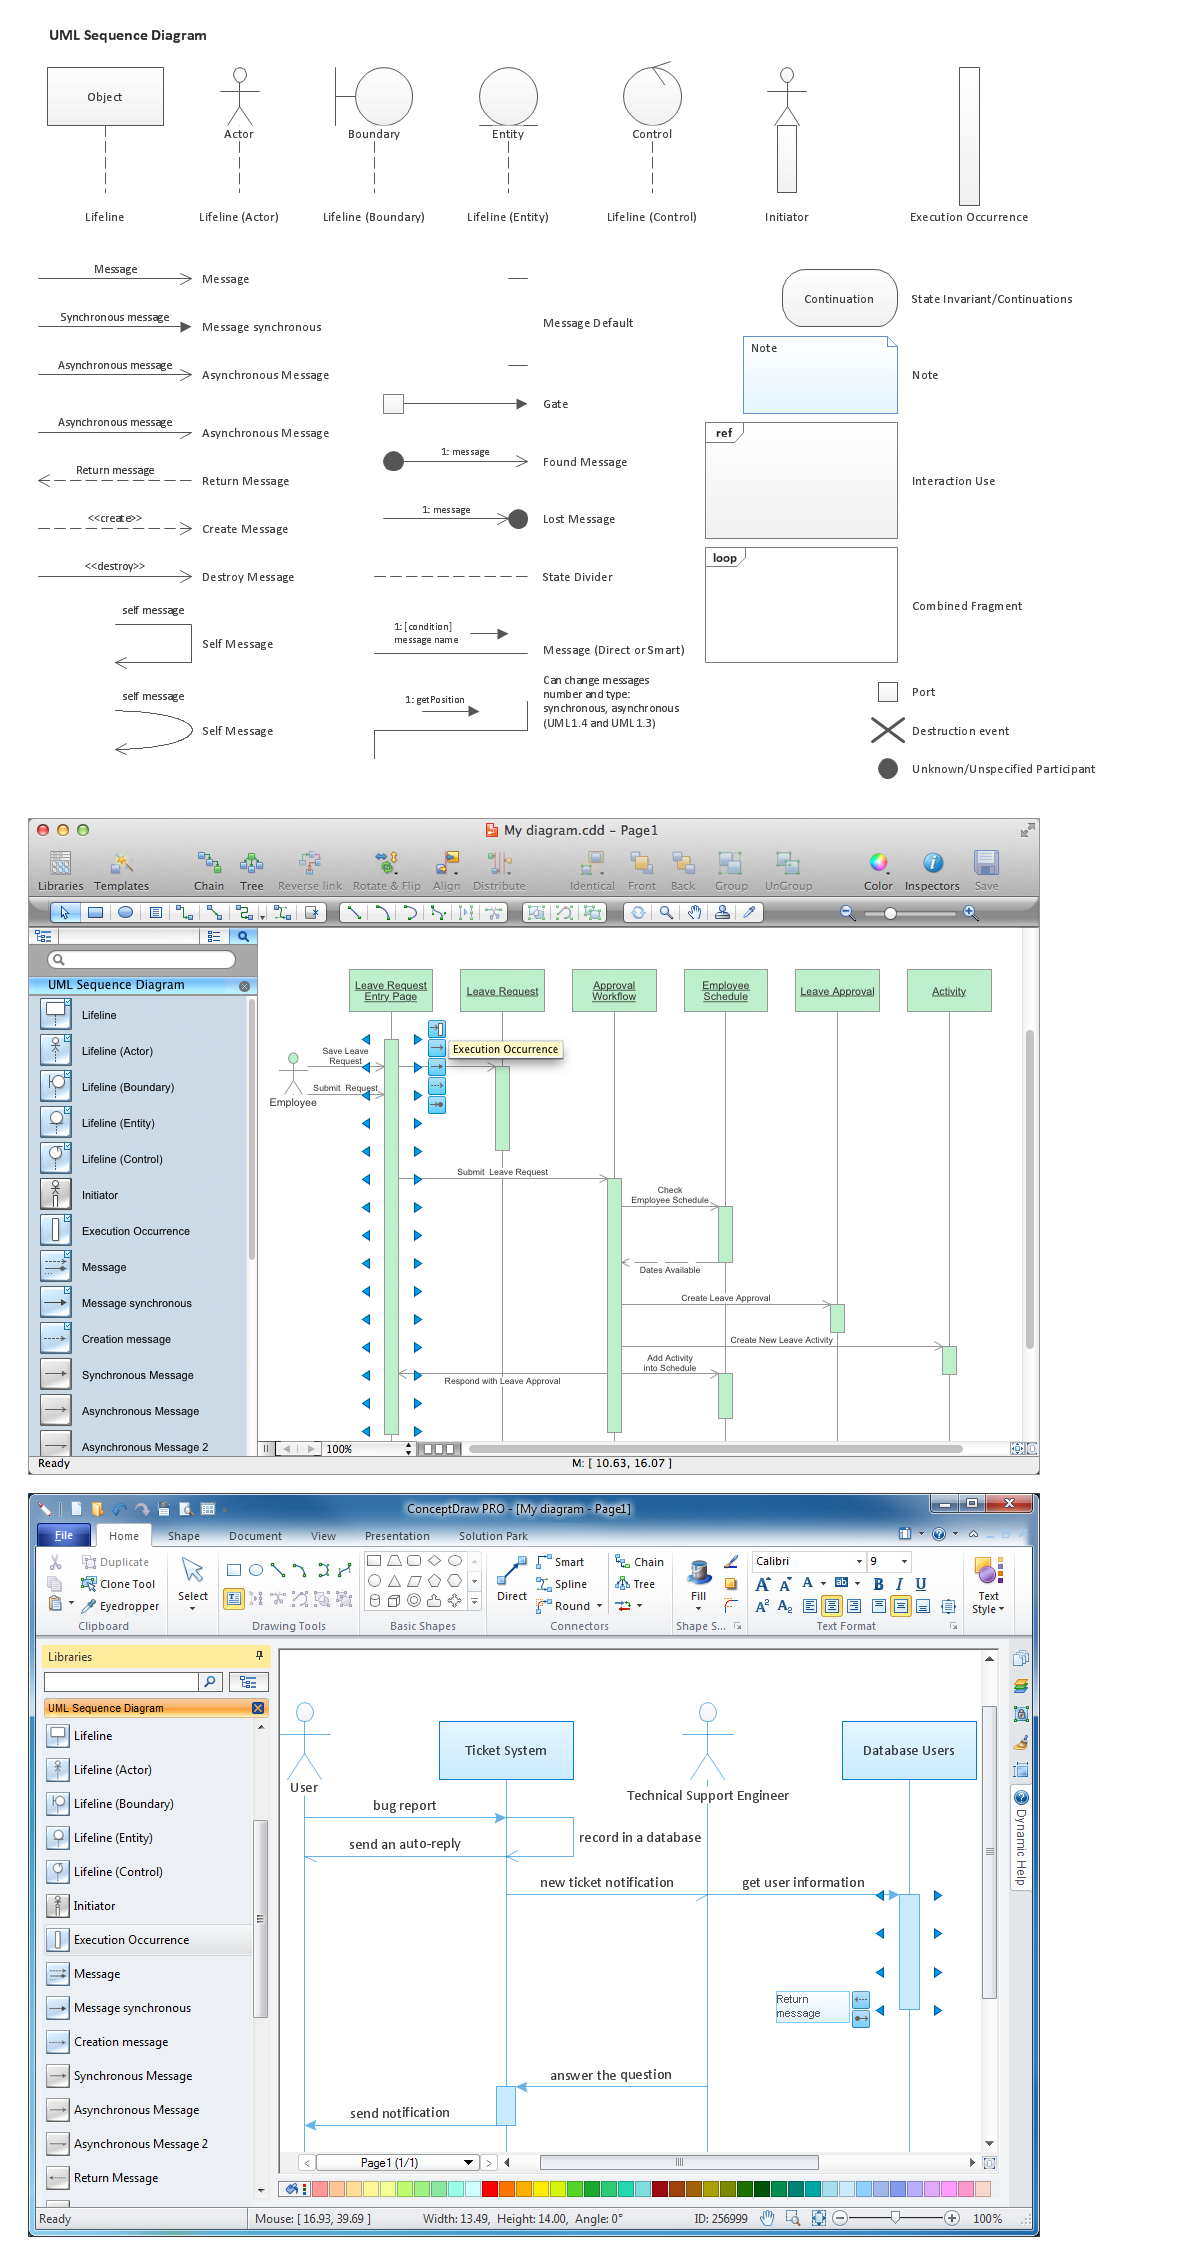
Picture: Diagramming Software for designing UML Sequence Diagrams
The most worked out and commonly used methodology of business processes description is IDEF methodology. Besides business processes it allows to describe functional blocks, for example production and marketing. ConceptDraw lets creation of business processes description using IDEF0 and IDEF2 methods.
Picture: Business Processes
Related Solution:
Job duties in small companies are usually spread randomly among workers, causing lots of problems and misunderstanding. One of the ways to restore order in business processing is to create a cross-functional flowchart with swim lanes that would represent every step in production system. Another advantage of using swim lanes flowchart is that it represents not only processes, but people responsible for them.
Swim lane diagram is a kind of a process flow diagram. Its special feature is that it joins the features of process flow diagrams with organizational charts. Thus, a swim lane diagram display a participant of the business process in a conjunction with general flow of the business system. A swim lane diagram is looks similar to a swimming pool's lanes. Lanes can be horizontal and vertical. The lanes are pointed out relatively to resource name, which is assigned on implementation of the given part of the business process. ConceptDraw Business Process Mapping solution delivers the ability to design develop swim lanes flowcharts using the vector graphic objects of Swim Lanes library.
Picture: Swim Lane Diagrams
Related Solution:
ConceptDraw is a best data visualization tool that will allow everyone to create rich infographics and visualizations quickly and easily.
Picture: Best Tool for Infographic Construction
ConceptDraw DIAGRAM is a powerful chemistry drawing software that provides the useful tools to help you design all kinds of chemistry drawings and illustrations, chemical schemes and diagrams of formulas, reaction schemes and lab set-ups of any complexity.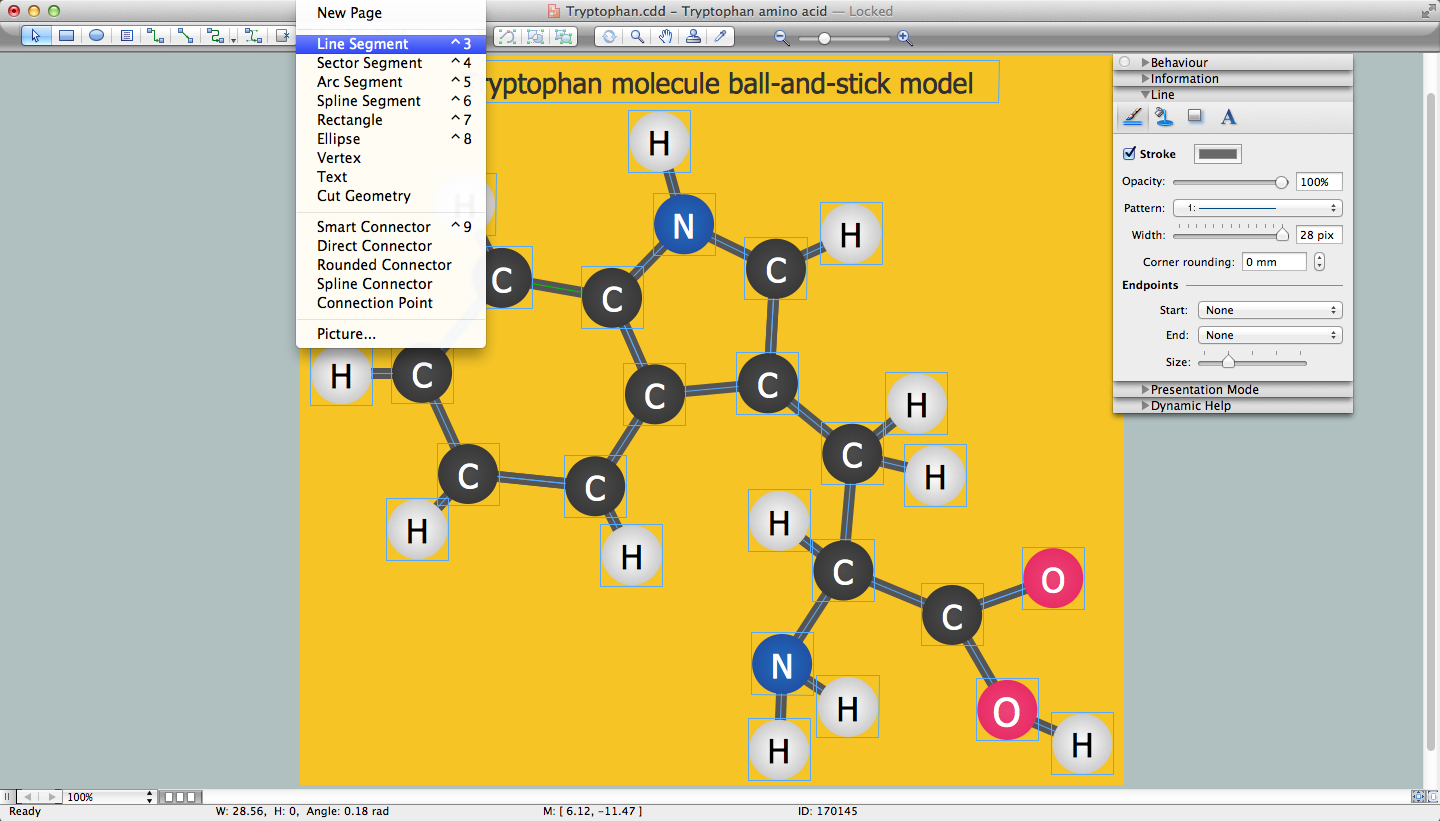
Picture: Chemistry Drawing Software
Related Solution:
You need create a Sales Process Map? Use the ConceptDraw DIAGRAM software which is ideal for the sales process management, marketing and engineering thanks to the powerful Sales Flowcharts solution from the Marketing area of ConceptDraw Solution Park.
Picture: Sales Process Map
Related Solution:
Business process maps help you evaluate and manage quality in a work process chain, placing an emphasis on corporate performance and optimization.
Business Mapping Software a versatile collection of libraries and templates, that allow you to create business process and SIPOC diagrams, using the Six Sigma methodology.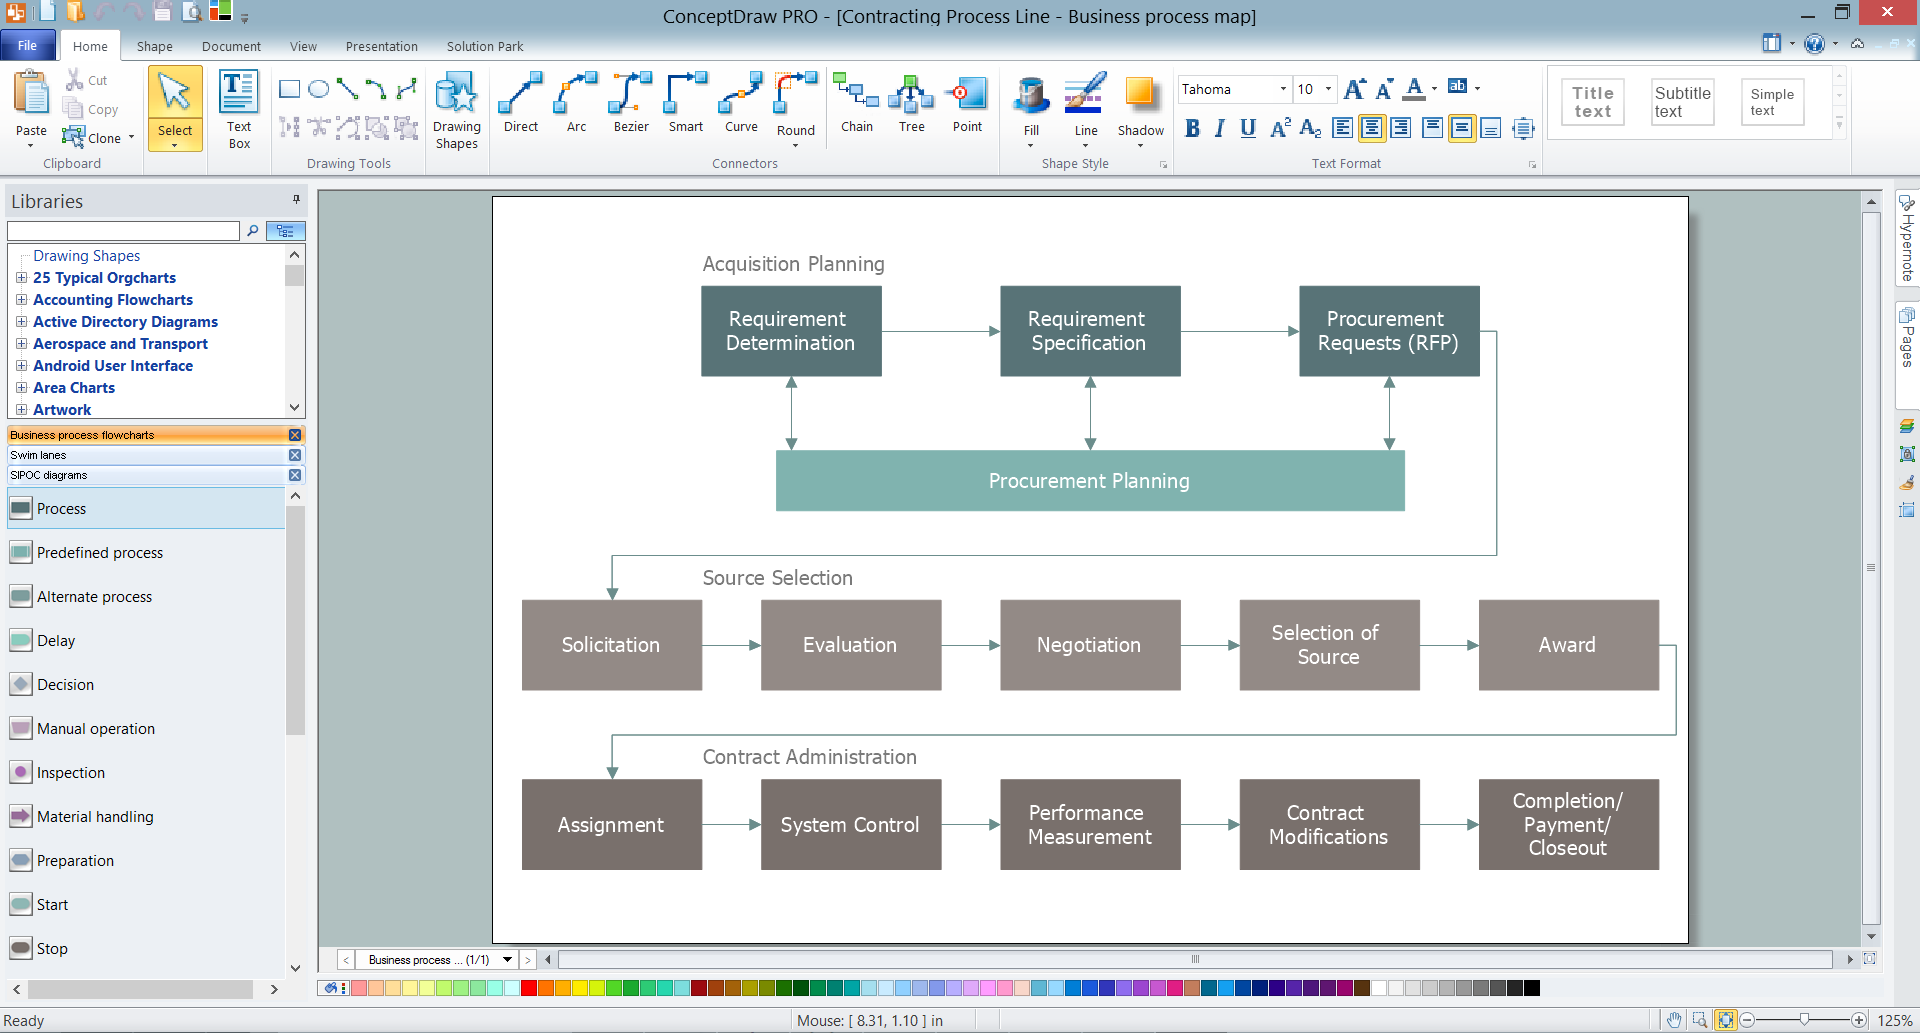
Picture: Business Mapping Software
Related Solution:
ConceptDraw
DIAGRAM 18