Graphical Symbols to use in EPC diagrams
Event-driven Process Chain
ConceptDraw DIAGRAM is a powerful intelligent vector graphics engine for drawing documents like EPC diagrams. Event-driven Process Chain Diagrams solution includes 10+ Blocks that you can modify and make your own graphics.
The Event-driven Process Chain (EPC) Diagrams allows managers visually present process models for they business implementation.

Pic.1 Graphical symbols for EPC diagrams (Win, Mac).
Stencil library EPC Diagram shapes from Event-driven Process Chain Diagrams solution provides 23 vector graphical symbols for drawing event-driven process chain diagrams.
Use design elements from the EPC Diagram shapes library for drawing your EPC diagrams to plan resources and improve business processes.
TEN RELATED HOW TO's:
Talking about companies, that have influenced the entire industry, we should mention Cisco and it’s influence on network design. Nowadays, this equipment has became a kind of standard, and Cisco icons, shapes, stencils, symbols and design elements are easily recognized among others. You can use these icons to develop a network diagram of any complexity.
When dealing with creating a pack of network documentation, system administrator often have to depict a network containing a network equipment of such a well-known manufacturer as Cisco. As Cisco has developed its own production standard icons that are strongly recommended to use in Cisco network diagrams. The best way to draw Cisco Network diagram Cisco certified icons is using ConceptDraw solution for Cisco Network Diagrams. Using Cisco symbols library provided by this solution allows system administrator, or network architect to design a prototype of a new network or document an existing one.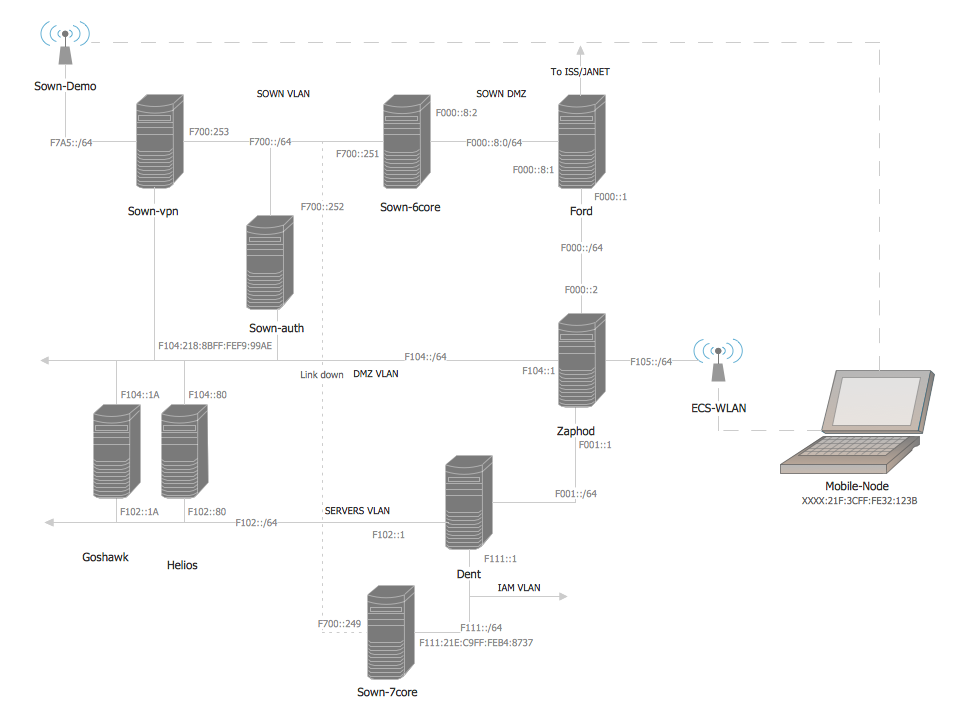
Picture: Cisco Network Design. Cisco icons, shapes, stencils, symbols and design elements
Related Solution:
ERD drawing becomes easier with predesigned entity relationship symbols, work flow shapes, entity relationship stencils. All variety of ERD symbols you may need for ERDs design is packed into libraries and templates from Entity-Relationship Diagram (ERD) Solution for ConceptDraw DIAGRAM diagramming and vector drawing software.
But anyone have an ERD symbols quick reference? Detailed reference information for them is represented at the tables.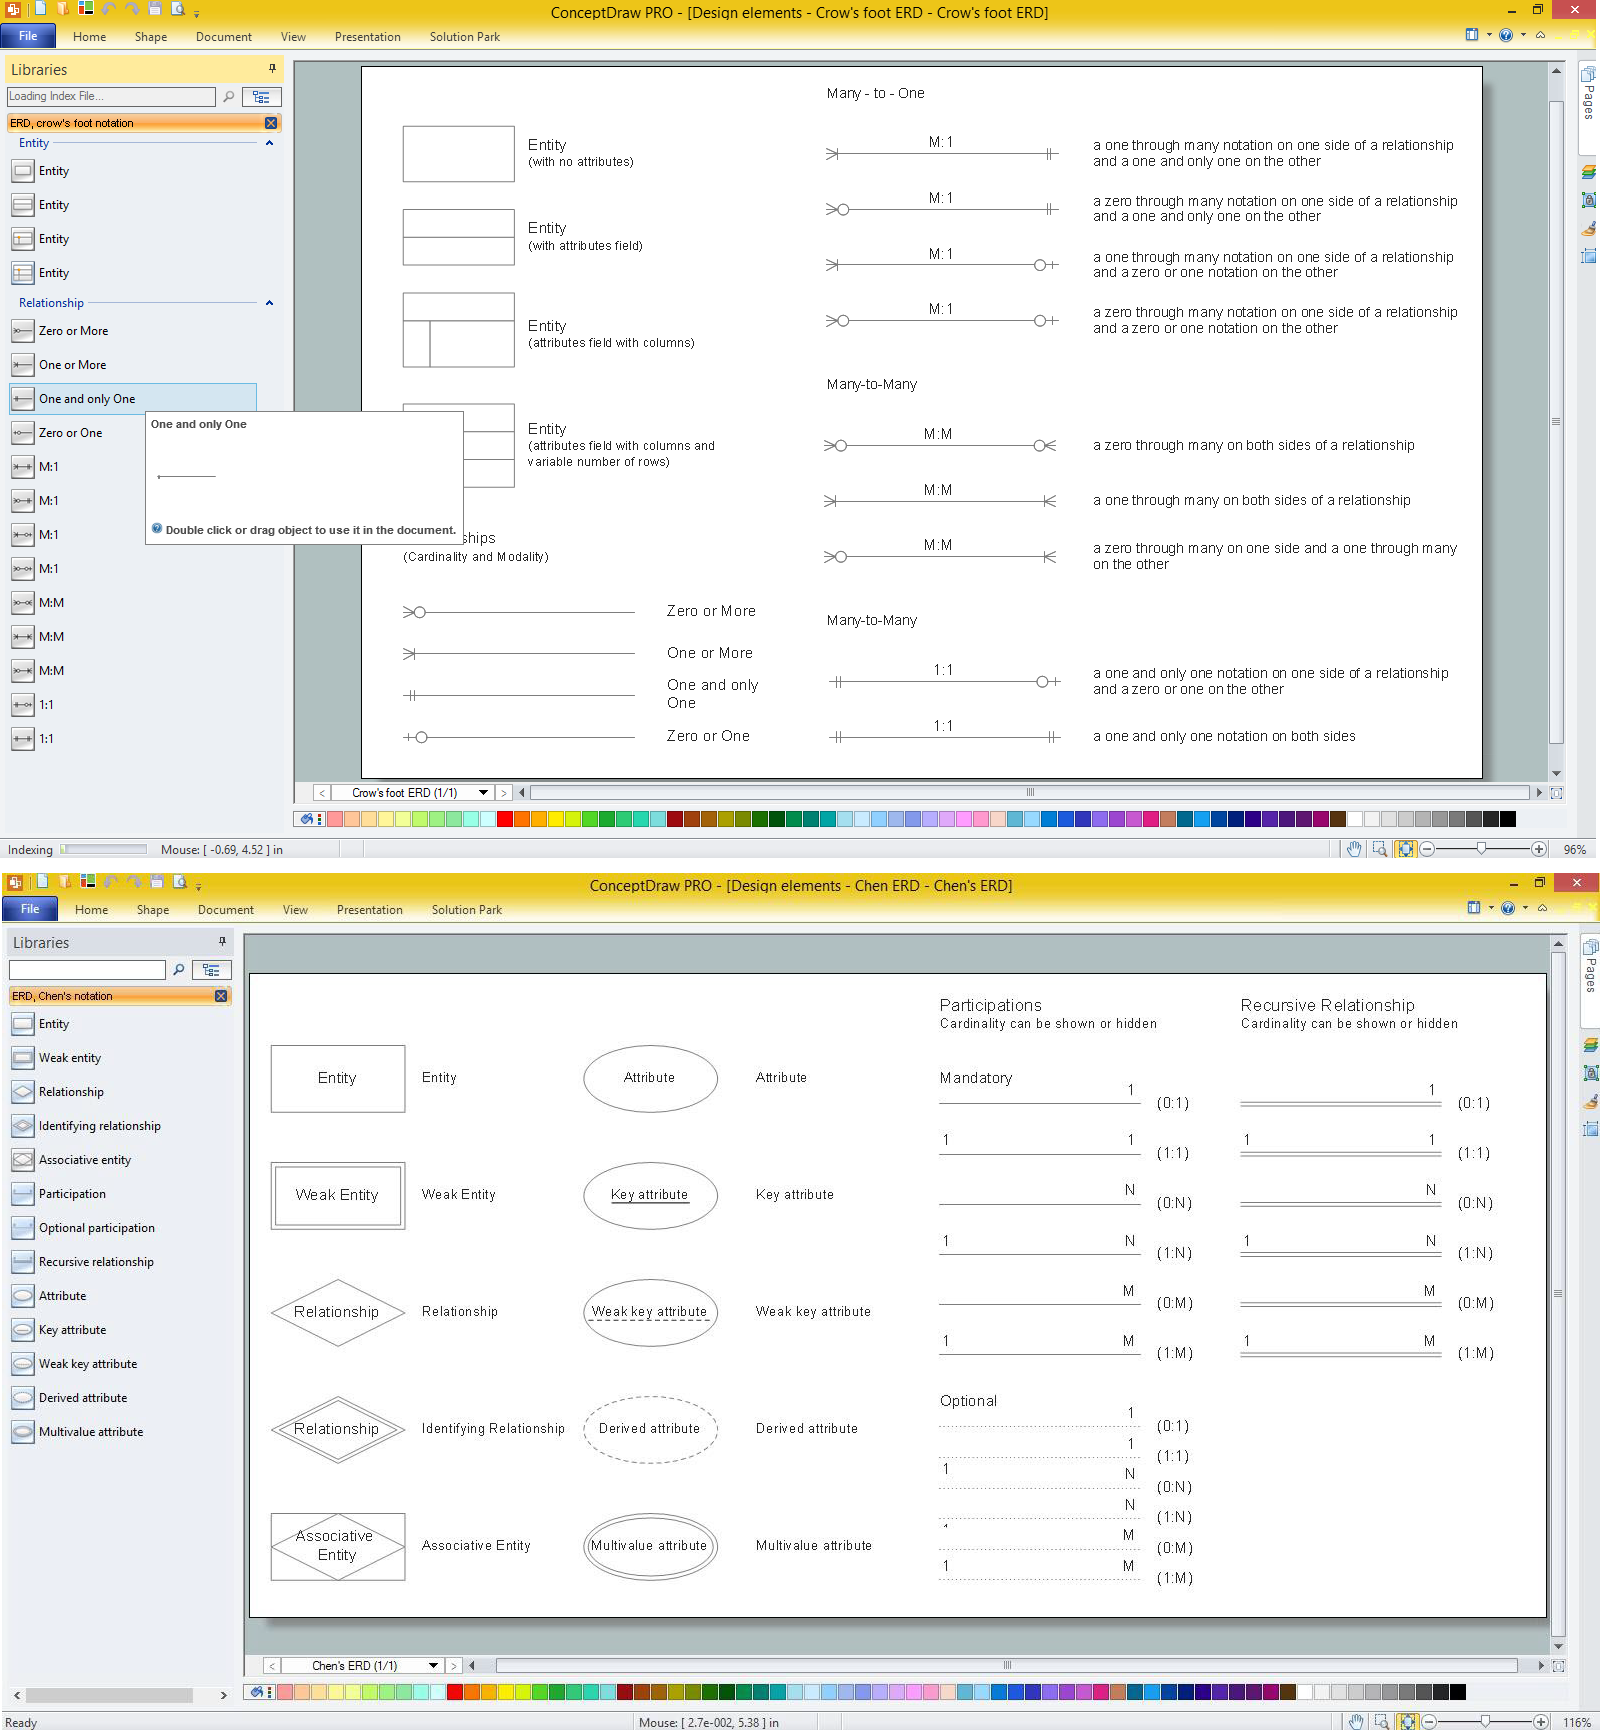
Picture: Anyone Have an ERD Symbols Quick Reference?
Related Solution:
The Nature Solution addition to ConceptDraw Solution Park for ConceptDraw DIAGRAM includes new libraries that provide a wide range nature objects and it can be used in many areas.
Picture: Drawing Illustration
ConceptDraw MINDMAP is ready to provide you with mind mapping tool which can serve as comprehensive productivity tool for your business.
Picture: Think. Act. Accomplish.
Chemistry solution offers 6 libraries with large collection of vector chemistry symbols and meanings, chemistry equation symbols, organic chemistry symbols, and chemical clipart.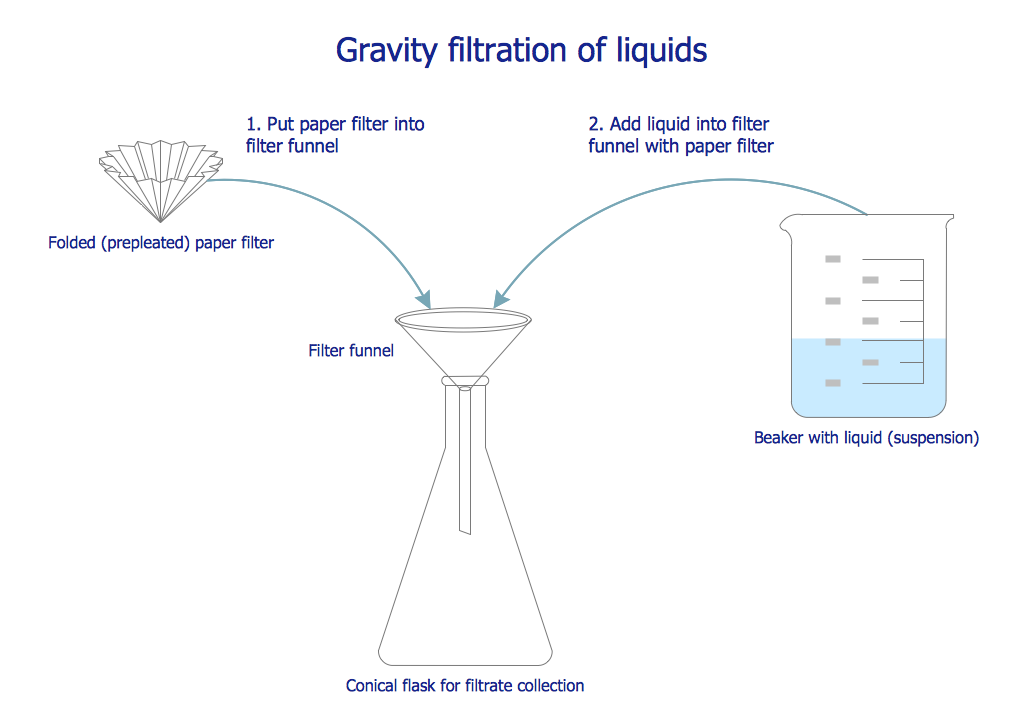
Picture: Chemistry Symbols and Meanings
Related Solution:
Accounting Data Flow from the Accounting Flowcharts Solution visually describes the financial accounting process, shows the accumulated information about transactions and events for creating the balance sheet and the final income statement.
Accounting Flowcharts Solution contains also a wide variety of templates and samples that you can use as the base for your own Accounting Flowcharts of any complexity.
Picture: Accounting Data Flow from the Accounting Flowcharts Solution
Related Solution:
ConceptDraw DIAGRAM is a Mac OS X and Windows software. Numerous vector stencils, samples and templates created by designers are included in the basic package. This is classic flowchart maker which exactly follows the industry standards using flowchart symbols geathered during a ten years into solution park.
Picture: Flowchart Software
Related Solution:
When thinking about data visualization, one of the first tools that comes to mind is a flowchart design. You can find flowchart symbols, shapes, stencils and icons easily on the Internet, but it might take time to systematize this information. Nevertheless, once you start flowcharting, you’ll love its simplicity and efficiency.
This diagram consists from standard flowchart symbols, approved by ANSI (American National Standard Institute) for drawing flowcharts. A flowchart is a diagram that represents a step-by-step algorithm of any process, displaying the process stages as boxes that are connected with arrows. Flowchart design makes it clear and readable.
Flowchart designed using ConceptDraw DIAGRAM flowchart software allows to make attractive and clear process presentation, it makes interpretation of the business process flow fresh and versatile. Great flowchart design view is a big advantage over the diagram created manually on a paper.
Picture: Flowchart Design: Principles, Layout, Symbols and Best Practices
Related Solution:
Wireless Networks solution from ConceptDraw Solution Park extends ConceptDraw DIAGRAM to help network engineers and designers efficiently illustrate wireless network mode diagrams.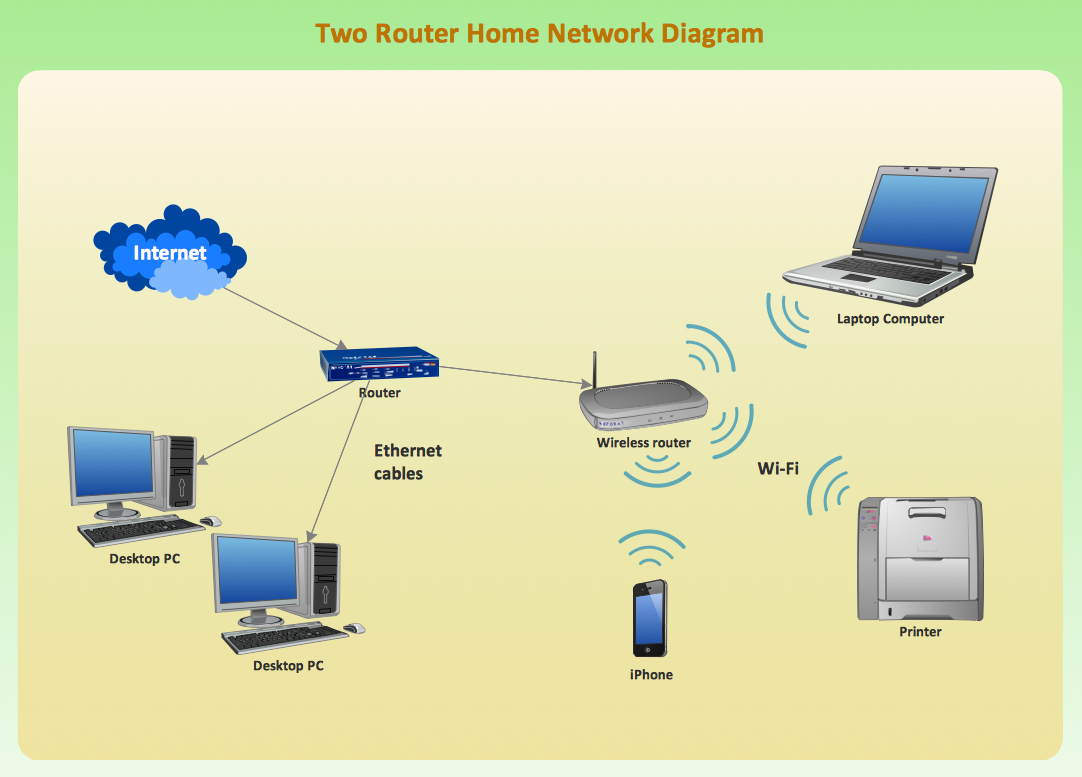
Picture: Wireless Network Mode
Related Solution:
ConceptDraw DIAGRAM extended with Mathematics solution from the Science and Education area is a powerful diagramming and vector drawing software that offers all needed tools for mathematical diagrams designing.
Mathematics solution provides 3 libraries with predesigned vector mathematics symbols and figures:
Solid Geometry Library, Plane Geometry Library and Trigonometric Functions Library.
Picture: Mathematics Symbols
Related Solution:
ConceptDraw
DIAGRAM 18