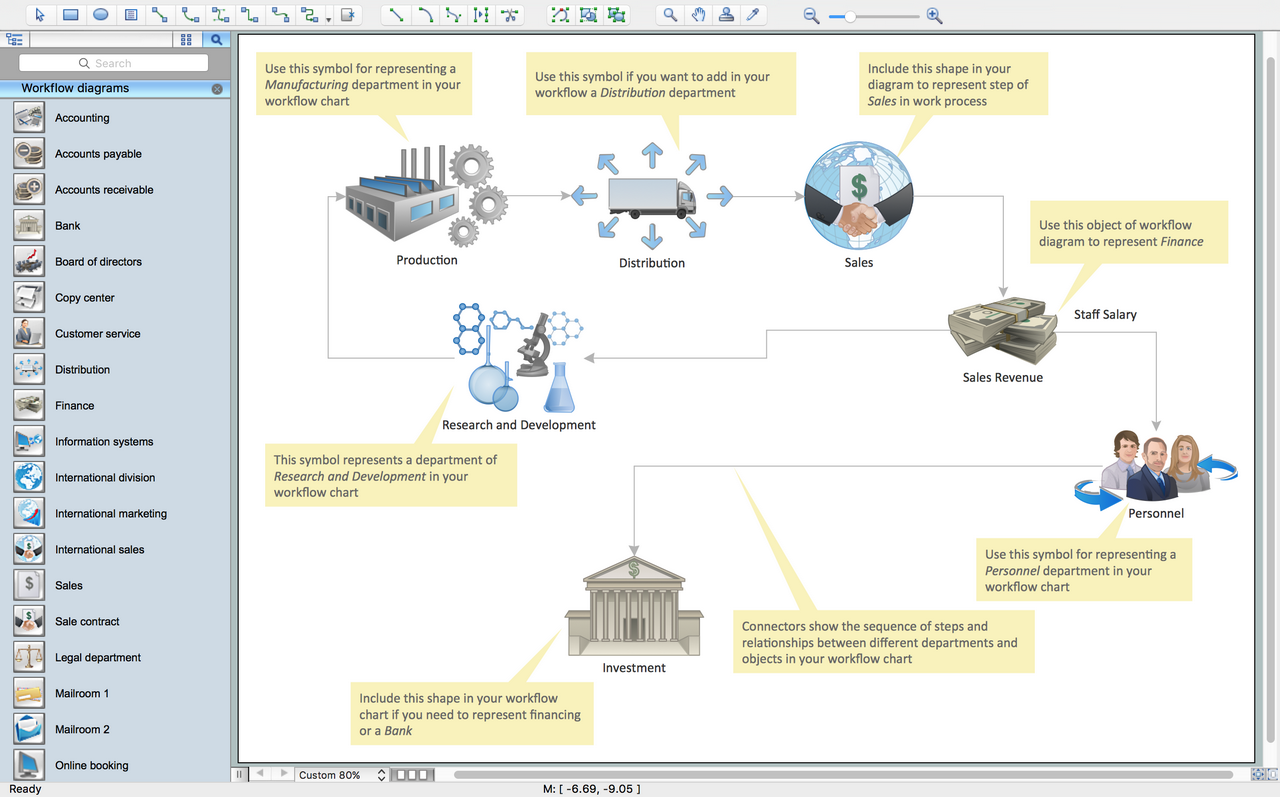
Pic.2 Template of Workflow chart
The Workflow Diagrams solution extends ConceptDraw DIAGRAM software with samples, templates and library of vector stencils for drawing workflow charts. It represents the transferring of data, documents, and tasks during performance of a work process.

Pic.3 Workflow Diagrams solution
Use workflow flowcharts to analyze the work processes, to show the path of the tasks, the responsible persons and the associated documents, to identify required resources, to optimize a workflow, and to discover its inherent weak points.
See also Samples:
TEN RELATED HOW TO's:
Pie Graph is very popular kind of charts which is widely used in various fields of science and life activities. ConceptDraw DIAGRAM extended with Pie Charts Solution from the Graphs and Charts area is the best software for drawing the Pie Graph Worksheets.
Picture: Pie Graph Worksheets
Related Solution:
Users new to ConceptDraw PROJECT will find the Basic lessons an essential platform for familiarizing themselves with the program′s functions. Learn how to assign resources to tasks in ConceptDraw PROJECT with this comprehensive video lesson.
Picture: Project — Assigning Resources
Related Solutions:
Use ConceptDraw DIAGRAM software with Flowcharts Solution to create Process Flow Charts, Flow Chart Process Maps, and High-Level Process Flow Charts to illustrate ✔️ high-level processes in industrial, chemical, and process engineering, ✔️ major plant processes, ✔️ minor details
Picture: Process Flow Chart
Related Solution:
Job duties in small companies are usually spread randomly among workers, causing lots of problems and misunderstanding. One of the ways to restore order in business processing is to create a cross-functional flowchart with swim lanes that would represent every step in production system. Another advantage of using swim lanes flowchart is that it represents not only processes, but people responsible for them.
Swim lane diagram is a kind of a process flow diagram. Its special feature is that it joins the features of process flow diagrams with organizational charts. Thus, a swim lane diagram display a participant of the business process in a conjunction with general flow of the business system. A swim lane diagram is looks similar to a swimming pool's lanes. Lanes can be horizontal and vertical. The lanes are pointed out relatively to resource name, which is assigned on implementation of the given part of the business process. ConceptDraw Business Process Mapping solution delivers the ability to design develop swim lanes flowcharts using the vector graphic objects of Swim Lanes library.
Picture: Swim Lane Diagrams
Related Solution:
Describing a workflow or approval process can take hours and be too complicated, especially since there are options to do it quickly and vividly. Diagrams called flowcharts replace long paragraphs of boring text and represent information in a graphic way. You can draw one on paper or you can use flowchart software to do it quickly and scalable. This kind of software is easy to use and you don’t need any special skills to start using it. In addition, there are a lot examples and predesigned templates on the Internet.
Flowcharts are a best tool for staking out a huge and complex process into some small readable parts. Surely, flowcharts can be drawn manually but the use of standard symbols that make it clear for a wide audience makes a software tool preferred for this task. The core for a successful flowchart is its simplicity. That is why often before beginning making flowchart through software, people draw the sketch on a piece of paper. Designing an effective flowchart means the combination of the data needed to be shown and the simplicity with which you depict it.
Picture: Flowchart Software: A Comprehensive Guide
Related Solution:
As restaurant industry is growing rapidly nowadays, researches show that almost half of the adults have worked in a restaurant or a cafe. Moreover, many of them dream to start their own someday. Unfortunately, it takes a lot of time to write a business plan and to find a great location, although some know how to create a restaurant floor plan in minutes or how to plan budget effortlessly. Hiring employees can also cause a lot of headache, but this is crucial for further success, because every guest comes to restaurant for a good service and delicious food. It is also worth noting that restaurant concept is also important, because it defines target audience and influences the menu.
This diagram represents the floor plan of an ongoing sports-theme establishment - restaurant, cafe, or other food service. A number of widescreen monitors installed along the perimeter provide visitors the opportunity to follow the course of a match from anywhere in the dining room of restaurant or cafe. The most of sports fans believe that food and alcohol is a big part of any sports show. That is why the dining room takes the most space - almost 60% of the total establishment space. Nearly all sports fans consume beverages while watching sports - beer, soda or water at least. Thus, the restaurant floor plan designers added a large lavatory there. Moreover, project developers considered unnecessary the gender division of such delicate place - perhaps they guess that only men are watching football, or believe that alcohol will eliminate the most of gender differences.
Picture: How To Create Restaurant Floor Plan in Minutes
Related Solution:
If neither of 45 vector shapes of the Cross-Functional Flowcharts solution don't fit your needs, you will want to learn How to create a unique Cross-Functional flowchart.
ConceptDraw Arrows10 Technology - This is more than enough versatility to draw any type of diagram with any degree of complexity.
Drawing software lets you to make horizontal and vertical, audit, opportunity and many more flowcharts.
Picture: How to Create a Cross Functional Flow Chart
There are many tools to manage a process or to illustrate an algorithm or a workflow. Flowcharting is one of those tools. However, it may be difficult to show complex processes that require multiple attributes or several people in a simple flowchart, so a cross-functional flowchart would be a solution for that situation. To create such flowchart, group processes and steps to labeled rows or columns, and divide those groups with horizontal or vertical parallel lines. It is worth mentioning that there are different types of cross-functional flowcharts, like opportunity or deployment flowchart.
This diagram shows a cross-functional flowchart that was made for a trading process. It contains 14 processes, distributed through 5 lines depicting the participants who interact with the process. Also there are connectors that show the data flow of information between processes. The cross-functional flowchart displays a detailed model of the trading process, as well as all participants in the process and how they interact with each other. The lines in the flowchart indicates the position, department and role of the trading process participants.
Picture: Cross-Functional Flowchart
Related Solution:
Two types of diagrams are used in UML: Structure Diagrams and Behavior Diagrams. Behavior Diagrams represent the processes proceeding in a modeled environment. Structure Diagrams represent the elements that compose the system.
Picture: UML Diagram Types List
Related Solution:
ConceptDraw Word Exchange solution gives you the ability to export mind maps to MS Word. It also allows stylizing the resulting document by using a custom MS Word template.
Picture: Export from ConceptDraw MINDMAP into MS Word Document
