How to Create a Process Flowchart
Use the ConceptDraw DIAGRAM
The ConceptDraw DIAGRAM is a Process Flowcharts software. This software includes basic package of the samples and templates. The object libraries contain vector stencils that allow you to use RapidDraw technology. By the clicking on direction arrows one can add a new object to flowcharts.

Sample 1. Flowchart sample: Synthetic object.
This example flowchart visualizes process of 3-D construction of synthetic actor object.
Use ConceptDraw DIAGRAM diagramming and vector graphics software to visually model your own IT construction processes.
See also Samples:
TEN RELATED HOW TO's:
UML Timing Diagram as special form of a sequence diagram are used to explore the behaviors of objects throughout a given period of time.
Picture: Diagramming Software for Design UML Timing Diagrams
The SWOT Analysis solution contains easy-to-use mind map templates that help identify Strengths, Weaknesses, Opportunities, and Threats, as well as outputs to ConceptDraw DIAGRAM for presenting analysis results.
Picture: SWOT Analysis
Related Solution:
Job duties in small companies are usually spread randomly among workers, causing lots of problems and misunderstanding. One of the ways to restore order in business processing is to create a cross-functional flowchart with swim lanes that would represent every step in production system. Another advantage of using swim lanes flowchart is that it represents not only processes, but people responsible for them.
Swim lane diagram is a kind of a process flow diagram. Its special feature is that it joins the features of process flow diagrams with organizational charts. Thus, a swim lane diagram display a participant of the business process in a conjunction with general flow of the business system. A swim lane diagram is looks similar to a swimming pool's lanes. Lanes can be horizontal and vertical. The lanes are pointed out relatively to resource name, which is assigned on implementation of the given part of the business process. ConceptDraw Business Process Mapping solution delivers the ability to design develop swim lanes flowcharts using the vector graphic objects of Swim Lanes library.
Picture: Swim Lane Diagrams
Related Solution:
This sample shows the Spider Chart that represents the budget and spending for one organization and allows to compare them. The multivariate data are represented on the Spider Chart as a two-dimensional chart with four or more variables displayed on the axes that start in one point. The Spider Charts are used in the management, business and sport.
Picture: Spider Chart Template
These donut chart templates was designed using ConceptDraw DIAGRAM diagramming and vector drawing software extended with Pie Charts solution from Graphs and Charts area of ConceptDraw Solution Park.
All these donut chart templates are included in the Pie Charts solution.
You can quickly rework these examples into your own charts by simply changing displayed data, title and legend texts.
Picture: Donut Chart Templates
Related Solution:
ConceptDraw DIAGRAM diagramming and vector drawing software extended with Seven Basic Tools of Quality solution from the Quality area of ConceptDraw Solution Park provides effective tools for quality control and helps design any types of quality-related diagrams.
Picture: Seven Basic Tools of Quality — Quality Control
Related Solution:
When thinking about data visualization, one of the first tools that comes to mind is a flowchart design. You can find flowchart symbols, shapes, stencils and icons easily on the Internet, but it might take time to systematize this information. Nevertheless, once you start flowcharting, you’ll love its simplicity and efficiency.
This diagram consists from standard flowchart symbols, approved by ANSI (American National Standard Institute) for drawing flowcharts. A flowchart is a diagram that represents a step-by-step algorithm of any process, displaying the process stages as boxes that are connected with arrows. Flowchart design makes it clear and readable.
Flowchart designed using ConceptDraw DIAGRAM flowchart software allows to make attractive and clear process presentation, it makes interpretation of the business process flow fresh and versatile. Great flowchart design view is a big advantage over the diagram created manually on a paper.
Picture: Flowchart Design: Principles, Layout, Symbols and Best Practices
Related Solution:
Bubble diagrams solution extends ConceptDraw DIAGRAM software with templates, Using ConceptDraw Connectors, you can create a bubble chart in moments.
Using ConceptDraw you will be able to create a bubble chart from the ready ConceptDraw library objects or make your own objects. The created diagram can represent ideas organization, in brainstorming processes, by teachers for explaining difficult ideas or for presentations.
Picture: How To Create a Bubble Chart
Related Solution:
Have you ever wanted to start your own cafe? To imagine any possible options, try Cafe Floor Plan Design Software now for free 21 day trial. This will allow you to use all the ConceptDraw DIAGRAM main features.
Here is an example of a multi-page document consisting from the various options of interior design and plans for arranging a cafe. This document can be used as a basis for the development of a professional designer portfolio. It was drawn using ConceptDraw Cafe and Restaurant Plans solution. The solution supplies vector libraries, templates and samples that are released to assist amateurs and professionals to draw the i designs of interior and furniture layouts of the cafe hall and lobby.
Picture: How to create Cafe Floor Plan Design
Related Solution:
Variable delay elements are often used to manipulate the rising or falling edges of the clock or any other signal in integrated circuits. Delay elements are also used in delay locked loops and in defining a time reference for the movement of data within those systems.
26 libraries of the Electrical Engineering Solution of ConceptDraw DIAGRAM make your electrical diagramming simple, efficient, and effective. You can simply and quickly drop the ready-to-use objects from libraries into your document to create the electrical diagram.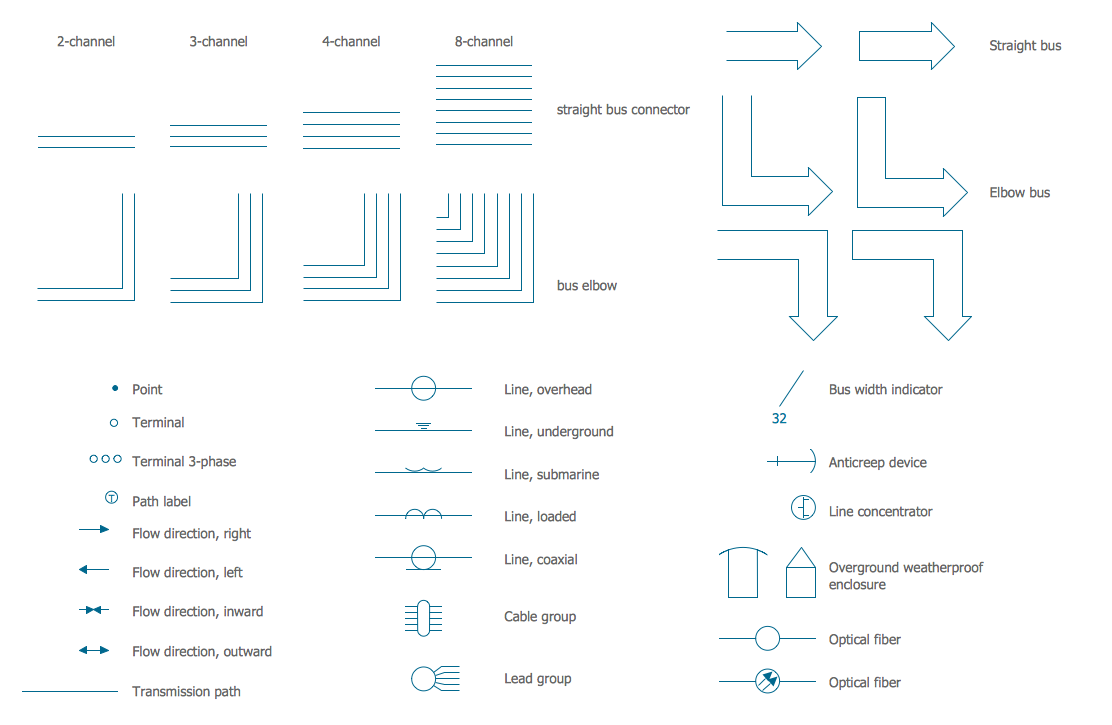
Picture: Electrical Symbols — Transmission Paths
Related Solution:
ConceptDraw
DIAGRAM 18