Quality Project Management with Mind Maps
ConceptDraw MINDMAP with the new Quality MindMap solution is a perfect addition to quality visualization in your company. Once a quality problem is identified, mind maps can be of great value in depicting and describing a problem in detail, then structure it, and find the right decision. The visual form of mind maps is helpful in all stages of quality management, from describing problem to describing and documenting a decision.
Pic.1 Mindmap template - Problem to be solved.
Mind maps can be of great value in depicting and describing a problem in detail, then structure it, and find the right decision. The visual form of mind maps is helpful in all stages of quality management, from describing problem to describing and documenting a decision.
See also Samples:
TEN RELATED HOW TO's:
ConceptDraw is a best data visualization tool that will allow everyone to create rich infographics and visualizations quickly and easily.
Picture: Best Tool for Infographic Construction
To launch Projects Exchanging Mind Maps with Evernote using ConceptDraw MINDMAP simply and easily.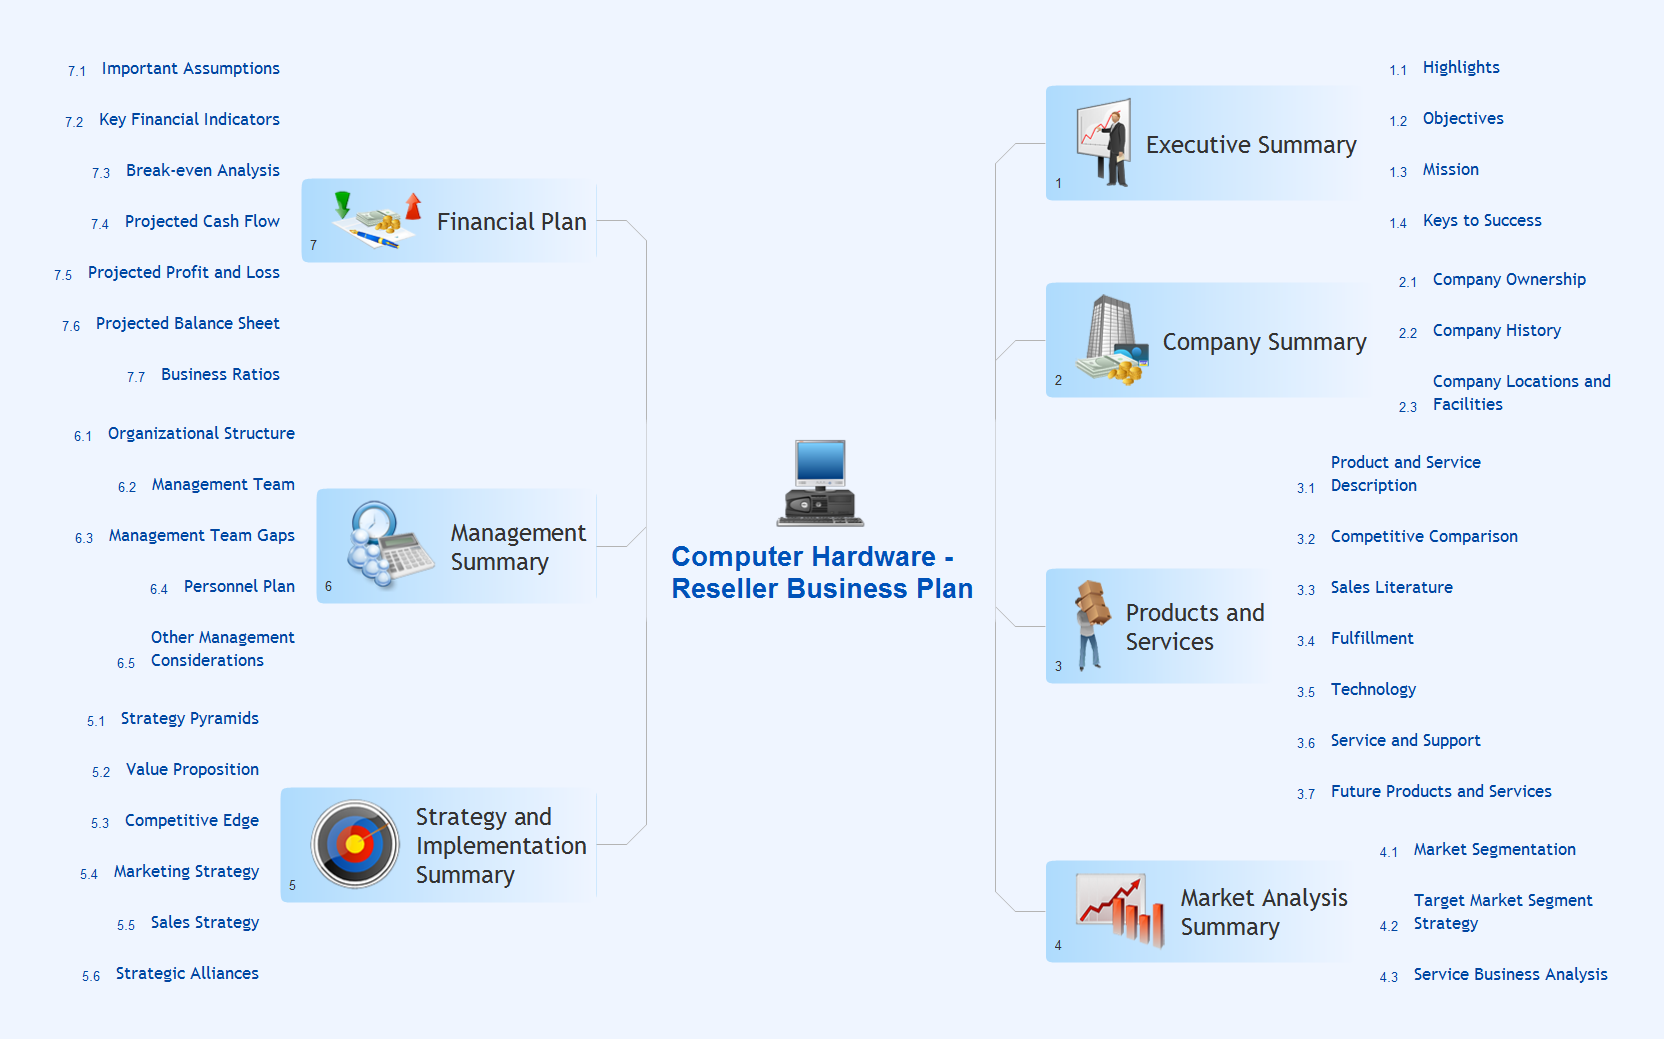
Picture: Launch Projects Exchanging Mind Maps with Evernote
Related Solution:
ConceptDraw Quality MindMap solution is a perfect additional tool for the quality team of your organization.
Picture: Quality issues in heir organization
Related Solution:
MindMap Presentation via Skype, brainstorming and organizing ideas. Create and present Mind Maps using software.
The presentation via Skype conference call is part of solution Remote Presentation for Skype - from ConceptDraw Solution Park. It let presenter to control over the slide-show process which plays on each computer of conference call participants synchronously.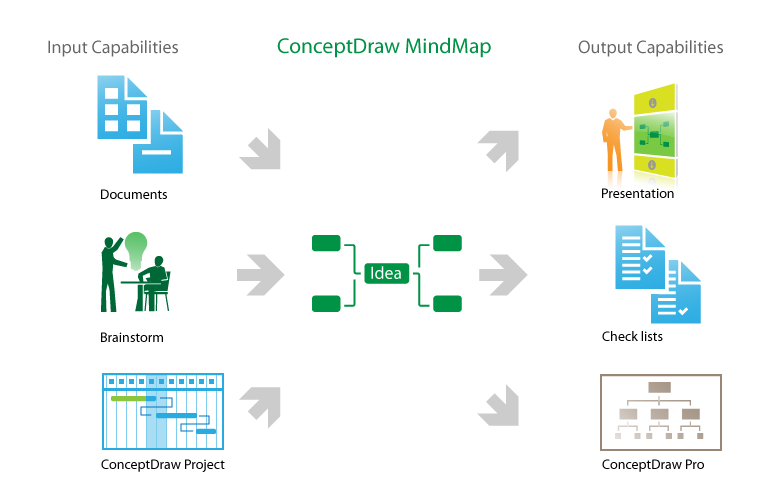
Picture: How to make great presentation via Skype? ...how it works with ConceptDraw MINDMAP?
Related Solution:
Collaboration tool for project management enables you to give a new role to knowledge management and document sharing within your team.
Picture: How To Use Collaboration Tool in Project Management
Related Solution:
ConceptDraw PROJECT is simple project management software for planning projects, it include tools for planning project objectives. This type of project planning software intended for professional who use project terms daily. CoonceptDraw PROJECT can be used as customer project management software to keep on track on-site operations. It often used for planning marketing activity as marketing project management software, also it used as simple project management software for software development projects.
Picture: ConceptDraw PROJECT Project Management Software Tool
Using mind mapping for quality management is a creative approach that allows one to structure all key quality points on the one page.
Picture: Quality Control
Related Solution:
ConceptDraw MINDMAP is the most productive tool you can use to solve problems and generate yout great ideas.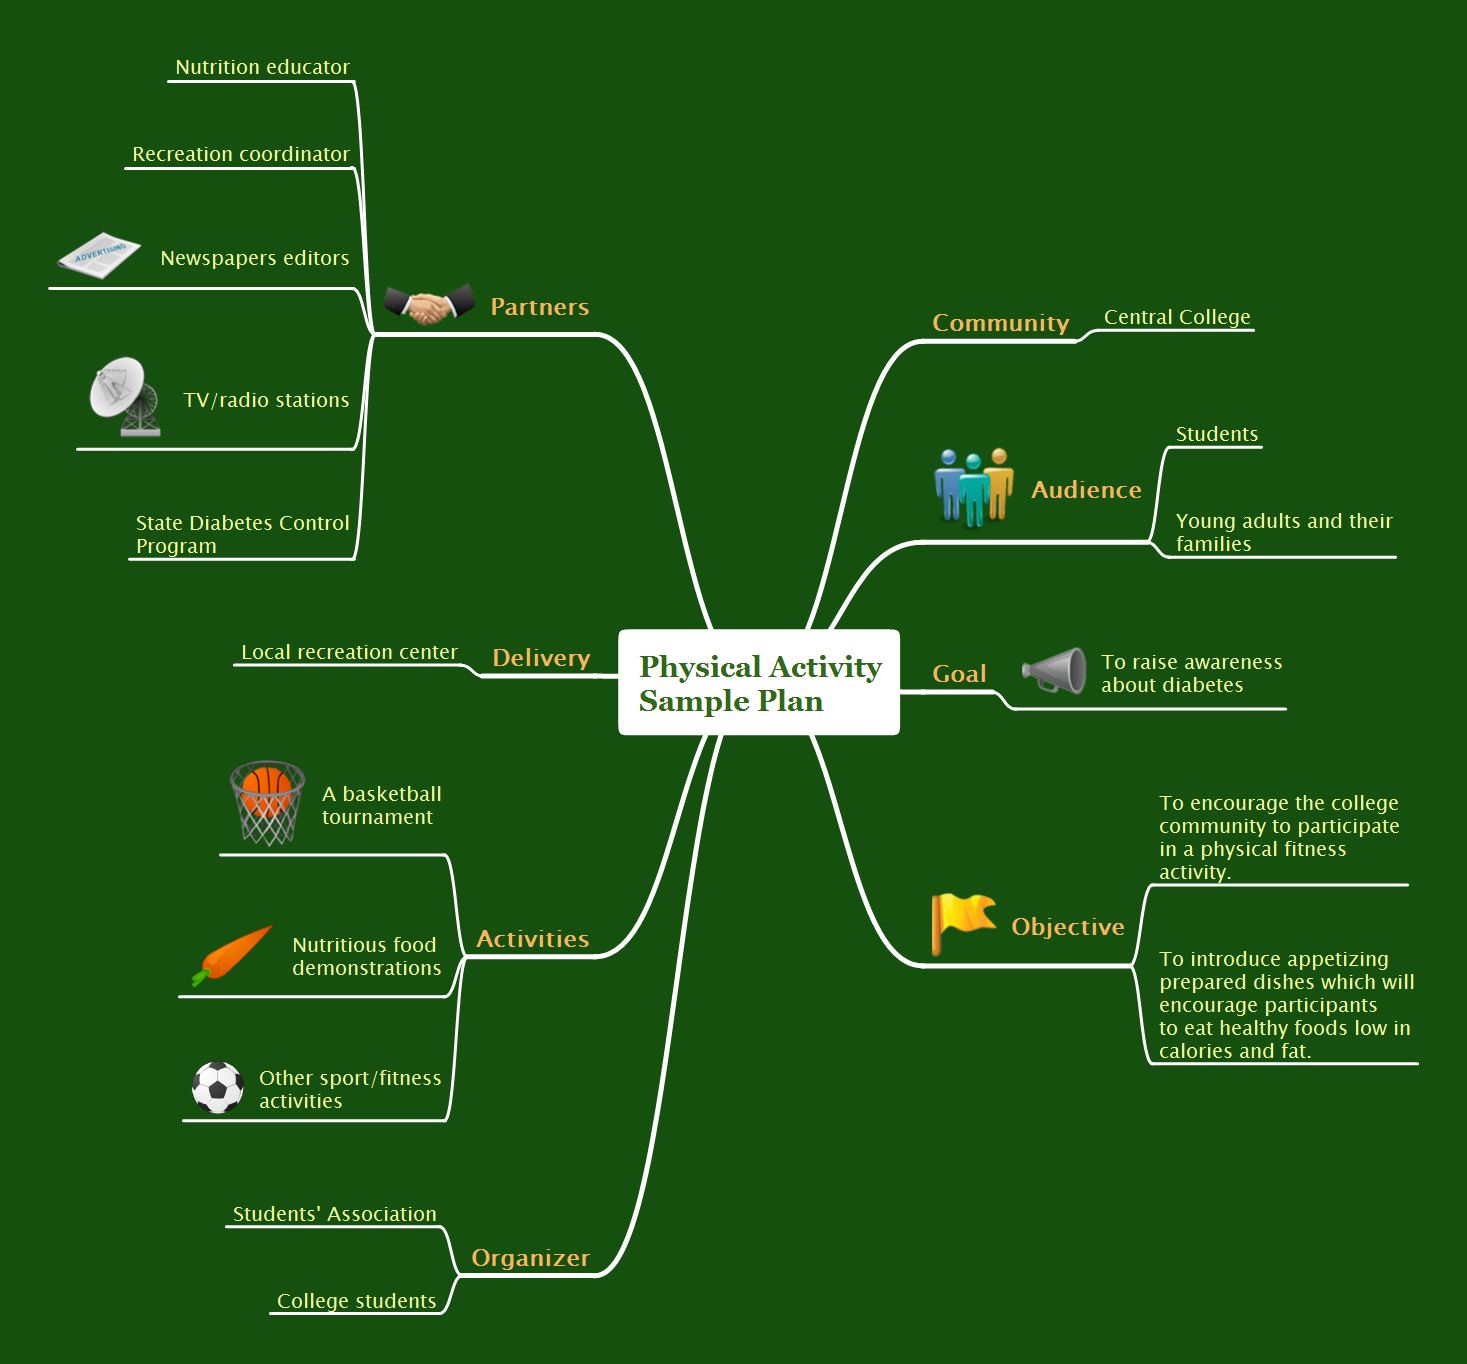
Picture: Professional & Powerful Mind Mapping Software
Related Solution:
When strategy manager deals with planning a strategy statements for the some upcoming period commonly he use a SWOT matrix to analyse. Filling the four sectioned matrix, helps manager to determine what external and internal factors are influenced on the company's position at the market. And where hidden potential opportunities and threats. Using mind map, made in ConceptDraw MINDMAP it is easy to capture all factors of influence. The next stage is turn a mind map into SWOT matrix with just one click by using the ConceptDraw solution for SWOT and TOWS diagrams.
Picture: SWOT analysis Software & Template for Macintosh and Windows
Visio for Mac and Windows - ConceptDraw as an alternative to MS Visio. ConceptDraw DIAGRAM delivers full-functioned alternative to MS Visio. ConceptDraw DIAGRAM supports import of Visio files. ConceptDraw DIAGRAM supports flowcharting, swimlane, orgchart, project chart, mind map, decision tree, cause and effect, charts and graphs, and many other diagram types.
Picture: Is ConceptDraw DIAGRAM an Alternative to Microsoft Visio?
ConceptDraw
MINDMAP 16