Flow Chart Example: Warehouse Flowchart
Introduction to Warehouse Flowcharts
Having your own warehouse you wonder how to adjust its work and to control its processes. Helpful in importing, exporting goods, wholesales, and transport businesses, warehouse flowcharts are always useful for sorting things out in logistics and not only. Storing goods in proper way and making sure they don’t get damaged or spoiled is always simple with the help of the flowcharts. Mark dates of expiry, mention where materials are, both raw and packing, and so on.
Warehouse Flowcharts are various diagrams that describe the warehousing and inventory management processes in the warehouses, raw materials, packing materials, spare parts, components or finished goods associated with agriculture, manufacturing, and production at some warehouse. In case you have to draw one, we can advise you to use ConceptDraw DIAGRAM where you can find already existing examples of flow chart warehouse, very useful for manufacturers, importers, exporters, wholesalers, transport businesses, customs, etc. — all those who are involved in a process of storing things in warehouses.
Get ensured how simple it is to use ConceptDraw DIAGRAM to make your own charts. Using examples you’ll make charts yourself with ease and in very short terms. Check the Diagrams area of ConceptDraw Solution Park to make your own flowcharts. As using the right software for making helpful diagrams means making right decisions, innit? Useful in production and logistics, ConceptDraw DIAGRAM is the one to help your businesses to prosper.
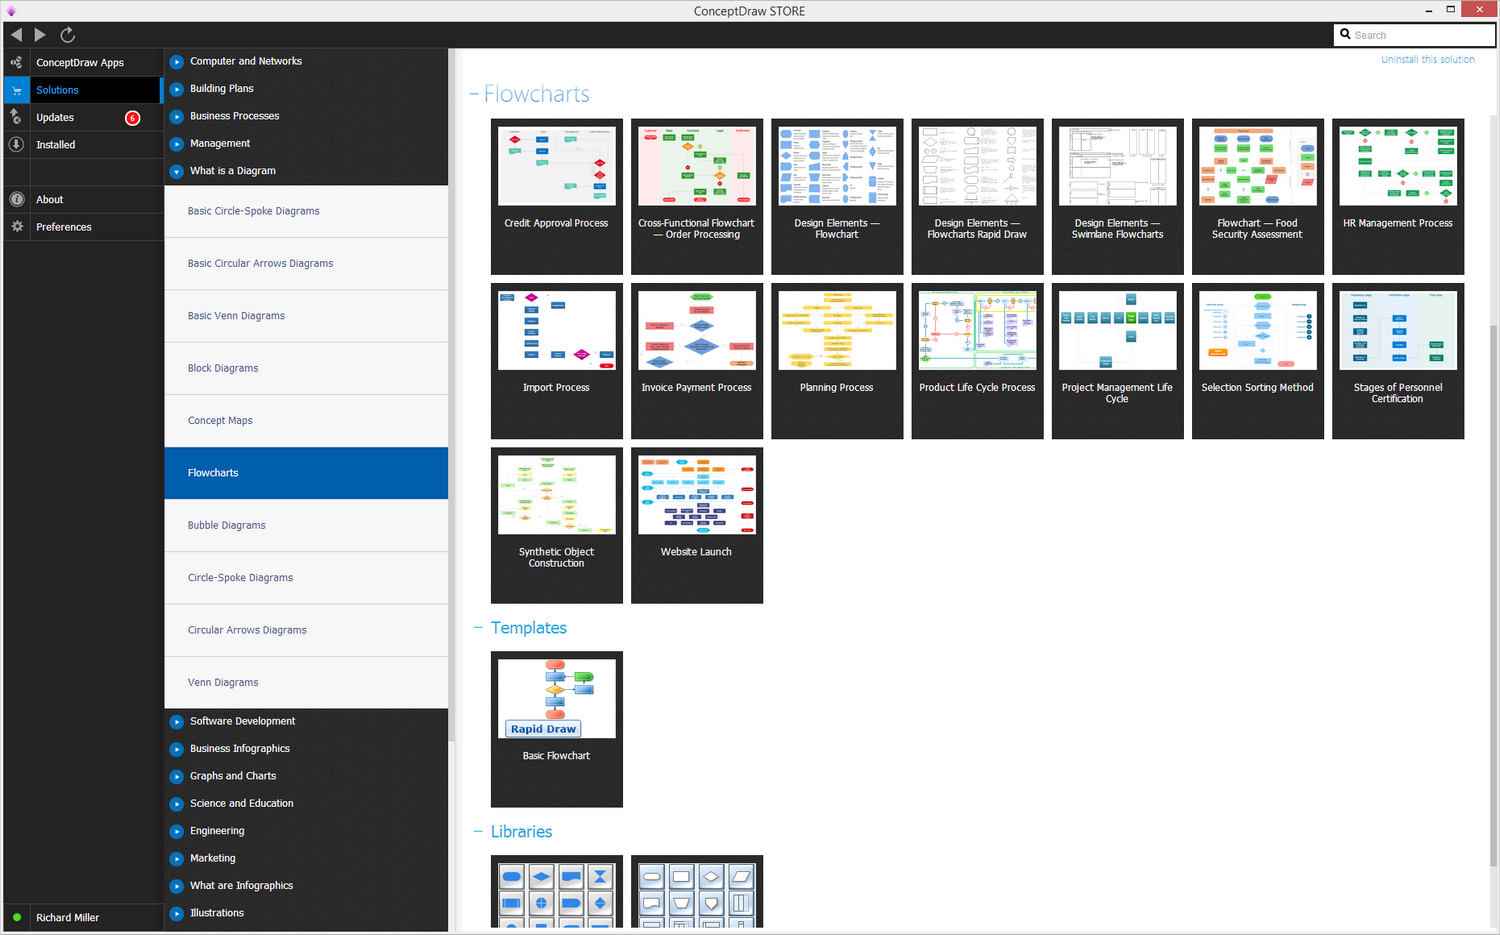
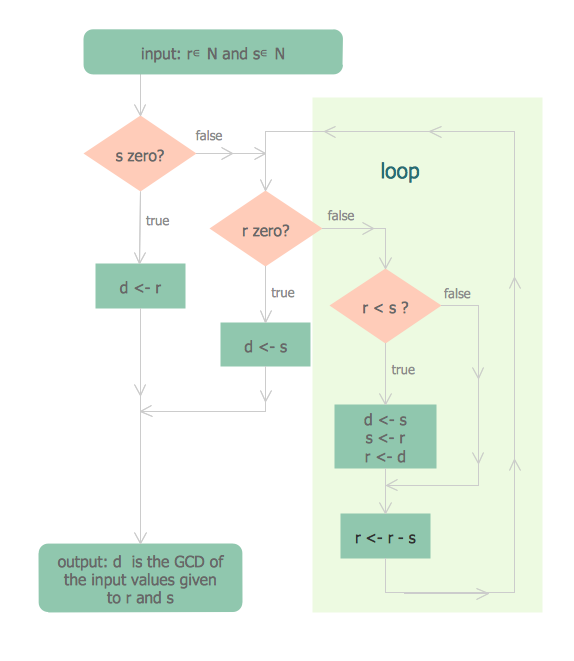
Example 1. Flowchart Solution
Common Warehouse Processes Mapped in Flowcharts
Having your own warehouse means having so many different things in it, which can be savory products, sweets, or other food you sell wholesale, or they can be the clothes you purchase from abroad, etc. Warehouses are meant to be used for storing very different things that in the end will appear at the market in order to be sold.
Warehouses are common for being used by manufacturers, importers, exporters, wholesalers, and customs and they are often a huge part of the logistics processes. In case some container of clothes has to be delivered from China, for example, to any of the European ports, it will go through customs clearance and it will end up staying at the warehouse until it is sold or transported to the other place: another warehouse or to the shop.
Warehouses are often used as a part of the big supermarkets. Once there was too much of something bought in advance and you cannot put all of it on the shelves, then you might want to keep the rest in the warehouse which is usually not very far from the supermarket itself or it is in the same building. In order to make the most profit from all that you sell, you have to keep an eye on what is left in the warehouse or make somebody else track it. Flowcharts help to map your warehouse processes and keep your warehouses under the control.
It is very important that everything you buy wholesale you sell in retail as it is the only way you can make lots of money. Wasting food and throwing what is left away from the warehouse means losing money as all that is in your warehouse was once bought and the money was spent on it, so you should try to sell as much as possible. To make it happen you can always make a discount for the products you want to get rid of and so those who want to buy these products can have special offers. Most customers love special offers, especially before big dates and big celebrations, such as Christmas, and so on. That is why it is so important to plan everything in advance and to buy as much as you think you can sell or to buy more before big holidays when people have lots of time for shopping.
Improving Warehouse Operations with Flowcharts
Marketing is a huge part of every successful business as well as using other tools for making sure that you make all of your plans and dreams come true. Thus, having all of the modern tools to use while leading your business is obligatory. Having the right software and applications to use is a huge part of doing your business. In order to track the products, clothes, and other goods from your warehouse and improve warehouse operations, you can use the warehouse flowcharts. Draw them in terms of fixing all important information and the processes that represent the flow of materials.
Typical purposes of Warehouse Flowcharts are evaluating warehouse performance, measuring efficiency of customer service and organizational performance. This type of Workflow diagrams can be used for identifying any disconnection between business activities and business objectives. They are effectively used by warehouse-related people and organizations, manufacturers, wholesalers, exporters, importers, transporters, and others.
Making such flowchart can be a quite complicated thing unless you have the right software flow diagram to use it in terms of making flowcharts. Using the best program to create flow chart, such as ConceptDraw DIAGRAM software is always convenient and it is one of the best applications which is well-known and widely used, especially for such kinds of businesses, where the flow of data, people, materials, and other objects has to be traced.

Example 2. Warehouse Flowchart
Benefits of Using Specialized Software for Creating a Warehouse Flowchart
ConceptDraw DIAGRAM software was developed by the team of professional IT specialists. It is the product of CS Odessa which is world widely used and quite popular nowadays. ConceptDraw DIAGRAM's popularity can be explained by this application being used with ConceptDraw STORE where a large choice of many different solutions is. Each of these solutions was created for being used by ConceptDraw DIAGRAM users for their needs and each of them can be applied in the different spheres of business activity.
The solutions include appropriate stencil libraries where the design elements for the certain purpose are. The stencil libraries are always full of the appropriate design symbols and also these solutions always include the appropriate examples of different charts, flowcharts, diagrams, schemes, and plans. Creating any chart or flowchart, plan or diagram using any of the needed solutions is always much simpler, faster, and more convenient. Using the Flowcharts solution for creating your own workflow diagrams and flow charts can be a very fun and entertaining process. The solution can be downloaded from the Diagrams area of ConceptDraw Solution Park or from ConceptDraw STORE.
The Process Flow Diagrams are meant to be helping to put the information as well as to track if some definite process is being carried out without any delays. Creating some process flow diagram or warehouse flowchart is never a problem as long as you have all you need, which is ConceptDraw DIAGRAM software and the correct solution to it. The workflows within some warehouse processes may be tracked in a way of such flowchart warehouse and such flowchart for warehouse processes can be made in only a couple of hours or even minutes for the expert user of ConceptDraw DIAGRAM. Having the previously created flowcharts which you can use as the drafts for your own flowcharts is always also a bonus.
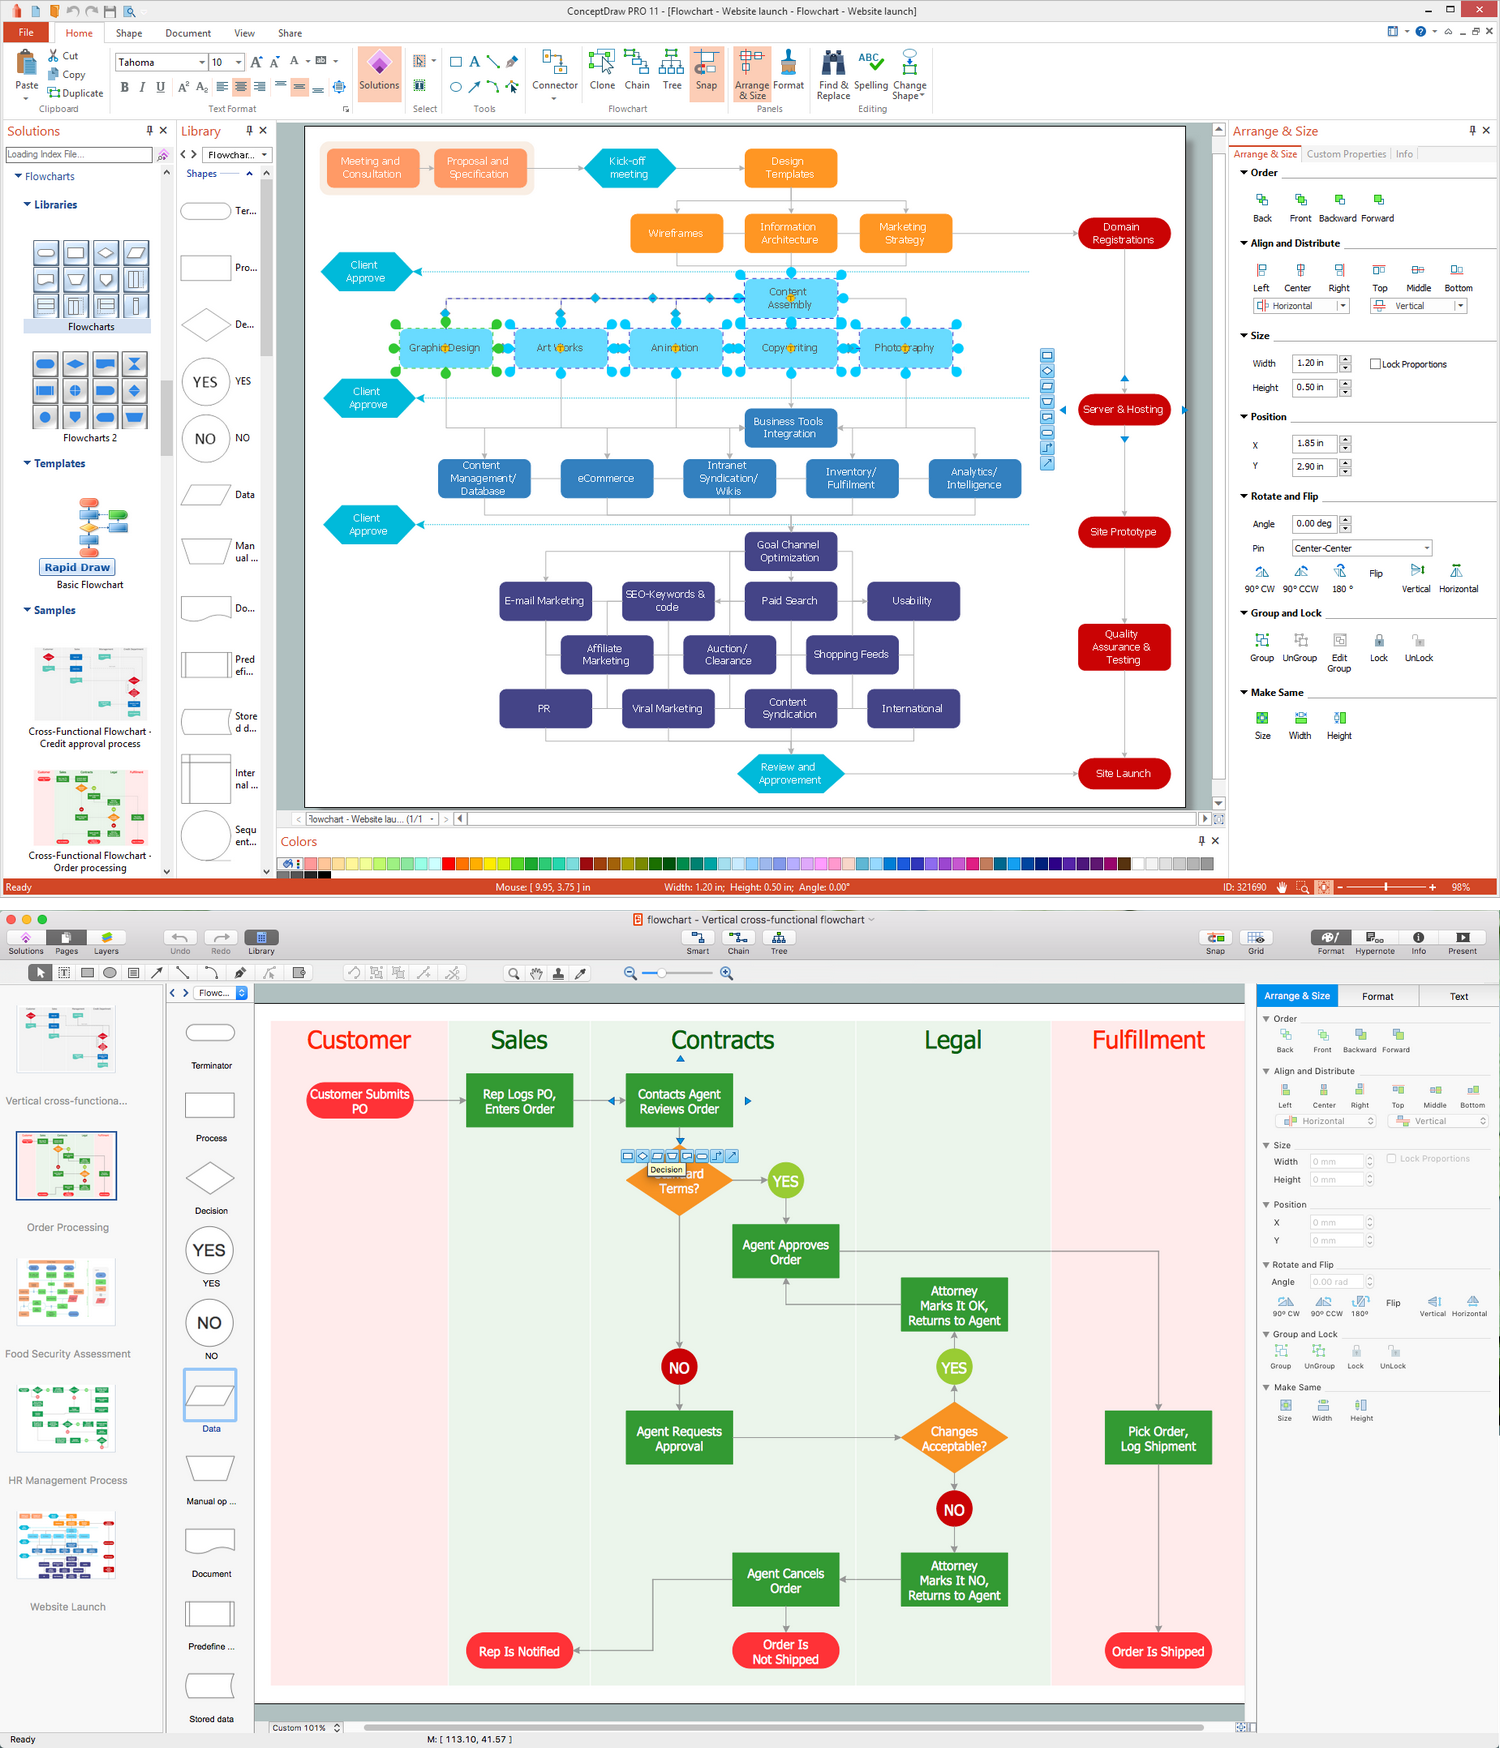
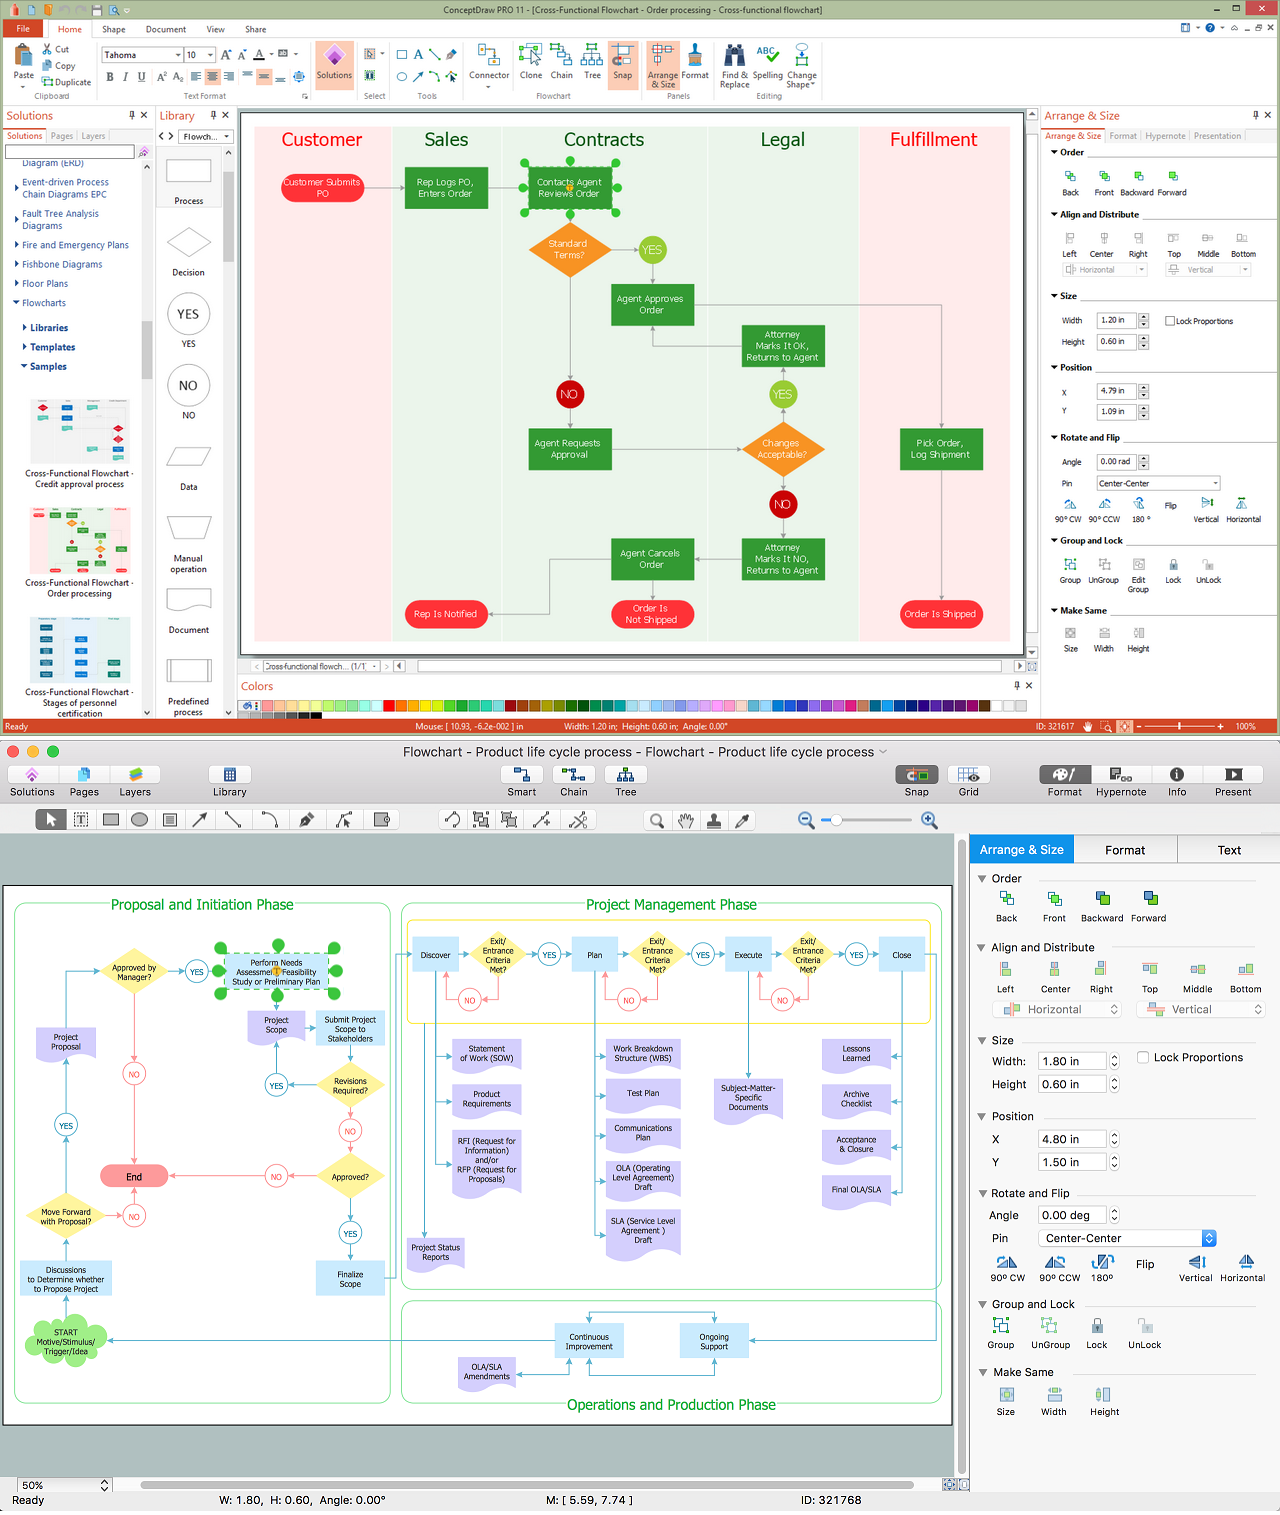
Example 3. Flow Chart Examples in ConceptDraw DIAGRAM
Warehouse Flowchart Examples
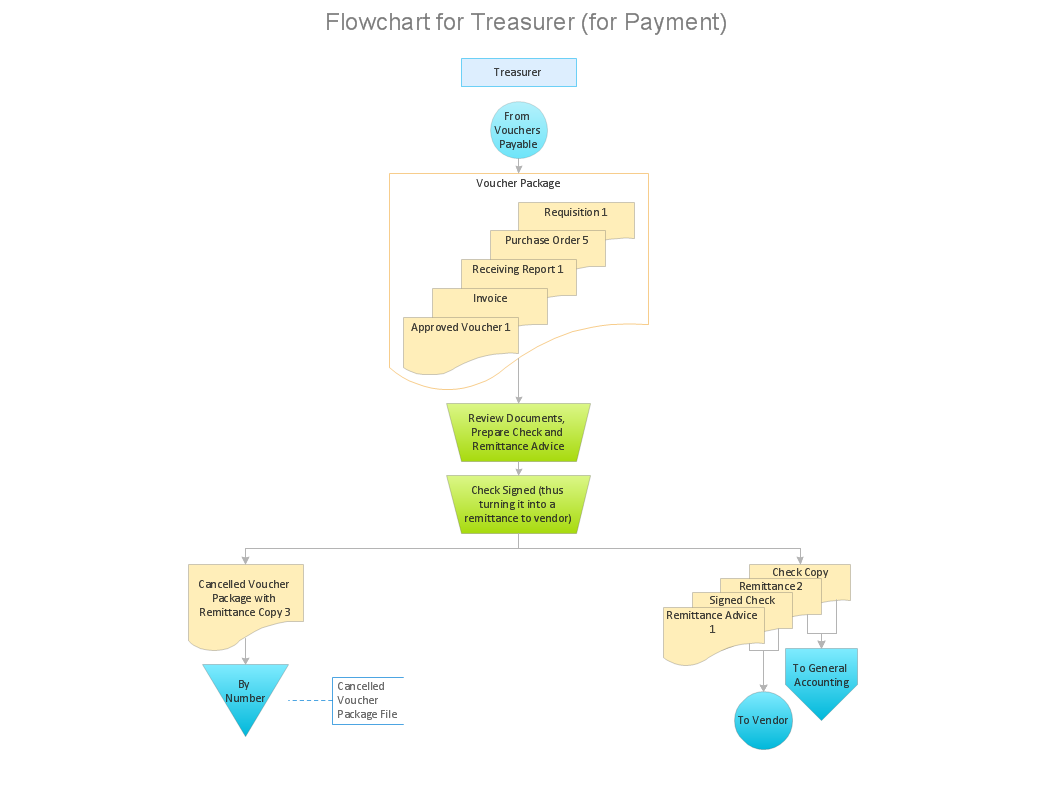
The examples of Warehouse workflow diagrams you see on this page show the sequence of operations and document transfer at the warehouses. This is a kind of workflow diagram used for warehousing process flow description. Start creating your own flow chart example with ConceptDraw DIAGRAM and accomplish great results in the moment.
Find some more examples of Warehouse flow chart diagrams and Warehouse workflow diagrams on this site or in the solution and make your own for tracking all of the business operations and document transfers within your own warehouse. Use the final workflow diagram for the warehousing process flow description and enjoy the result which will definitely look very professional and smart as long as you used ConceptDraw DIAGRAM business flowchart software to make it.
Once other people (your business partners, employees, or colleagues, for example) see the way you can use ConceptDraw DIAGRAM, they might want to get it as well for their use. So feel free to mention where to buy this amazing software and to use it in many different types of business activity.
Conclusion
Running your business, no matter if it is connected with agriculture, manufacturing, or production, storing your goods, whether they are some raw materials, packing materials, spare parts, components, or finished goods, and tracking them with the help of making warehouse flowcharts or storage flowchart using ConceptDraw DIAGRAM is the way to succeed in what you do.
Standard Warehousing process flow diagram and standard Workflow diagram are used for process identification for further evaluating effectiveness and profitability of overall business process. Use the ConceptDraw DIAGRAM vector graphic software extended with Flowcharts solution to design your own professional-looking Workflow diagrams and Flowcharts of any types, including the Warehouse flowchart, Process flow diagrams which depict in details all steps of Warehouse packages flow.