A full-featured project management solution with all the necessary functions right at your fingertips. Generates an extensive variety of reports on project and task statuses. Centralizes project information through embedded documents and hyperlinks. Unique Multiproject Dashboard manages multiple projects from a single file. Powerful integration with other ConceptDraw products makes project management easier than ever before.
Delivers a rich set of built-in functionalities and optional product extensions that support your daily workflow in time-saving and creative ways.
These videos provide a series of lessons that will enhance the understanding of all our users, from people just starting out with the software, through to expert users.
Separated into categories of Basic, Intermediate, and Advanced categories, the new instructional videos cover a huge breadth of topics. Users new to will find the Basic lessons an essential platform for familiarizing themselves with the ′s functions. Experienced users will benefit from the Intermediate and Advanced lessons, learning to take advantage of the program′s full capabilities and unlock its true potential.
contains an extensive tool set to help project managers. The rich data visualization capability that is provided by ConceptDraw products helps you create project dashboards, one-click reports, multi-project views, Gantt charts, and resource views.
Let′s learn how to get maximum value using !
Here′s some feedback from a customer:
"The documentation behind ConceptDraw Office 2, both online and via the Help system is clear and comprehensive. Also, Odessa is developing a robust set of video tutorials for its website. These are particularly well done and helpful. ...I′ve learned over the years that some of the best software for the Mac comes from the shores of the Black Sea. My compliments to your entire team there."
Ric Getter,Senior Editor,MacDirectory Magazine
Video. Lessons for Assigning Resources
Once you have scheduled tasks in your project, you will need to associate resources involved in the tasks’ completion. This will allow ConceptDraw Project to calculate costs related with those tasks. Also it will provide you with exact information about the usage of work resources, materials, or equipment. This will provide high accountability and understanding of the project as well.
That’s why it’s important to be mindful when assigning resources to tasks.
The behavior of worker in organization is influences organizational effectiveness. A simple block diagram made with ConceptDraw Block diagrams solution can improve the understanding of expectations of workers regarding what they l contribute to organization and what they wait to obtain. Making block diagram depicting the individual behavior in organization is used in HR management to obtain an optimal and positive overall contribution to the organization.
The behavior of worker in organization is influences organizational effectiveness. A simple block diagram made with ConceptDraw Block diagrams solution can improve the understanding of expectations of workers regarding what they l contribute to organization and what they wait to obtain. Making block diagram depicting the individual behavior in organization is used in HR management to obtain an optimal and positive overall contribution to the organization.
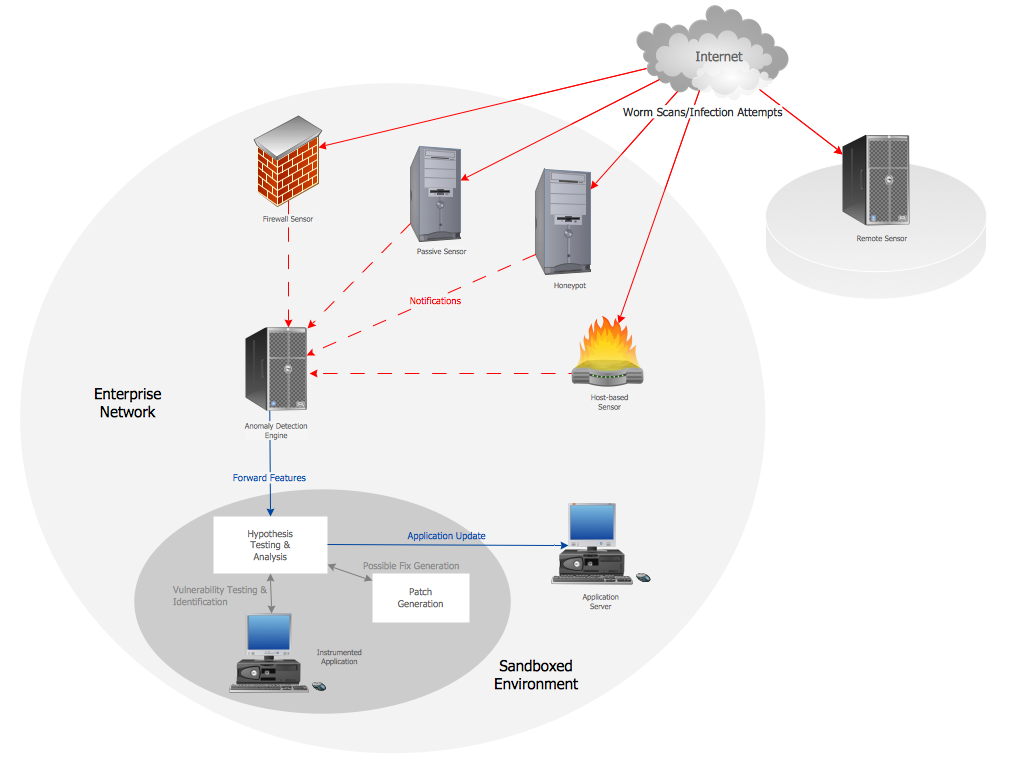
The network architecture and design specialization will help you gain the technical leadership skills you need to design and implement high-quality networks that support business needs.
Picture: Computer Network Architecture. Computer and Network Examples
This sample was created in ConceptDraw DIAGRAM diagramming and vector drawing software using the Line Graphs Solution from Graphs and Charts area of ConceptDraw Solution Park.
This sample shows the Line Chart of annual percentage change. The Line Chart allows you to clearly see the changes of data over the time.
If you need to describe some process, diagramming is a perfect tool for almost any imaginable purpose. The set of the most commonly used flow charts symbols is quite wide and includes symbols for operations, processes, data inputs and outputs. You can see the full list of all the symbols used for flowcharting in Flowcharts solution from Diagrams area in ConceptDraw Solution Park.
A flow chart is often used for visual representation of a sequential process flow. The flowchart approach to any process is to divide it into some sequential actions. What makes a flow chart so popular and clear to make out is the set of standard flowchart symbols that has the same reading independently from processes described with their applying. The current drawing represents the vector library containing the pack of standard flowchart symbols. This library is supplied with ConceptDraw Flowcharts solution.
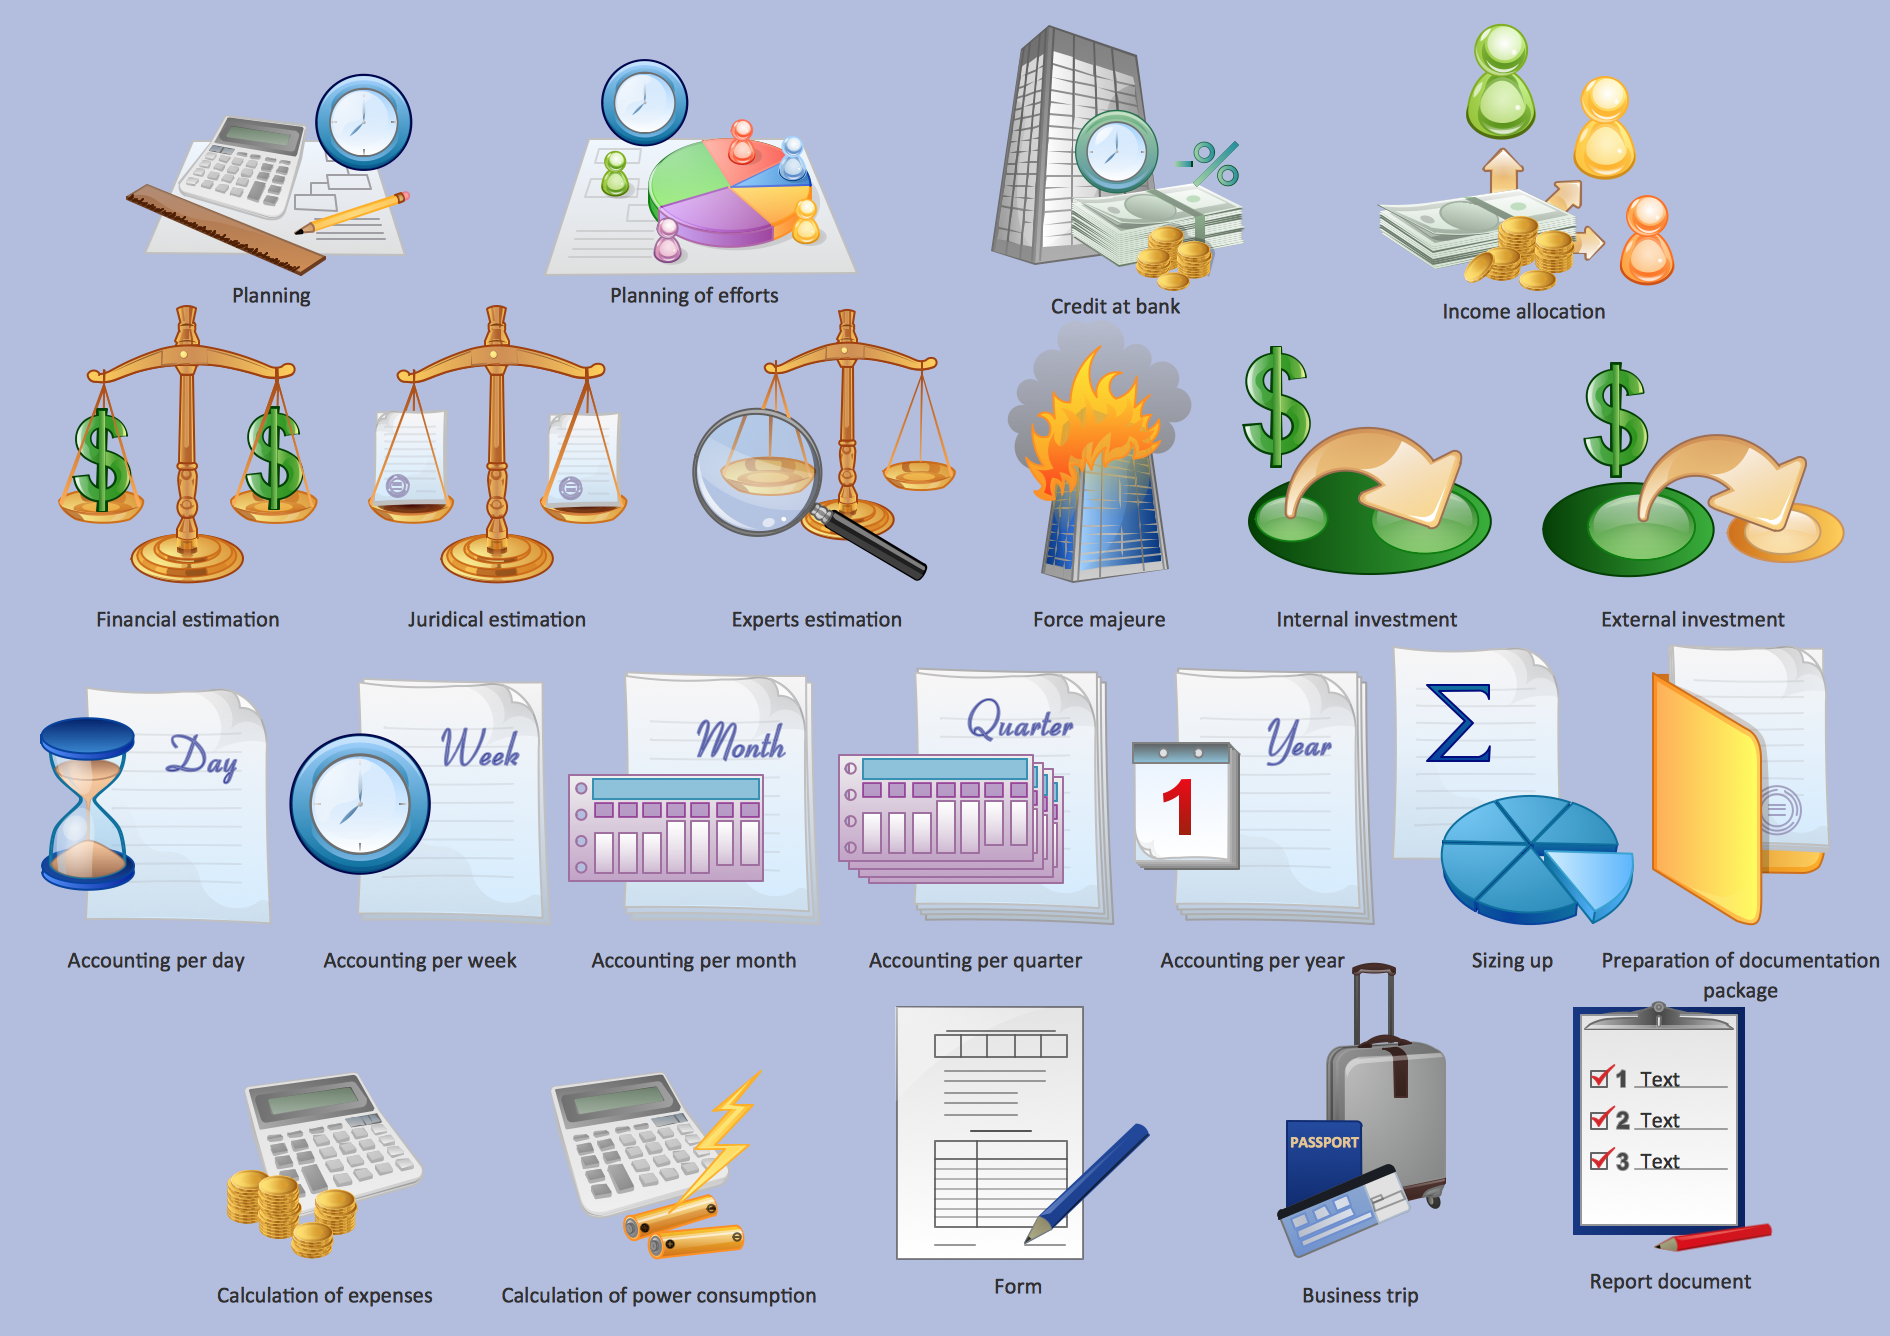
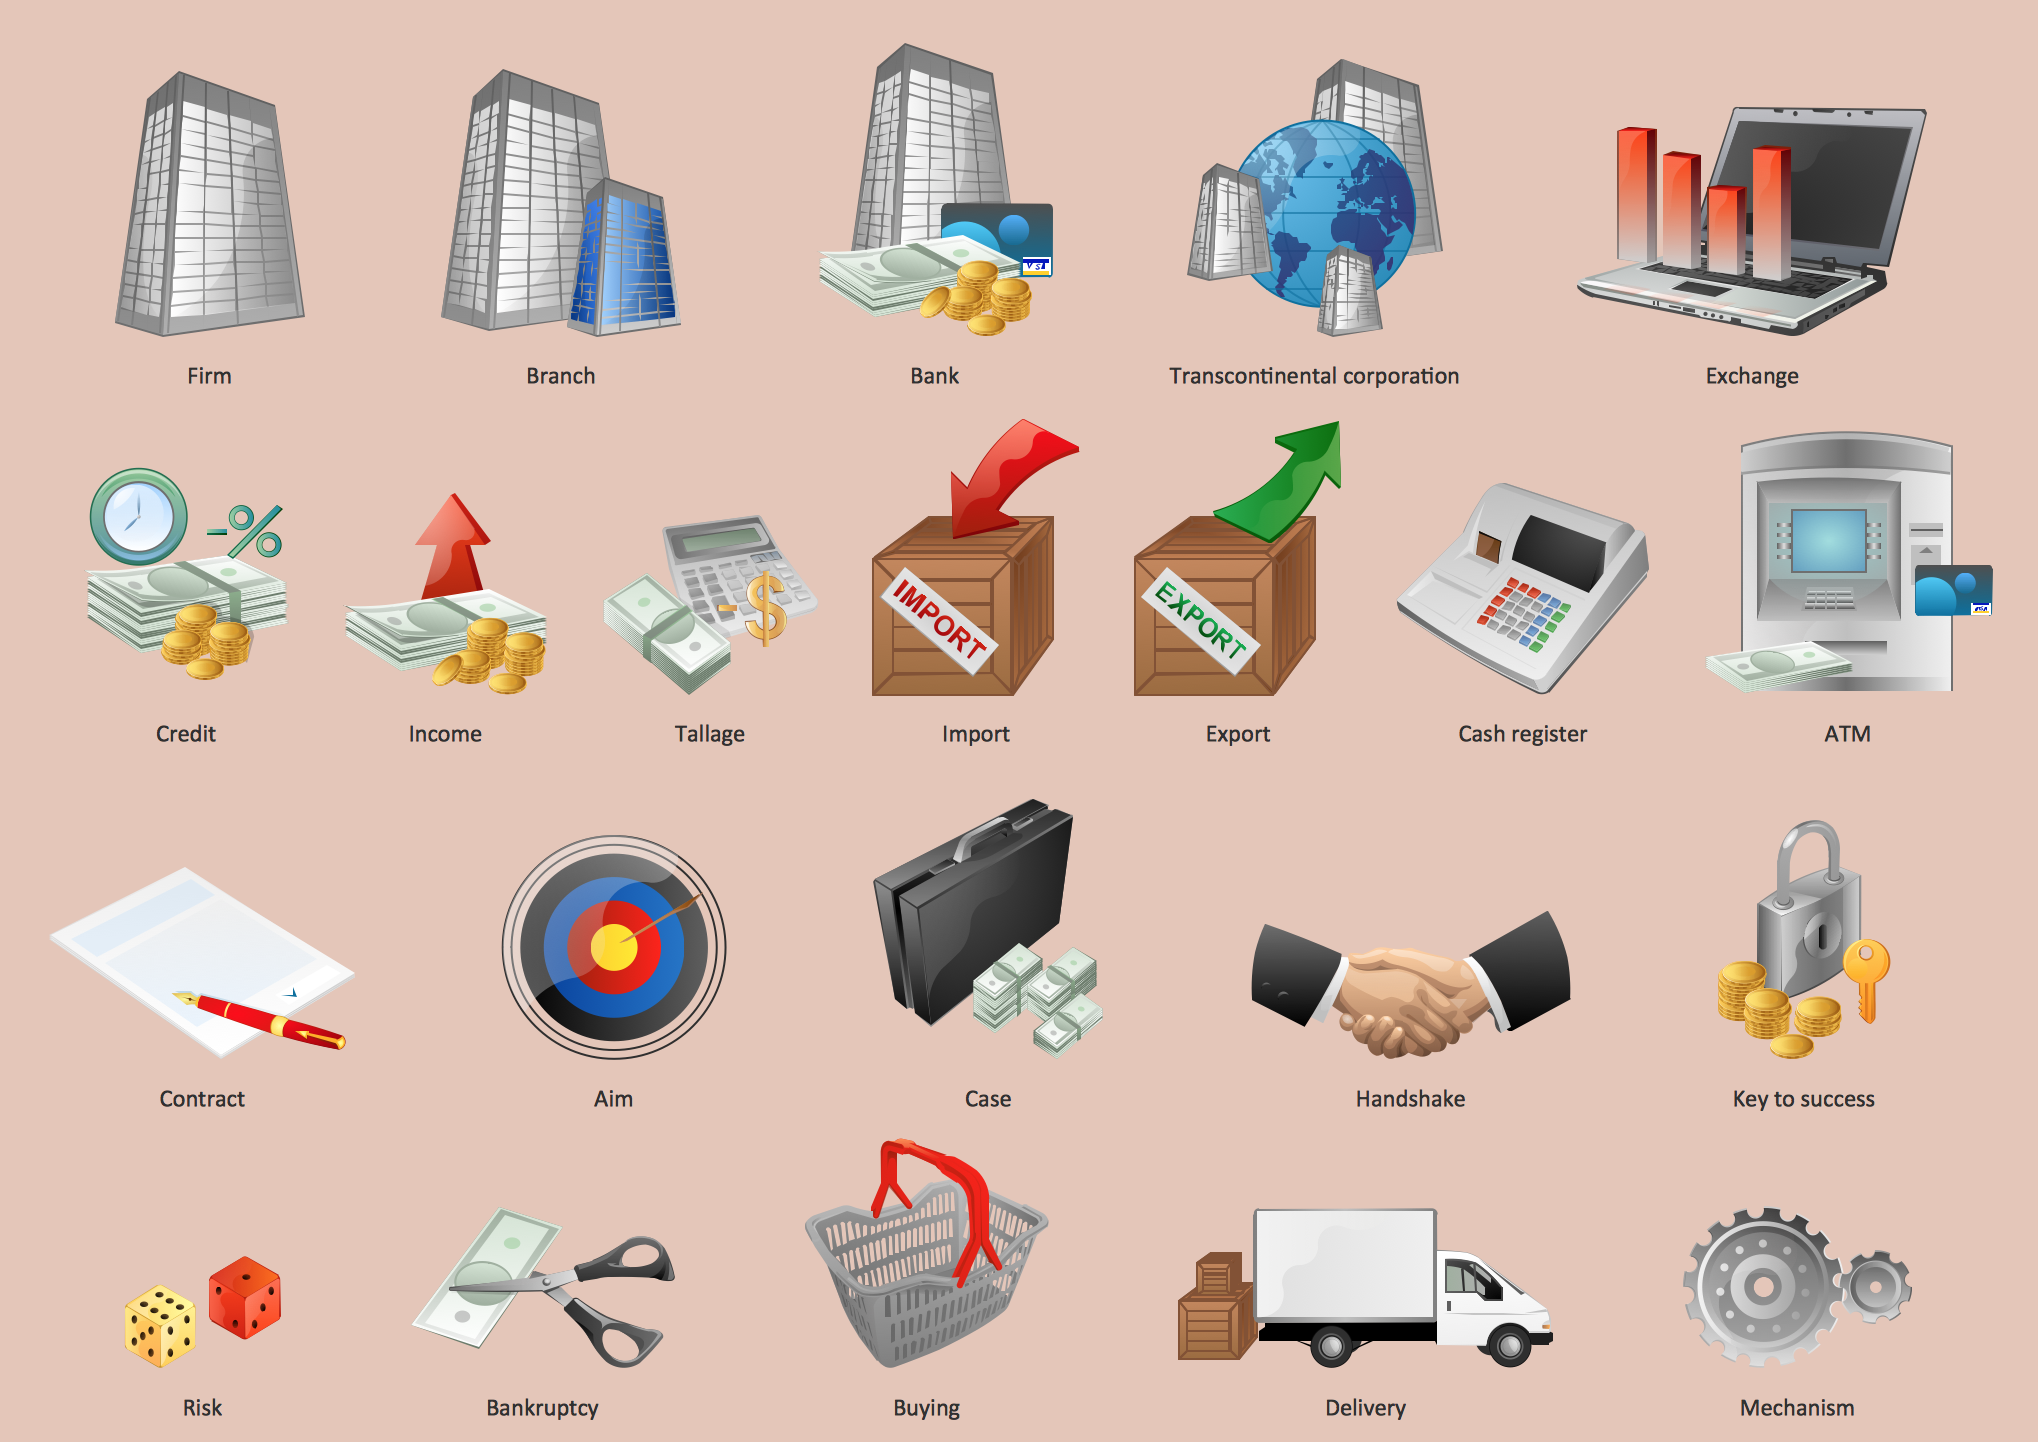
When you need to draw a professional management drawing, these management design elements, samples, templates and libraries with vector clip art for drawing the Marketing Illustrations. Conceptdraw symbols and signs you can use in your design for Strategic Management, Graphic Design, Planning implementation and more.
You can create and view impact analysis drawings from specific design elements to examine the tasks.
Choose which of business design elements you love best.
Design your own style with Business and Finance Solutions from ConceptDraw DIAGRAM.
We created a full set of elements, business samples, templates and libraries with vector clip art for drawing the Business Illustrations.
Mark your report or presentation, pay an attention of audience on your drawings with vector business design elements.
Connecting objects manually in ConceptDraw DIAGRAM is a snap:
- points;
- Connecting groups of objects;
- Auto-routing;
- Connectors text;
- Snap to Guides ;
- Quick.
This sample was created in ConceptDraw DIAGRAM diagramming and vector drawing software using the Seven Management and Planning Tools Solution from the Business Productivity area of ConceptDraw Solution Park.
This sample shows the Property Management matrix, the ideas are ordered in regards to importance and frequency. This matrix gives the ability to turn the theory into quantifiable data.
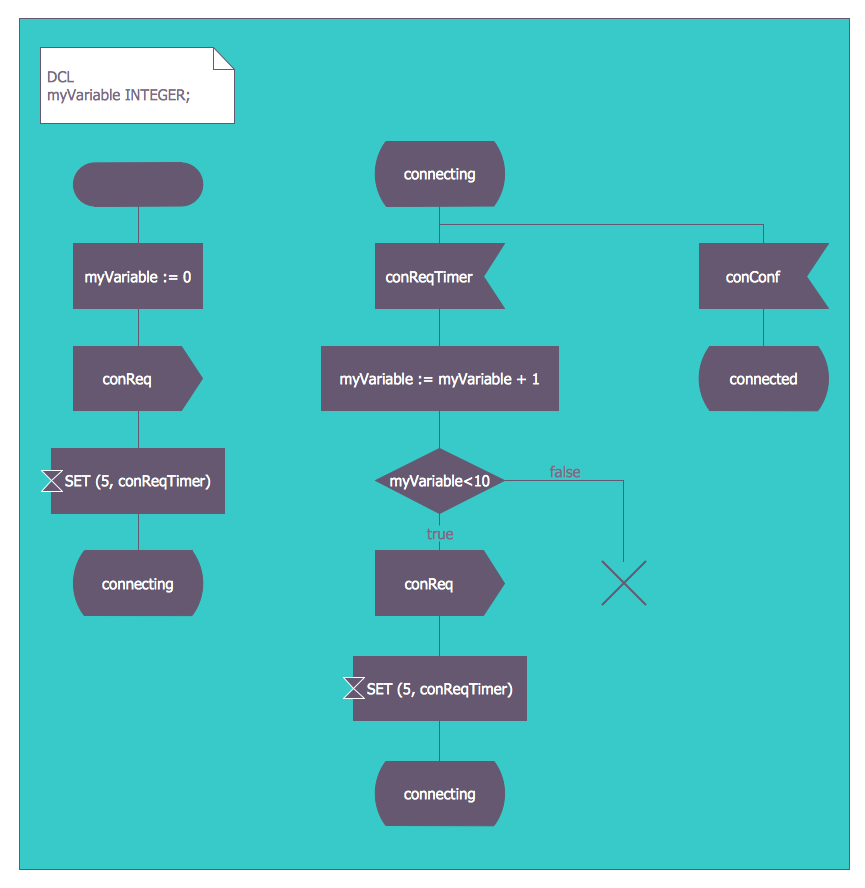
ConceptDraw DIAGRAM diagramming and vector drawing software extended with Specification and Description Language (SDL) Solution from the Industrial Engineering Area of ConceptDraw Solution Park provides powerful drawing tools for quick and easy creating well-designed FSM diagrams.