Marketing and Sales Organization chart.
Organization chart Example
Marketing and sales organization chart was created in ConceptDraw DIAGRAM diagramming and vector drawing software using the Organizational Charts solution from the Management area of ConceptDraw Solution Park.
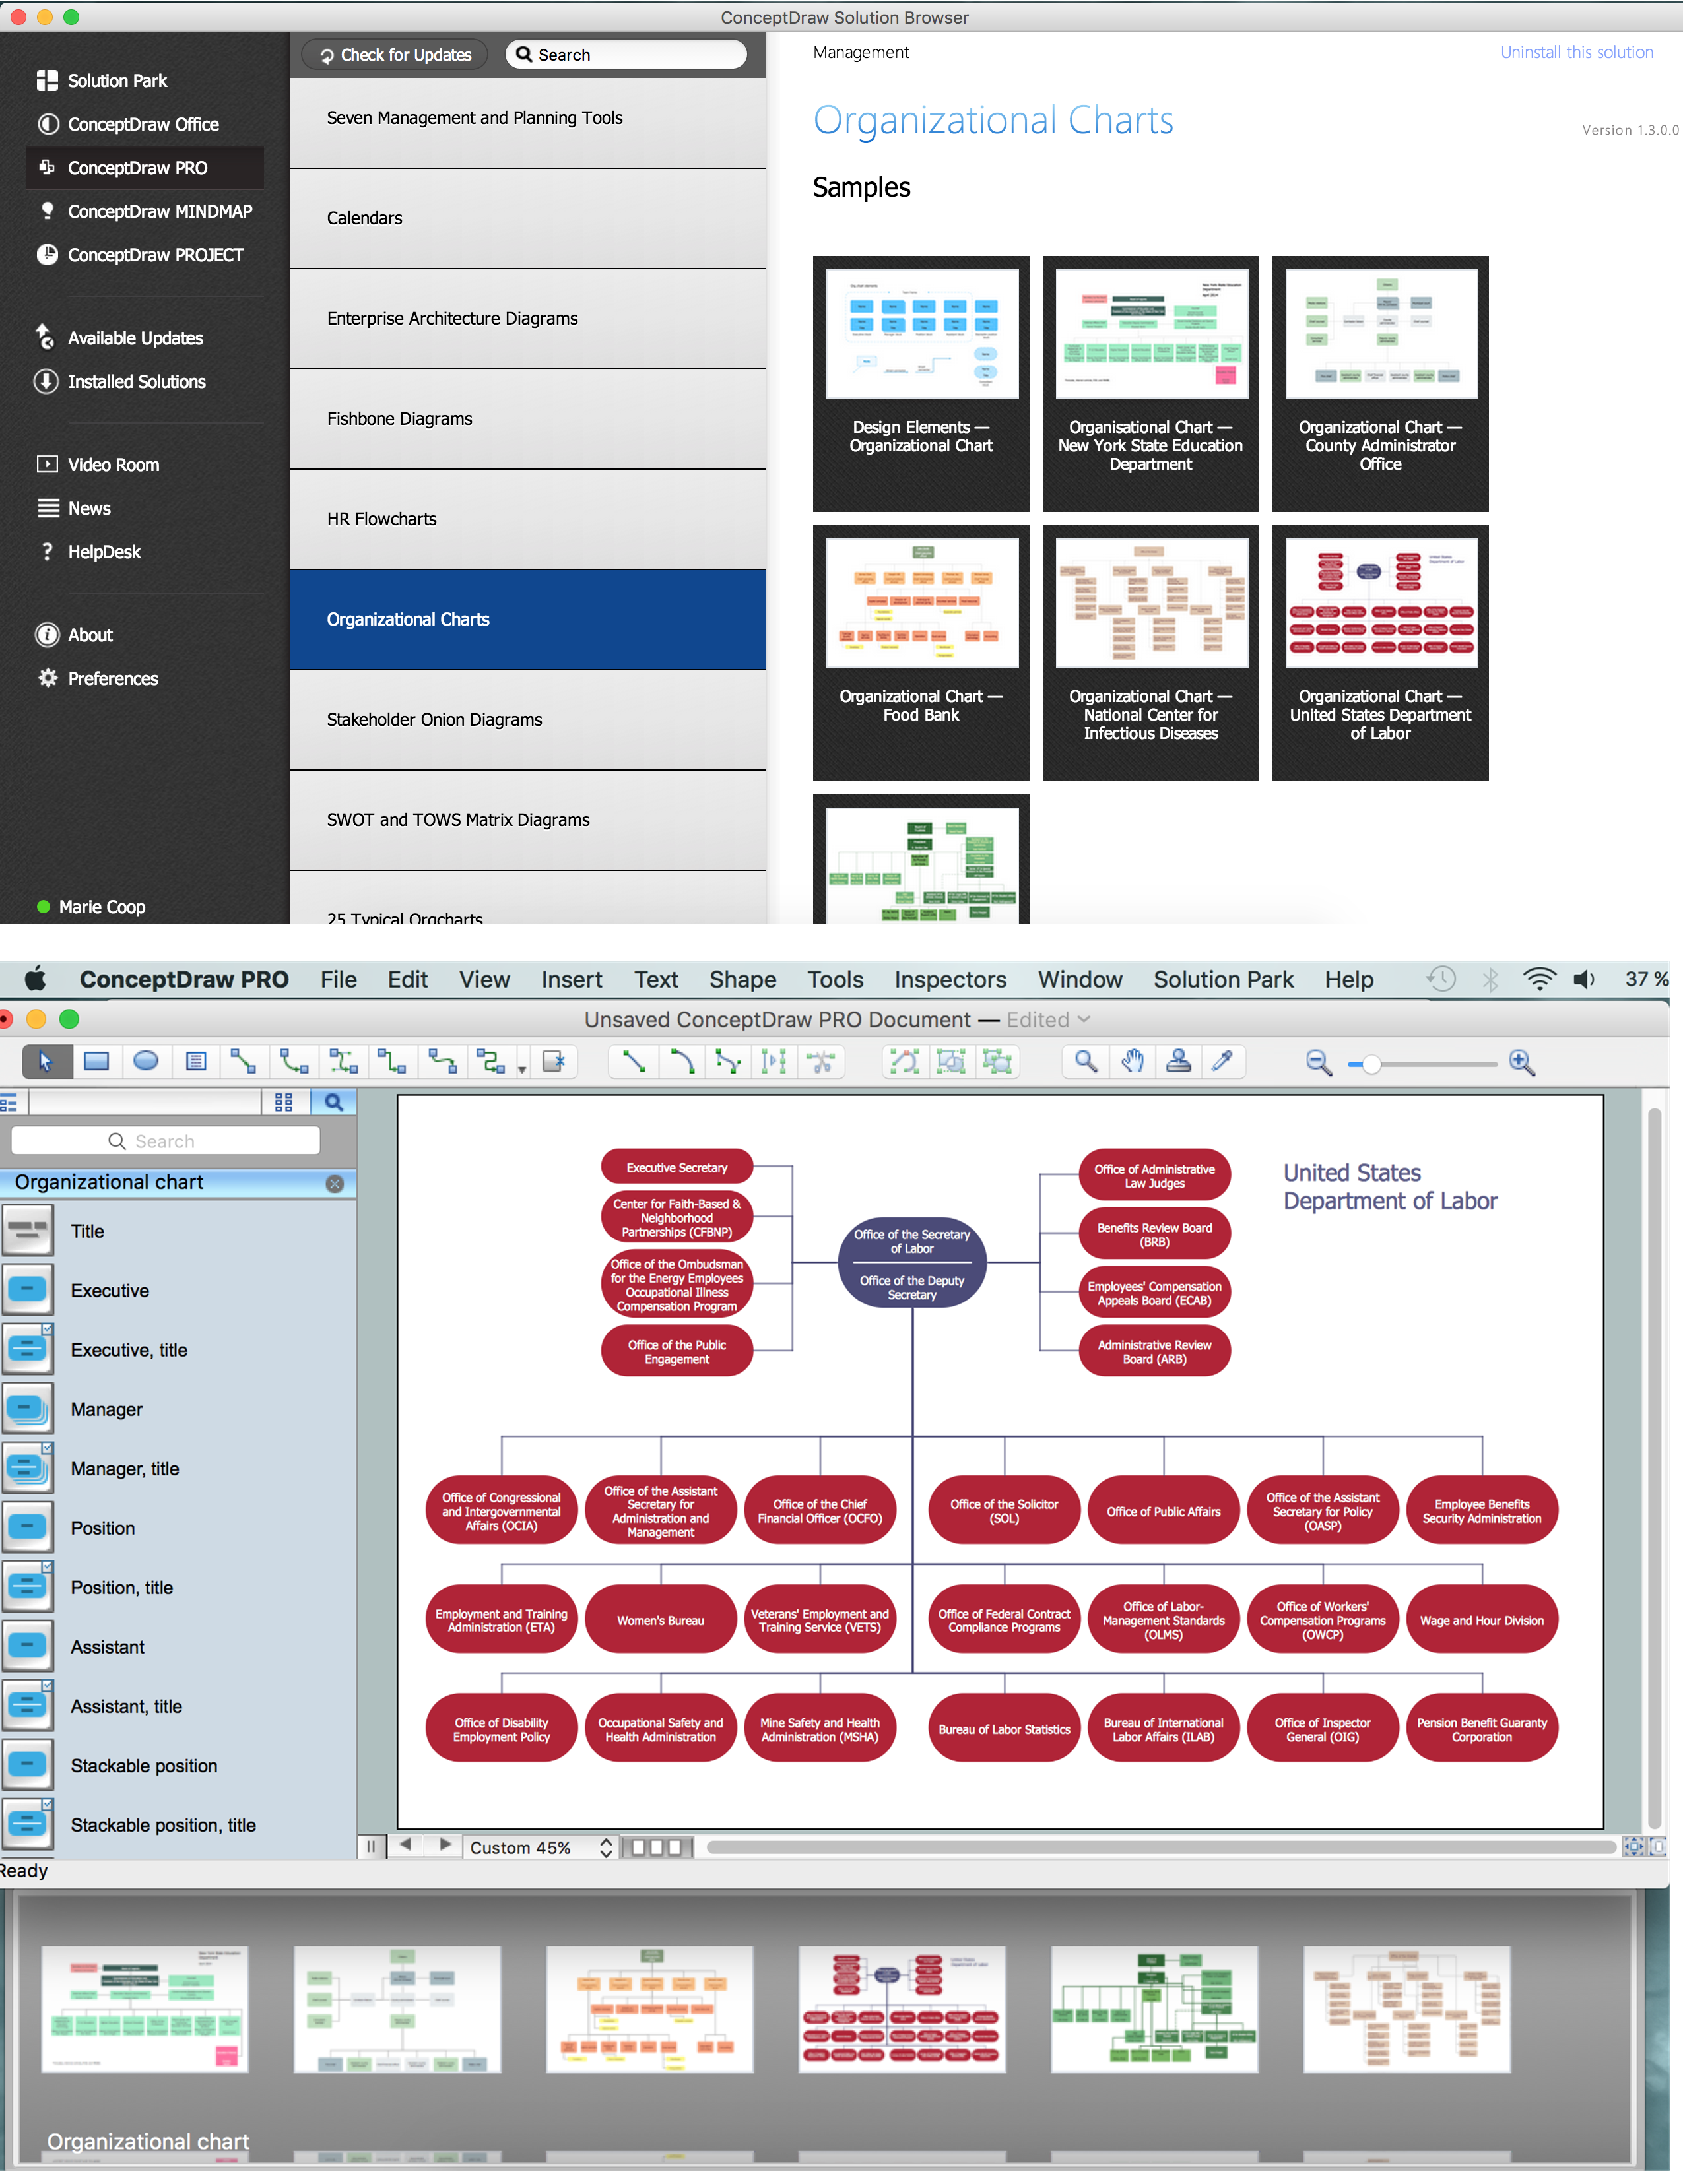
Organizational Charts solution includes a collection of templates, samples, and libraries of vector stencils, icons, symbols and clipart that support many professional ways to show data at a glance.
It helps you to show the relationships of positions in an organization in terms of authority and responsibility. Orgcharts are typically used to provide both employees and individuals outside of the organization with a “snapshot” picture of the reporting relationships, divisions of work and levels of management.

Pic.1. Organizational Charts solution includes a collection of samples
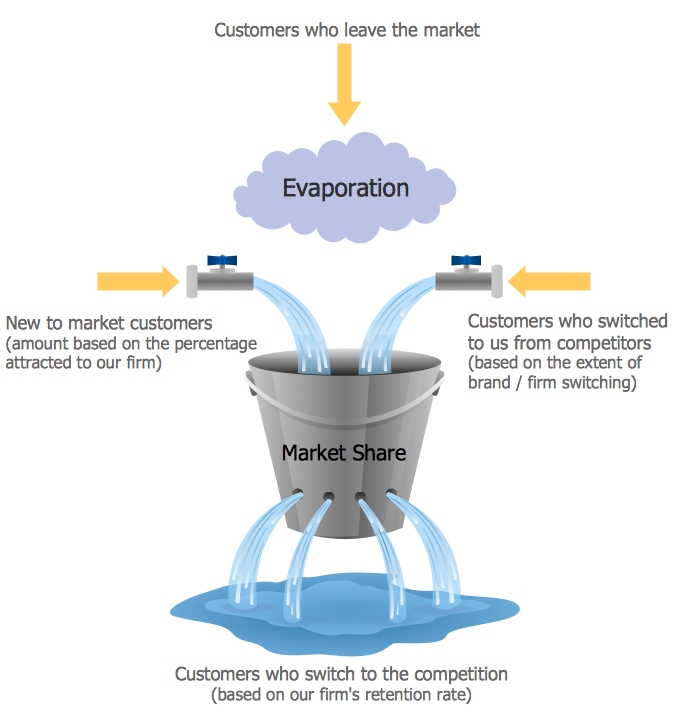
This sample shows the Organizational Chart that displays the Sales and marketing (CRM) module. You can see the structure of the CRM module and the relationships of its parts. This sample is very useful for marketing and management diagramming.

Pic.2. Marketing and Sales Organization chart
This diagram was redrawn from msdn.microsoft.com.
Using the ready-to-use predesigned objects, samples and templates from the organizational chart solution for ConceptDraw DIAGRAM you can create your own professional Organizational Charts quick and easy.
The organizational charts produced with ConceptDraw DIAGRAM are vector graphic documents and are available for reviewing, modifying, and converting to a variety of formats (image, HTML, PDF file, MS PowerPoint Presentation, Adobe Flash or MS Visio).
See also Samples:
TEN RELATED HOW TO's:
Pyramid chart example is included in the Pyramid Diagrams solution from Marketing area of ConceptDraw Solution Park.
Picture: Pyramid Diagram
Related Solutions:
ConceptDraw DIAGRAM is a powerful diagramming and vector drawing software. Each Market Chart designed in it is professional looking, attractive and successful in using thanks to the Marketing Diagrams Solution included in Marketing Area of ConceptDraw Solution Park.
Picture: Market Chart
Related Solution:
A flowchart is a simple but very functional tool when it comes to understanding a workflow or to removing unnecessary stages from a process. When drawing flowcharts, keep in mind that there are four common types of flowcharts, like document flowcharts and data flowcharts that show control over a data or document flow over a system. To show controls on a physical level, use system flowcharts. In addition, to show controls in a program, you can draw a program flowchart.
This flowchart diagram represents the piece of an article editing process, that involves the author and editor. It was created using the Basic Flowchart notation that consists from the basic flowchart symbols. The start and the end of the process are indicated with "Terminator" symbols. The "Process" symbols show the action steps consisting from making edits and searching for a compromise, when the author does not agree with the suggestions of the editor. The "Process" symbol is the general symbol in process flowcharts. The "Decision" symbol indicates a branching in the process flow. There are two branches indicated by a Decision shape in the current flowchart (Yes/No, Disagree/Agree). This basic flowchart can be used as a repeating unit in the workflow diagram describing the working process of some editorial office.
Picture: Types of Flowcharts
Related Solution:
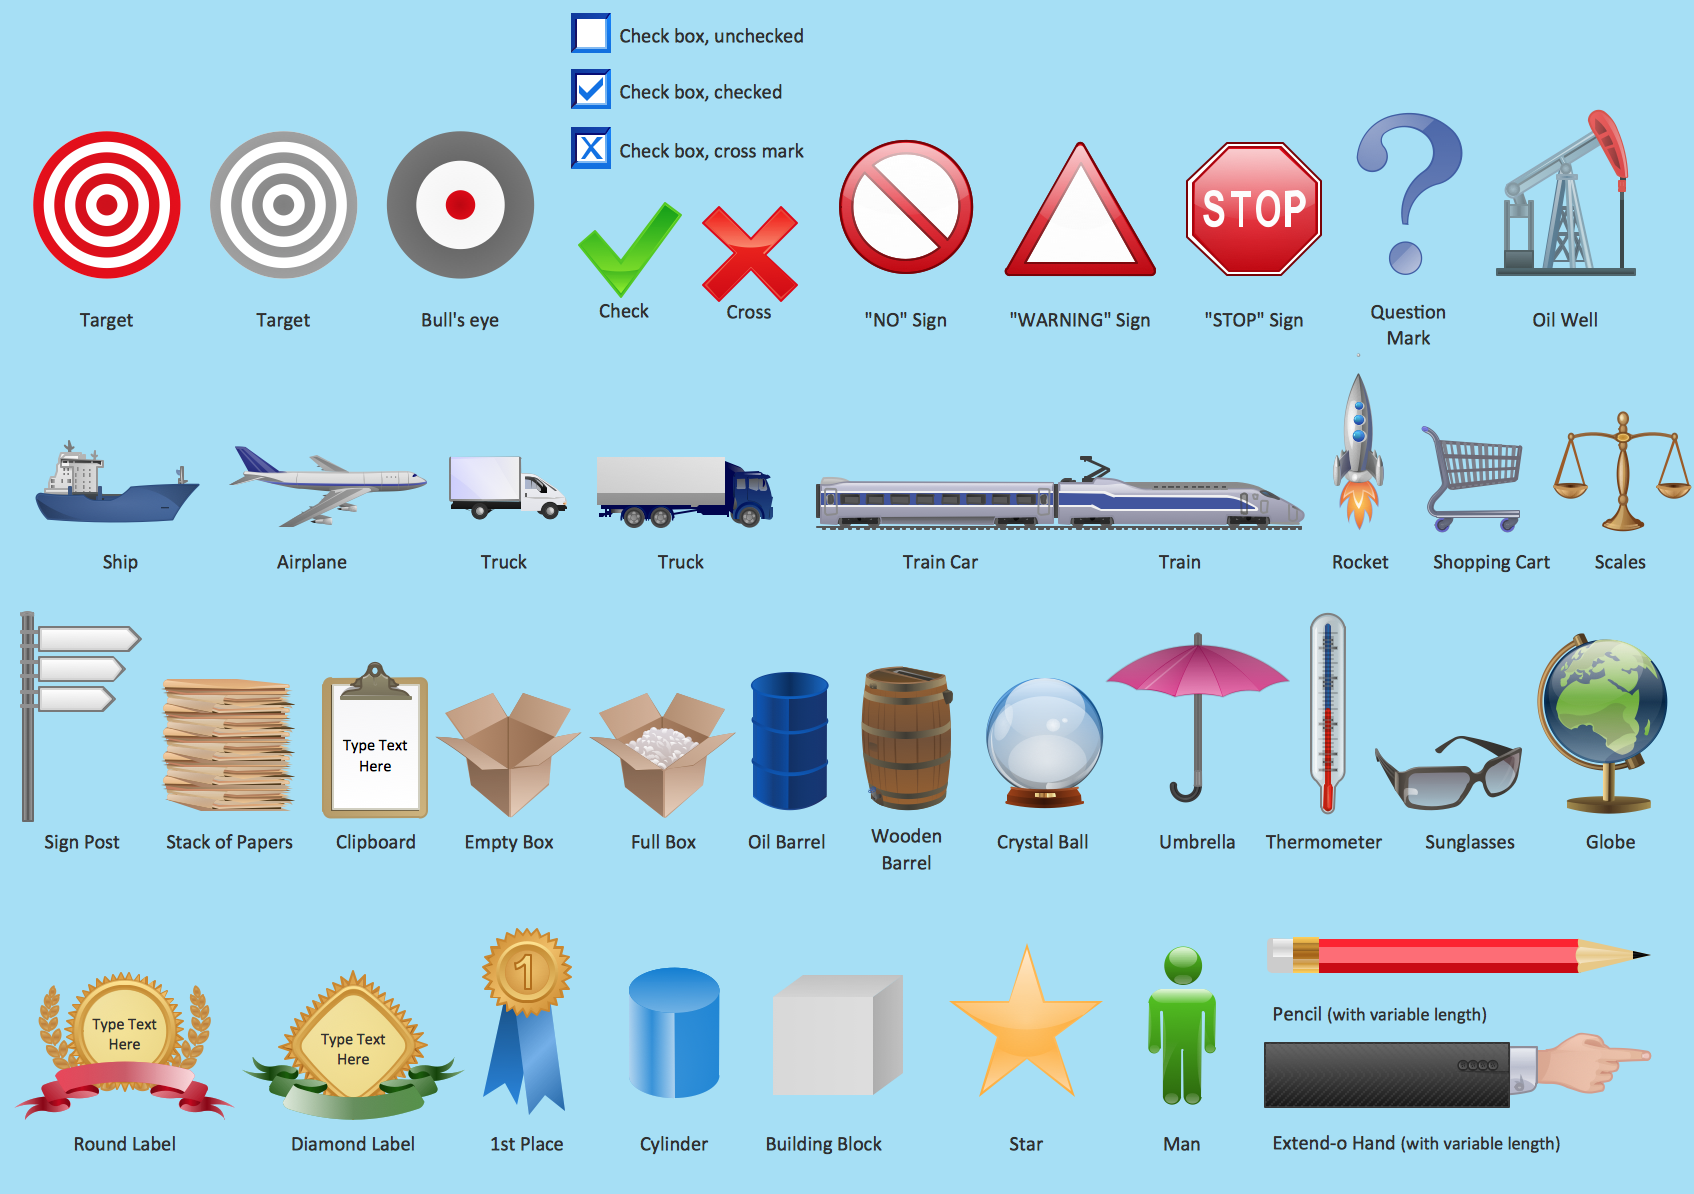
If you need to pull together a quick marketing drawing, you'll find elements, samples, templates and libraries with vector clip art for drawing the Marketing Illustrations.
These symbols and signs you can use in your design for Strategic Marketing, Graphic Design, Inbound and Content Marketing, Social Media, Lead Generation, Email Marketing and Automation, CRM implementation and Integration and more.
Picture: Marketing - Design Elements
Related Solution:
Computer networks nowadays are spread all across the world. The large number of parameters, such as geographic scale or communication protocols, can divide networks. One of the most common types of networks is called local area network (LAN). It convenient to represent network examples by means of diagrams.
This local area network (LAN) diagram provides an easy way to see the way the devices in a local network are interacted. The diagram uses a library containing specific symbols to represent network equipment , media and the end-user devices such as computers (PC, mac, laptop) , network printer, hubs, server and finally a modem. There are two types of network topologies: physical and logical. The current diagram represents precisely a physical type of LAN topology because it refers to the physical layout of a local network equipment.
Picture:
What is a Local Area Network?
Examples of LAN Diagrams
Related Solution:
A layout is a way that furniture is arranged in some place. It’s not difficult to develop a store layout using software with tons of templates and libraries with vector shapes of furniture, doors, walls etc. Create a plan in five minutes and have more time to implement it.
Designing the floor plan for a new store is very important step for a small business. Well thought out and well-done floor plan is the foundation of the store layout. It should provide a basis through which to make out and organize everything else. Sometimes a small stores have a small floor space, so well thought out arrangement of furniture and commercial equipment is crucial to the success of the business. By using the ConceptDraw Floor Plans solution you can make a floor plan for your store quickly and effortlessly.
Picture: Store Layout Software
Related Solution:
Analysis is very important part for every business, as it helps to understand the weakness and to see the opportunities, and SWOT is one of the most effective tools. To illustrate the multifunctionality of this tool, let’s imagine a SWOT sample in area of computers networking, which can be carried out to realize the pros and cons of some equipment, for example. Even a network topology or a administer can be a subject for this analysis.
This SWOT analysis matrix illustrate the sample of using this useful technique for comprehension of Strengths and Weaknesses, and for determining the Opportunities open to business and the Threats it encounters. Used in a business scope, it will help to create a perspective niche in the market for particular business. The ConceptDraw SWOT and TOWS Analysis solution gives a lot of templates of both SWOT and TOWS matrices that allow managers and marketers create custom diagrams to perform SWOT or TOWS analysis in context of a particular business.
Picture: SWOT Sample in Computers
If you have your own business, you shouldn’t be afraid to use different management techniques. It also should be mentioned that SWOT analysis tool for small business is just as useful as for an transatlantic corporation. If you want to see whether you company is able to compete on the market, SWOT analysis is a great solution.
The following drawing illustrates the simple template, created for providing SWOT analysis. You can use it for your management courses as a tutorial for SWOT analysis. The tips, added to each section of a matrix are intended to help you to fill them with the information of the strengths and weaknesses of your training case, and do not forget, at the same time, about opportunities and threats. This template is one of a set of templates of SWOT matrices that can be found in the the ConceptDraw SWOT and TOWS diagrams solution. This solution used as part of simple project management software in ConceptDraw Office as advertising agency software or marketing management software.
Picture: SWOT Analysis Tool for Small Business
Using ConceptDraw you will be able to create bubble diagrams from the ready ConceptDraw library objects or make your own objects. The created diagram can be saved and edited, objects can be moved and links between them will be automatically repainted after object moving because of using the ConceptDraw connectors.
Picture: Bubble diagrams with ConceptDraw DIAGRAM
Related Solution:
The most worked out and commonly used methodology of business processes description is IDEF methodology. Besides business processes it allows to describe functional blocks, for example production and marketing. ConceptDraw lets creation of business processes description using IDEF0 and IDEF2 methods.
Picture: Business Processes
Related Solution:


