
Example 2. Entity Relationship Software. Crow's Foot notation
The Entity-Relationship Diagram (ERD) solution provides templates and samples that allow you get closer with ER diagrams. All they are available for viewing and editing from ConceptDraw STORE.
 Solution in ConceptDraw STORE")
Example 3. Entity-Relationship Diagram (ERD) Solution in ConceptDraw STORE
Entity relationship diagram (ERD) Libraries
There are also 2 libraries at the Entity-Relationship Diagram (ERD) solution with all necessary objects to produce your own ER diagram. You can simply drop desired of them into your document to quickly and easily create the diagram.

Example 4. ERD Libraries
The Entity-Relationship Diagram (ERD) solution for ConceptDraw DIAGRAM helps you to produce the ER Diagrams that you can readily use to document databases in white papers, presentations, data sheets, posters, and technical materials.
Examples of Entity relationship diagram (ERD)
The Entity-Relationship Diagram (ERD) solution from ConceptDraw Solution Park extends ConceptDraw DIAGRAM ector graphics and diagramming software with the ability to describe a database using the Entity-Relationship model and offers a lot of examples that you can successfully use as the base for your own ERDs.

Example 5. Entity Relationship Diagram (ERD) Example - ERD Employee Certification Entity
Use ConceptDraw DIAGRAM software extended with Entity-Relationship Diagram (ERD) solution to draw your own ER diagrams using Chen's or Crow's foot notations without efforts.

Example 6. Entity Relationship Software (Mac OS X and Windows)
The following features make ConceptDraw DIAGRAM extended with the Entity-Relationship Diagram (ERD) solution the most effective Entity Relationship Software:
- You don't need to be an artist to draw professional looking diagrams in a few minutes.
- Large quantity of ready-to-use vector objects makes drawing your diagrams quick and easy.
- Extensive collection of pre-designed templates and samples give you a great start for your own diagrams.
- ConceptDraw DIAGRAM provides you with the possibility to use the grid, rules and guides. You can easily rotate, group, align, and arrange objects, and use different fonts and colors to make your diagram stand out.
- All ConceptDraw DIAGRAM documents are vector graphic files and are available for reviewing, modifying, and converting to a variety of formats: image, HTML, PDF file, MS PowerPoint Presentation, Adobe Flash, MS Visio.
- Using ConceptDraw STORE you can navigate through ConceptDraw Solution Park, managing downloads and updates. You can access libraries, templates and samples directly from ConceptDraw STORE.
- If you have any questions, our support is free of charge and always ready to come to your aid.
TEN RELATED HOW TO's:
Once you have created your document in ConceptDraw DIAGRAM and you want to share it with your colleagues and friends, who uses MS Visio on their computers, you can easily export your document using ConceptDraw DIAGRAM export to Visio XML files (VDX) feature.
Now you can share your ConceptDraw documents with MS Visio users.
Picture: Export from ConceptDraw DIAGRAM Document to MS Visio® XML
ConceptDraw DIAGRAM software extended with the Sales Dashboard solution allows you produce sales dashboards for your company easily. You can start from samples and templates delivered with the solution and then modify them to get a dashboard that suites your specific needs.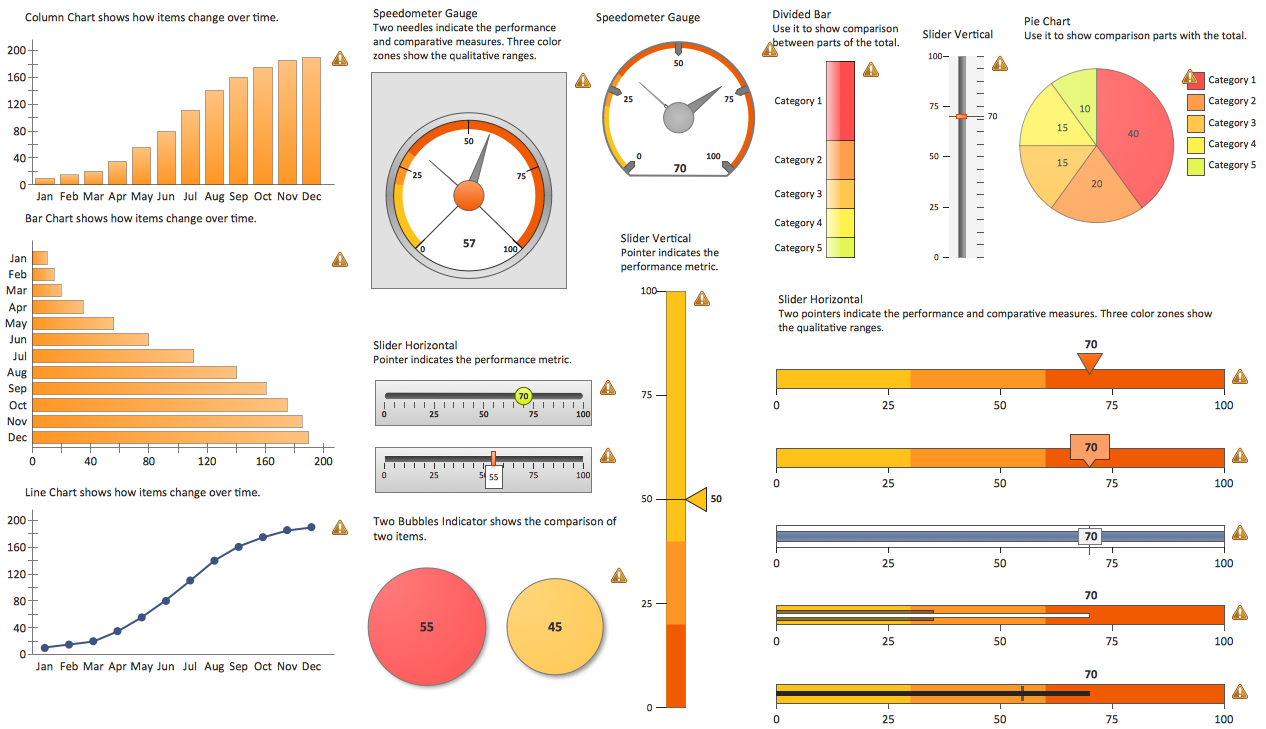
Picture: Sales Dashboards for Your Company
Any factory needs a clear scheme of all the equipment used in the manufacture processes. So, if you want to place all your machines and equipment on one diagram, you need a good diagramming tool for that. For instance, you can find all the design elements you might need, such as lathes, milling machines or saws on ConceptDraw DIAGRAM Solution Park in Plant Layout Plans solution in appropriate libraries.
This drawing represents the Machines and Equipment library delivered by ConceptDraw Plant Layout Plans solution. This vector library is supplied along with other libraries related to industrial architecture planning and interior design.
Just planning the proper facilities in a proper right place, allows to manufacture a product in the most effective and economic way. Objects containing in these libraries will be helpful for architects and engineers dealing with industrial buildings design. They are intended to use for designing layouts of plants, warehouses, manufacturing workshop etc.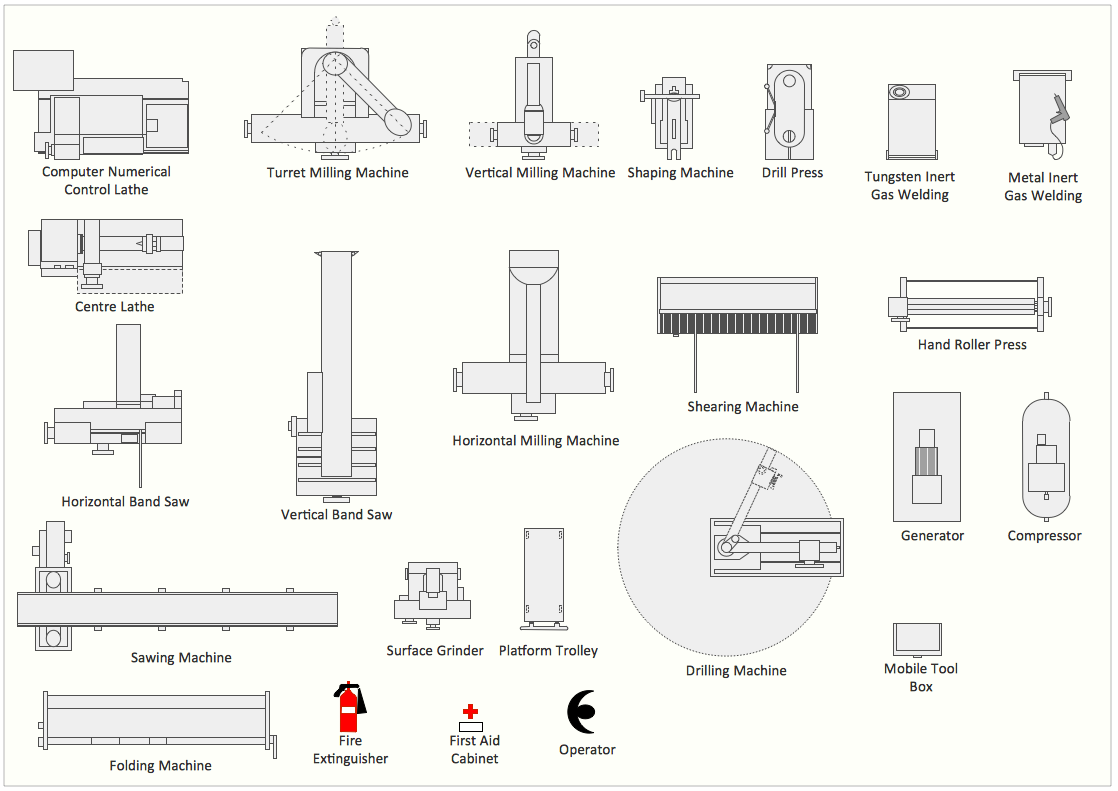
Picture: Interior Design. Machines and Equipment — Design Elements
Related Solution:
Use the Relations Diagram to create a relations factors map and to identify which factors are “drivers” and “indicators”. This diagram identifies causal relationships and determine what factors are causes or effects.
ConceptDraw OFFICE suite is a software for relation diagram making.
Picture: PROBLEM ANALYSIS.Relations Diagram
There are a lot of structured analysis and design technique methodologies used to describe systems and data sources. To visualize data structures, data flow diagrams can be used for various purposes in the area of software engineering. Nowadays these diagrams are also used in the area of business analysis and information system analysis.
This data flow diagram depicts an account processing system of a typical account department of a small manufacturing enterprise. It shows the data transmission through the order processing to shipping verification. This data flow diagram was created according to standard of Yourdon and Coad notation. The vector graphic objects of Yourdon/Coad notation symbols was delivered by ConceptDraw Data Flow Diagrams solution. The current DFD can be employed as an example of a business process model, representing the set of business events and interactions commonly engaged in a accounts receivable process.
Picture: Data Flow Diagrams
Related Solution:
There are many ways to track the system in a critical situation. To model a system behavior, uml notation is widely used. Usually, an UML diagram consists of elements such as actor and a case.
This diagram represents the structure of UML notations. Unified Modeling Language (UML) is used in software engineering to depict graphically the software modeling process. UM Language uses graphic notations for developing models of object-oriented systems. These notations displays requirements, sub-systems, logical and physical elements, etc. We created this diagram using ConceptDraw DIAGRAM reinforced with Rapid UML solution. It can be helpful for students on software engineering, when learning UML.
Picture: UML Notation
Related Solution:
The critical importance of house electrical plans. 🔸 Learn how to create efficient electrical layouts using the ConceptDraw DIAGRAM app. Enhance ✔️ safety, ✔️ functionality, and ✔️ compliance with electrical codes in your home projects with our comprehensive guide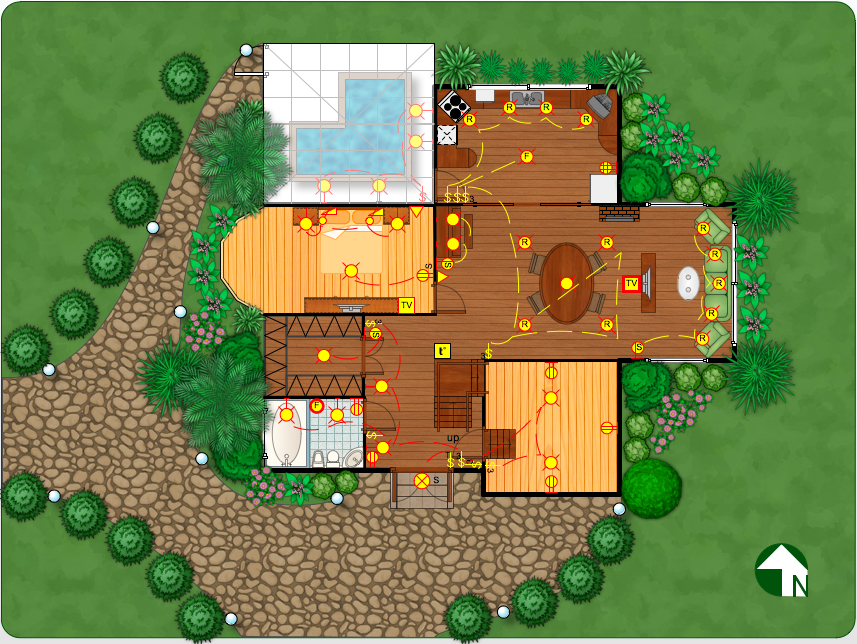
Picture:
Importance of House Electrical Plans.
How to Create Electrical Layouts
with ConceptDraw DIAGRAM App
Related Solution:
ConceptDraw is your tool for driving social integration and managing change across and streamline social media processes of your organisation.This tool keeps the entire team on the same page allowing you to realize your social media strategy, improve the quality of your answers, and minimize the time it takes to respond.
Picture: Social Media Response Management DFD Charts - software tools
Related Solution:
Take a look on an example of Cross-Functional-Flowchart, showing the software service cross-function process flowcharts among the different departments. It presents a simple flowchart among the customer, sales, technical support, tester and development.
Try now Flowchart Software and Cross-Functional library with 2 libraries and 45 vector shapes of the Cross-Functional Flowcharts solution. Then you can use built-in templates to create and present your software service cross-function process flowcharts.
Picture: Cross Functional Flowchart Examples
This sample shows the Six Markets Model Chart. It was created on the base of the template saved in the Marketing Diagrams Solution.
It’s very easy, convenient and quick to create the professional looking marketing diagrams of any complexity with ConceptDraw DIAGRAM. Marketing Diagrams Solution for ConceptDraw DIAGRAM provides many templates, samples and a wide set of ready-to-use vector objects.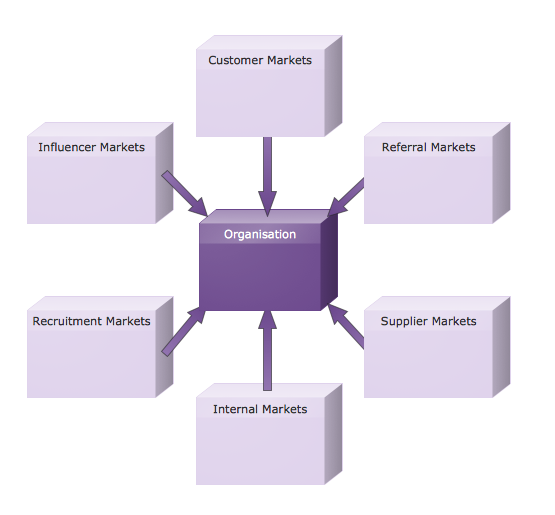
Picture: Customizable Six Markets Model Chart Template
Related Solution:

 Solution in ConceptDraw STORE")

