
Example 1. Data Modeling with Entity Relationship Diagram
Entity-Relationship Diagram (ERD) solution for ConceptDraw DIAGRAM has examples, samples and templates, and 2 libraries with numerous quantity of vector objects for fast and easy data modeling with Entity Relationship Diagram.

Example 2. ERD Templates
The vector graphic Entity Relationship Diagrams designed in ConceptDraw DIAGRAM to visualize the logical structure of databases can be a perfect accent for whitepapers, presentations, datasheets, posters, or any technical materials.

Example 3. Entity-Relationship Model Diagram
The samples you see on this page were created in ConceptDraw DIAGRAM using the libraries from Entity-Relationship Diagram (ERD) Solution and demonstrate the process of data modeling with Entity Relationship Diagram. An experienced user spent 10-15 minutes creating each of these samples.
Use the Entity-Relationship Diagram (ERD) Solution for ConceptDraw DIAGRAM software for quick, easy and effective drawing ER diagrams and data modeling.
All source documents are vector graphic documents. They are available for reviewing, modifying, or converting to a variety of formats (PDF file, MS PowerPoint, MS Visio, and many other graphic formats) from the ConceptDraw STORE. The Entity-Relationship Diagram (ERD) Solution is available for all ConceptDraw DIAGRAM users.
TEN RELATED HOW TO's:
Website wireframes are convenient and widely used by developers, visual designers, business analysts, and many other people related with projection, development and promotion websites. Usually website wireframes look lacking of brilliance, but they effectively reflect website functionality, content and visually represent its skeletal framework.
ConceptDraw DIAGRAM software offers a unique Website Wireframe solution from the Software Development area with all needed tools for fast and easy drawing professional looking website wireframe with attractive interface design.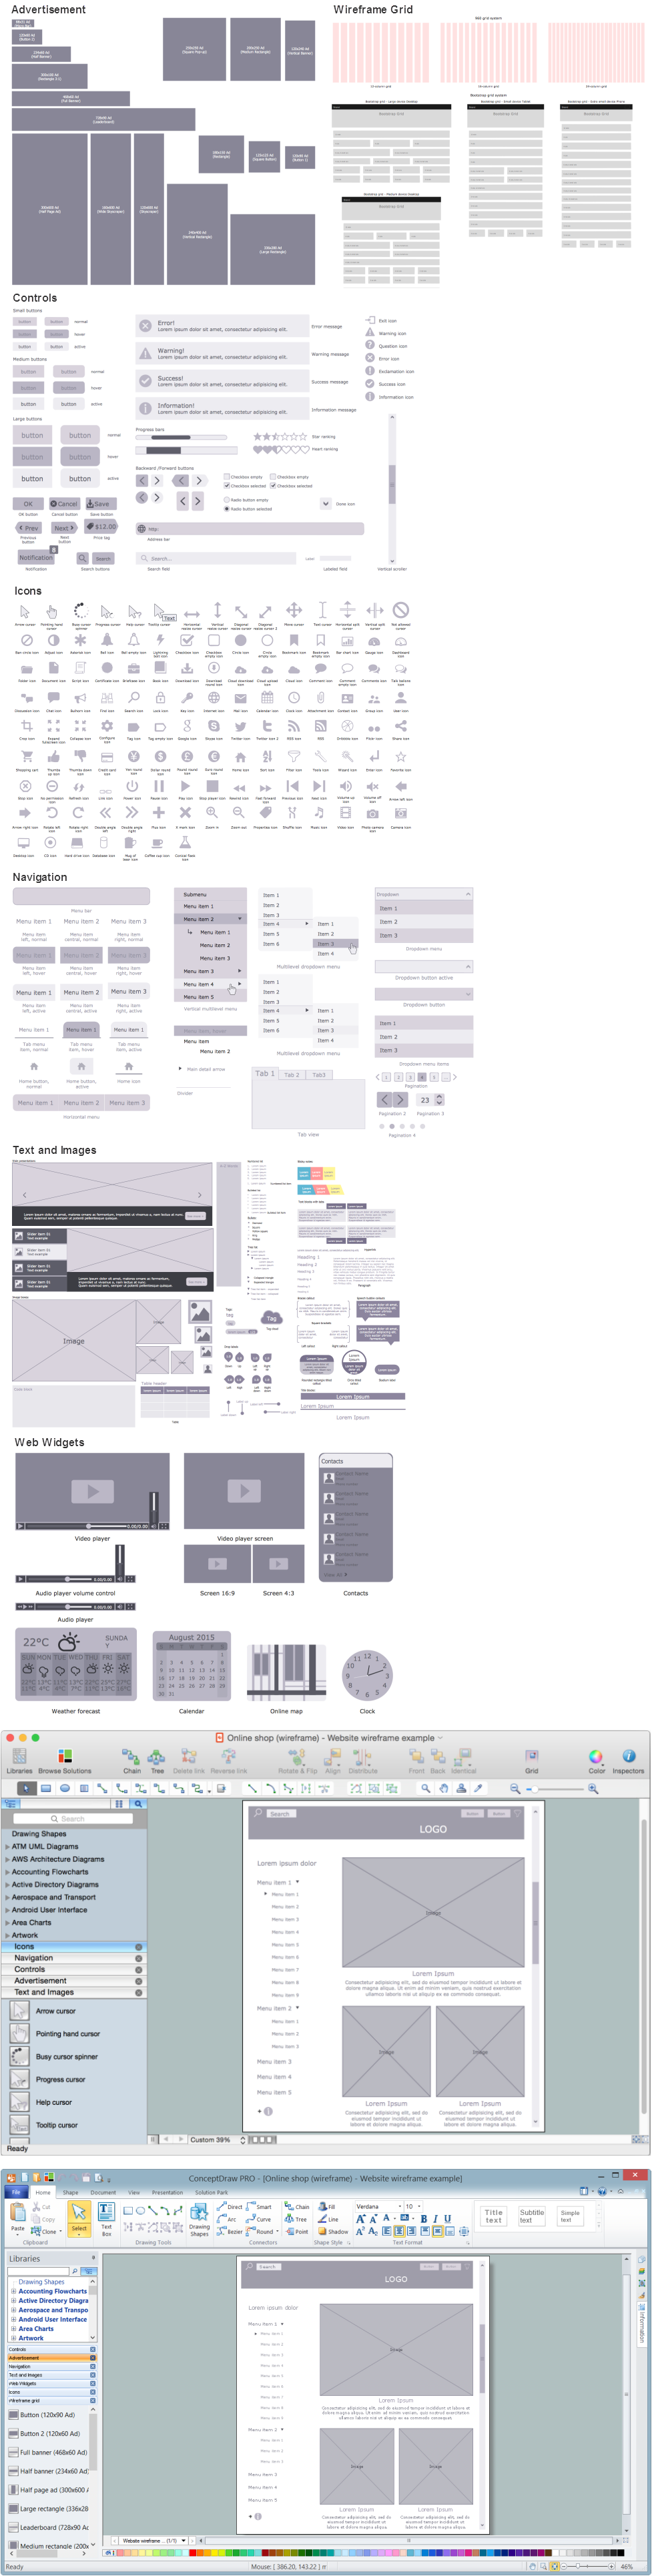
Picture: Interface Design
Related Solution:
Teams working with Scrum methodology use the product backlog items (PBIs), bug work item types (WITs), reports and dashboards. SCRUM Workflow solution for ConceptDraw DIAGRAM software offers collection of samples, variety of predesigned objects, clipart and graphic elements, a set of Scrum process work items and workflow which are developed for agile teams working using Scrum.
Picture: Scrum process work items and workflow
Related Solution:
A waterfall model describes software development process as a sequence of phases that flow downwards. SSADM is one of the implementations of waterfall method. It’s easier to learn about structured systems analysis and design method (SSADM) with ConceptDraw DIAGRAM because this software has appropriate tools for creating data flow diagrams. You can use all the three main techniques of SSADM method with special tools and predesigned templates.
This data flow diagram illustrates the Structured Systems Analysis and Design Method. This method method considers analysis, projecting and documenting of information systems. Data flow models are the most important elements of SSADM and data flow diagrams are usually used for their description. It includes the analysis and description of a system as well as visualization of possible issues.
Picture: Structured Systems Analysis and Design Method. SSADM with ConceptDraw DIAGRAM
Related Solution:
Stakeholder management is a critical component to the successful delivery of any project, programme or activity.
ConceptDraw DIAGRAM is a powerful diagramming and vector drawing software. Now, thanks to the Stakeholder Onion Diagrams Solution included to the Management Area of ConceptDraw Solution Park, ConceptDraw DIAGRAM became also unique stakeholder management system design software.
Picture: Stakeholder Management System using Onion Diagram
Related Solution:
This sample shows the concept of working of the transport company and is used by transport companies, carriers at the transportation of various goods.
Picture: UML Class Diagram Example for GoodsTransportation System
Related Solution:
A Data Flow Diagram (DFD) is a graphical technique which allows effectively model and analyze the information processes and systems. The ability to fast and easy create the DFDs is made possible with Data Flow Diagrams solution from the Software Development area of ConceptDraw Solution Park. For designing the Data Flow Diagrams are used simple DFD flowchart symbols which are connected each other by arrows depicting the data flow from one step to another.
Picture: DFD Flowchart Symbols
Related Solution:
Jackson System Development (JSD) is a linear method of system development created by Michael A. Jackson and John Cameron in the 1980s. It comprises the whole software life cycle directly or providing a framework for more specialized techniques.
When implementing the Jackson System Development method and designing JSD diagrams, you can succesfully use the powerful and helpful tools of ConceptDraw DIAGRAM software extended with Entity-Relationship Diagram (ERD) solution from the Software Development area of ConceptDraw Solution Park.
Picture: JSD - Jackson system development
Related Solution:
This pyramid chart example is supplied with the ConceptDraw Pyramid Diagrams solution. This is a model of Information Management Systems classification. It is made in a form of a four-level pyramid. The top level shows the information system developed for an executive management. Below, there is a level depicting the system of decision making process for the managers of the senior level. A schematic representation of the middle management information system, following to logic, is in the middle of the pyramid. And at least, the lowermost level represents an information processing system for employees.
Picture: Pyramid Diagram
Related Solutions:
Software designers and developers widely apply the UML for developing and building database systems and computer applications. For drawing the UML diagrams they need convenient database diagram tool. ConceptDraw DIAGRAM extended with Rapid UML Solution from the Software Development Area for ConceptDraw Solution Park is ideal database diagram tool for software designers and developers.
Picture: Database Diagram Tool
Related Solution:
ConceptDraw DIAGRAM is a powerful tool for business and technical diagramming.
Software Development area of ConceptDraw Solution Park provides 5 solutions:
Data Flow Diagrams, Entity-Relationship Diagram (ERD), Graphic User Interface, IDEFO Diagrams, Rapid UML.
Picture: Software Diagram Examples and Templates
Related Solution:

