
Example 1. Education Infographics - Learning Infogram
Just look how are professional looking, comprehensive and colorful the education infographics created with help of 330 ready-to-use vector objects from the 11 libraries of Education Infographics Solution:
- Education Charts
- Education Diagram
- Education Pictograms
- Education Callouts
- Education Connectors
- Education Indicators
- Education Backgrounds
- Education Maps
- Education List Blocks
- Education Title Blocks
- Education Titled Callouts

Example 2. Education Infographics - Distance
Part of examples included in Education Infographics Solution is represented on this page, another education infographics samples and templates are available for viewing and editing from ConceptDraw STORE.

Example 3. Education Infographics - Lifestyle Analysis Infogram
The following features make ConceptDraw DIAGRAM the best Education Infographics software:
- You don't need to be an artist to draw professional looking diagrams in a few minutes.
- Large quantity of ready-to-use vector objects makes your drawing infographics quick and easy.
- Great number of predesigned templates and samples give you the good start for your own diagrams.
- ConceptDraw DIAGRAM provides you the possibility to use the grid, rules and guides. You can easily rotate, group, align, arrange the objects, use different fonts and colors to make your diagram exceptionally looking.
- All ConceptDraw DIAGRAM documents are vector graphic files and are available for reviewing, modifying, and converting to a variety of formats: image, HTML, PDF file, MS PowerPoint Presentation, Adobe Flash, MS Visio.
- Using ConceptDraw STORE you can navigate through ConceptDraw Solution Park, managing downloads and updates. You can access libraries, templates and samples directly from the ConceptDraw STORE.
- If you have any questions, our free of charge support is always ready to come to your aid.
TEN RELATED HOW TO's:
Definition, examples, layout options, best practices, and common mistakes for cross functional flowcharts (swimlane diagrams).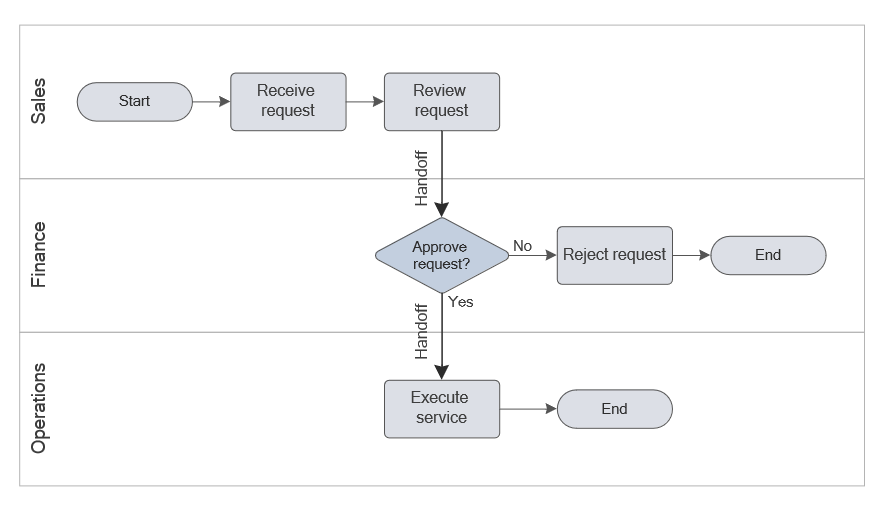
Picture: Cross Functional Flowchart (Swimlane Diagram): Definition, Structure, Examples, and How to Create
Related Solution:
Data modeling is actively applied in analysis and uses wide set of methods for description the data requirements in a system. One of the most popular and well-known is the ERD method of database modeling.
The best ERD tool for the Mac and Windows is ConceptDraw DIAGRAM software extended with the Entity-Relationship Diagram (ERD) solution from the Software Development Area for ConceptDraw Solution Park, which is sharpened for professional ERD drawing and data modeling with Entity Relationship Diagram.
Picture: Data Modeling with Entity Relationship Diagram
Related Solution:
There are a lot of structured analysis and design technique methodologies used to describe systems and data sources. To visualize data structures, data flow diagrams can be used for various purposes in the area of software engineering. Nowadays these diagrams are also used in the area of business analysis and information system analysis.
This data flow diagram depicts an account processing system of a typical account department of a small manufacturing enterprise. It shows the data transmission through the order processing to shipping verification. This data flow diagram was created according to standard of Yourdon and Coad notation. The vector graphic objects of Yourdon/Coad notation symbols was delivered by ConceptDraw Data Flow Diagrams solution. The current DFD can be employed as an example of a business process model, representing the set of business events and interactions commonly engaged in a accounts receivable process.
Picture: Data Flow Diagrams
Related Solution:
This template was created in ConceptDraw DIAGRAM diagramming and vector drawing software using the Block Diagrams Solution from the “Diagrams” area of ConceptDraw Solution Park.
This template shows the Product Proposal Diagram on that is displayed the sequence of the product planning steps. This diagram is convenient, visual and clear.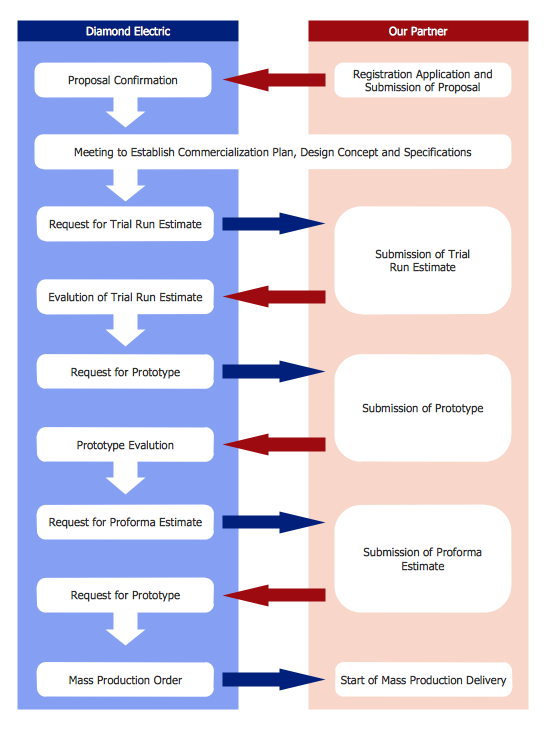
Picture: Product Proposal Template
Related Solution:
Information graphic or infographic is a visual representation of various information, data or knowledge. ConceptDraw DIAGRAM extended with unique Education Infographics Solution from the Business Infographics Area will help you design any education information graphic without efforts.
Picture: Information Graphic
Related Solution:
The Cause and Effect diagram introduced by Kaoru Ishikawa in 1968 is a method for analyzing process dispersion. It can help you to dive into a problem and find an effective solution, identify and represent the possible causes for an effect, analyze the complex business problems and successfully solve them.
You can design your Cause and Effect diagram on a paper, but more effective way is to use specific software - ConceptDraw DIAGRAM is a powerful Cause and Effect Diagram Software. It helps you create Cause and Effect diagram known also as Fishbone diagram or Ishikawa diagram from templates and examples.
Picture: Cause and Effect Diagram Software
Related Solution:
The Total Quality Management Diagram solution helps your organization visualize business and industrial processes. Create Total Quality Management diagrams for business process with ConceptDraw software.
Picture: Identifying Quality Management System
Related Solution:
Genetic engineering is moving in a rapid fashion. There are new discoveries occurring at an incredibly fast pace.
This map was created from content found at FAQ About Genetic and Genomic Science (National Human Genome Research Institute, www.genome.gov) and shows how simple in is to use a map structure to explain complex subjects. The content from this map and maps similar to this can be used with the eLearning for Skype solution for ConceptDraw MINDMAP to present complex information in a simplified manner.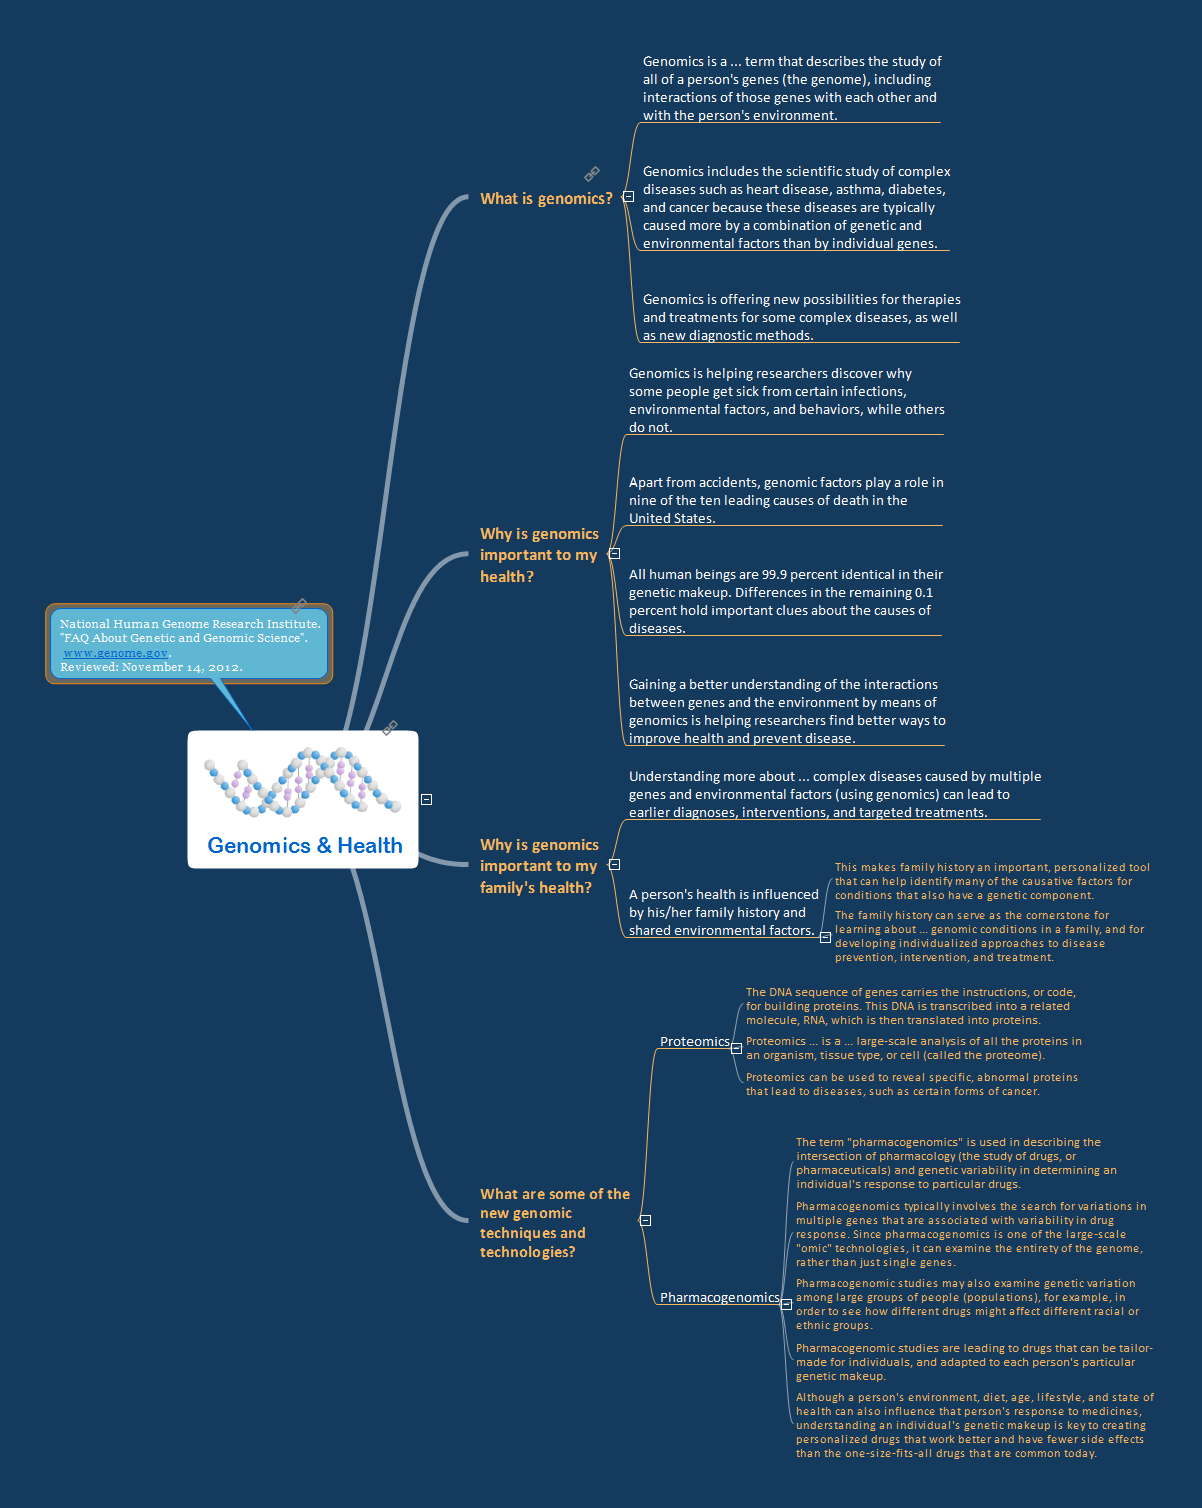
Picture: Genomics
Related Solution:
ConceptDraw is a visualization Software for making transportation infographics. Infographics design vector elements and vector graphics which will surely help you in your design process.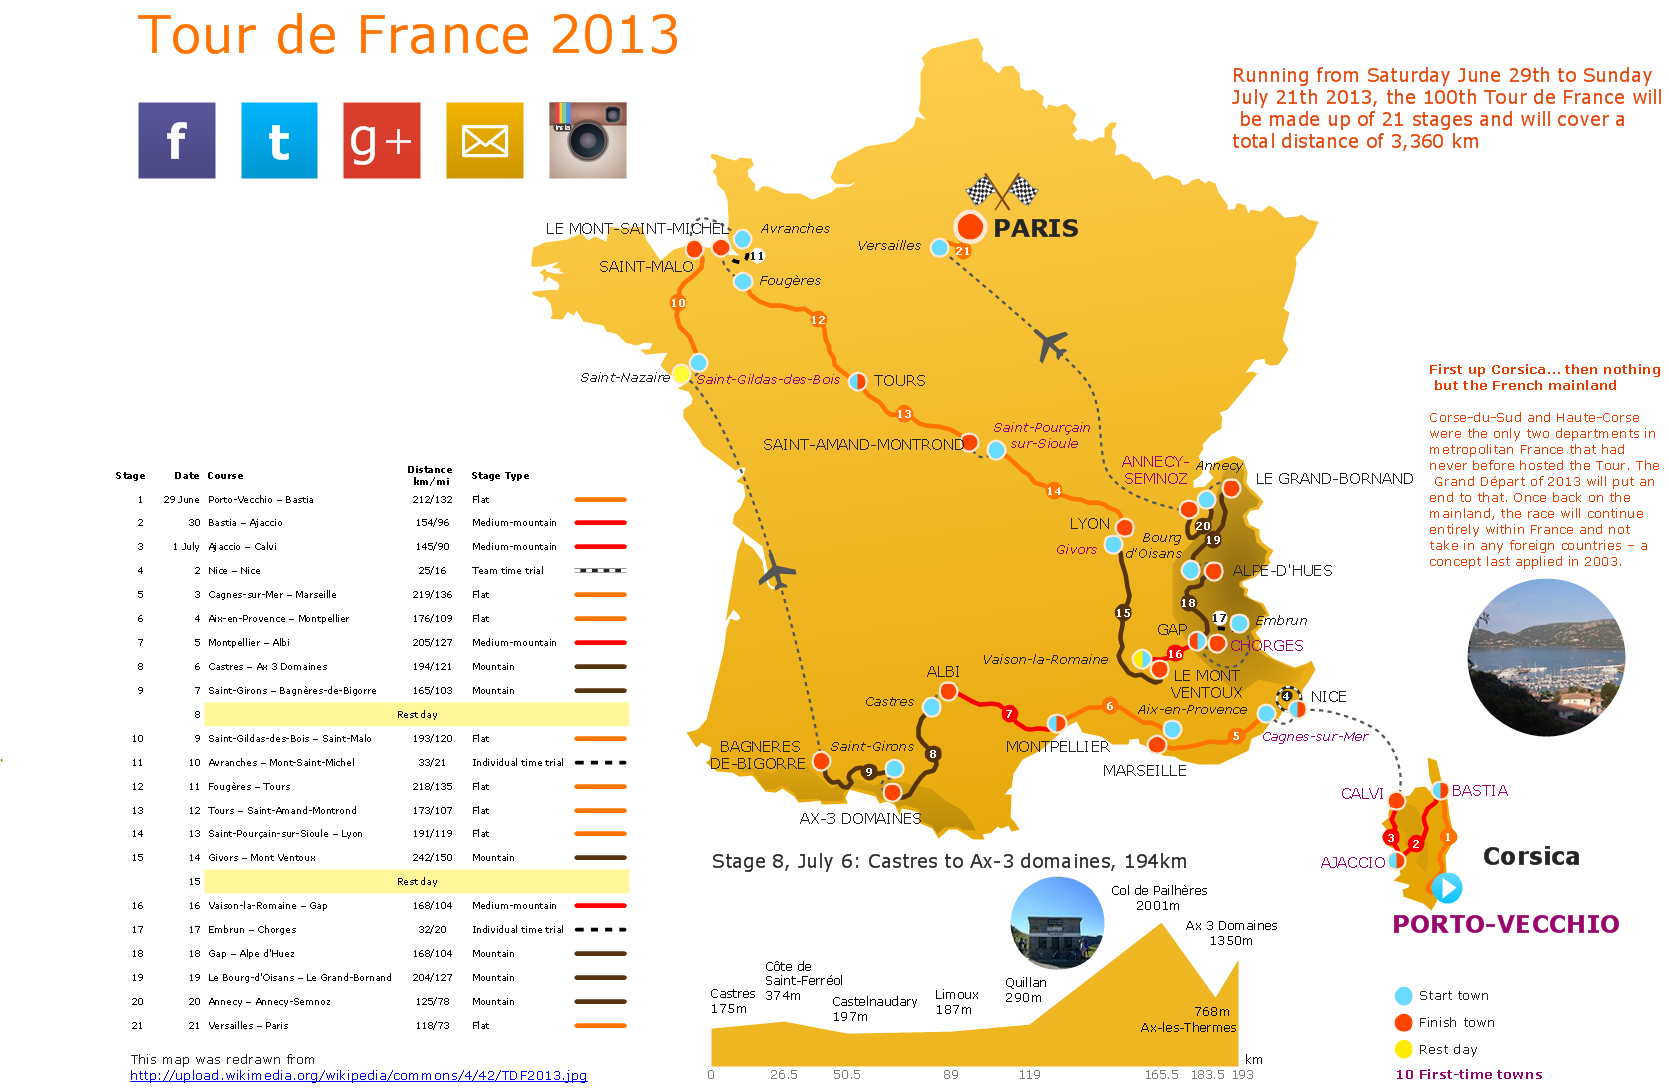
Picture: Transportation Infographics
The popularity of visual content marketing grows day by day. So now simple and convenient designing of professional looking Content Marketing Infographics becomes increasingly actual. For achievement this goal ConceptDraw DIAGRAM software offers the Marketing Infographics Solution from the Business Infographics Area.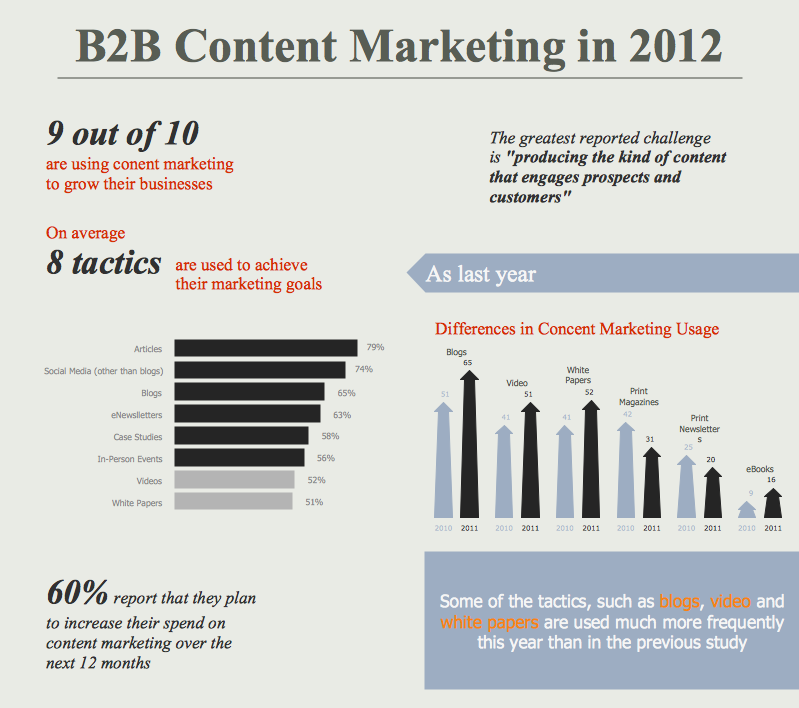
Picture: Content Marketing Infographics
Related Solution:

