Online Collaboration via Skype
3 ways to use Skype for business collaboration
ConceptDraw MINDMAP is a powerful tool for making productive group collaboration which provides next 3 ways to accomplish the purpose: Communication, Learning Sessions, Conference Calls
- Communication. When you work apart you need immediate approval of a document for five minutes. ConceptDraw Remote Presentation for Skype solution allows sharing ideas, and asking for advice or suggestions remotely.
- Learning Sessions. If you need to teach new member to become familiar with your work, you can set a training session with him on Skype within ConceptDraw MINDMAP .
- Conference Calls. If you make conference calls with clients on a regular basis, then ConceptDraw Remote Presentation for Skype solution help you to approve conversation to next level of visual communication.

Sample 1. Getting Started
Getting Started with Remote Presentation for Skype mind map sample is created using ConceptDraw MINDMAP mind mapping software. This example helps to learn how to use mind map presentation via Skype for team collaboration on software sales business planning.
Use this mindmap example for implementation of Remote Presentation for Skype solution from ConceptDraw Solution Park.
See also Samples:
TEN RELATED HOW TO's:
ConceptDraw MINDMAP and Evernote has a multitude of options for users — you can save any part of a mind map: including topics, branches, and entire maps to your Evernote.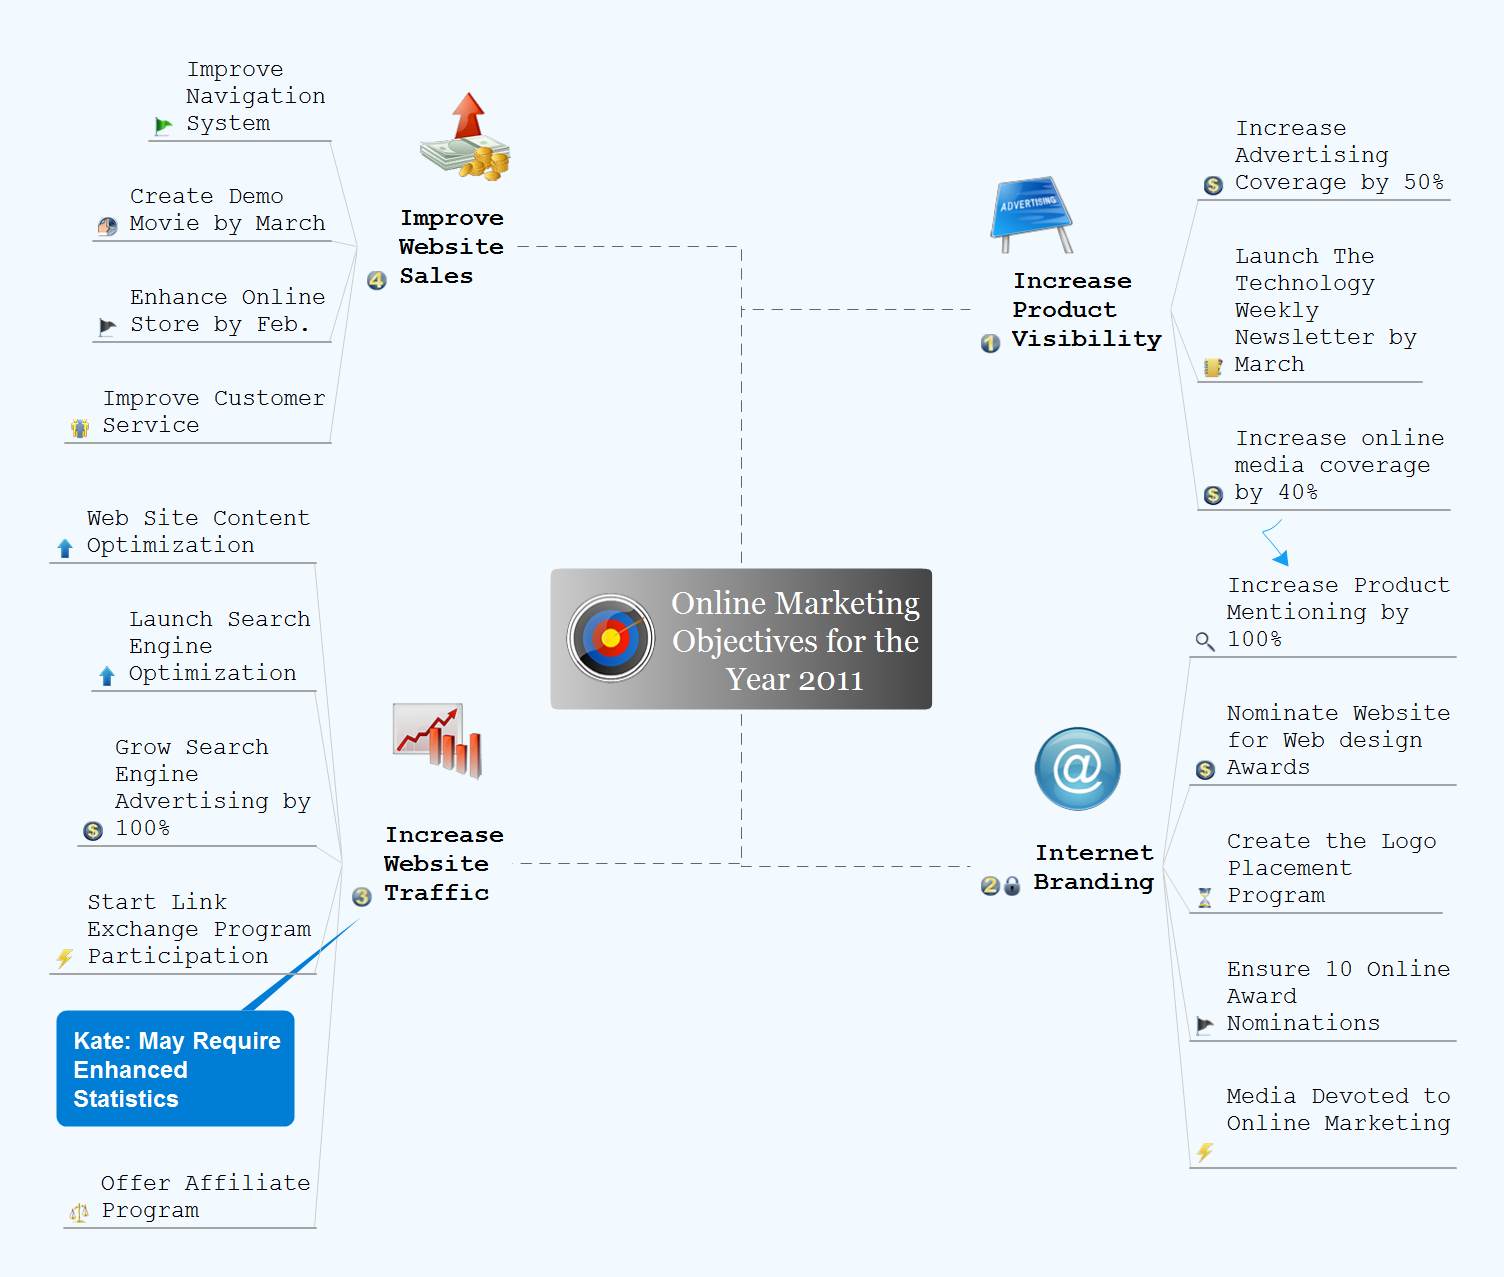
Picture: Evernote + MindMapping
Related Solution:
ConceptDraw DIAGRAM diagramming and vector drawing software as a sequence diagram tool provides the Rapid UML Solution from the Software Development Area that contains the UML Sequence library.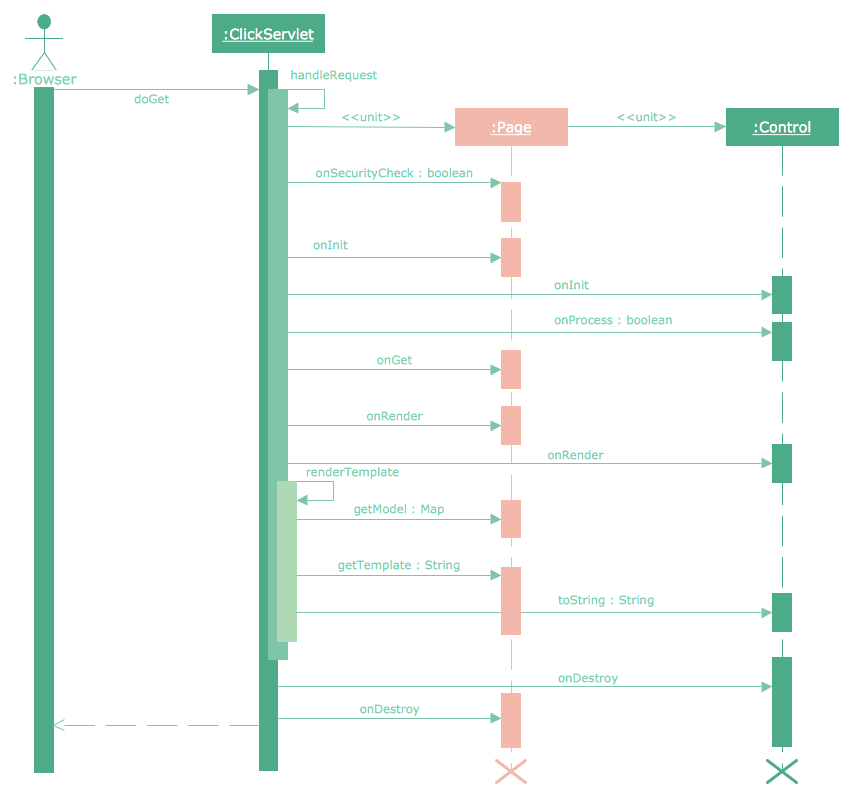
Picture: Sequence Diagram Tool
Related Solution:
A model of a system is defined as a set of hierarchical diagrams representing the asynchronous process of data transformation from the moment it is input to the system to the moment it is output to the user. To demonstrate how a process transforms the initial data, you should design a data flow diagram using a DFD Library included in ConceptDraw DIAGRAM Solution Park. Start your diagramming experience now!
You can use this library of symbols related to data flow diagrams (DFD) to design data-oriented or process-oriented models along with data process diagrams. This vector objects library It is a part of ConceptDraw solution designed for data flow diagramming, along with corresponding samples and templates. A data flow diagram is a 2D flowchart that depicts the sequence of particular activities and operations operations and activities which is accompanied by the dynamic flow of some data.
Picture: Design Data Flow. DFD Library
Related Solution:
ConceptDraw DIAGRAM enhanced with Flowcharts Solution is the best flow chart maker online design software. Use it to ✔️ create clear and actionable Flowcharts, ✔️ improve decision-making, ✔️ enhance problem-solving in various scenarios, ✔️ enhance creativity and productivity across industries, ✔️ streamline workflows
Picture: Flow Chart Online
Related Solution:
Create your own flow charts of computer or network system account processing using the ConceptDraw DIAGRAM.
Picture:
Account Flowchart
Flowchart ExamplesRelated Solution:
ConceptDraw DIAGRAM diagramming and vector drawing software supplied with Chemical and Process Engineering Solution from the Industrial Engineering Area of ConceptDraw Solution Park is powerful and effective process engineering software.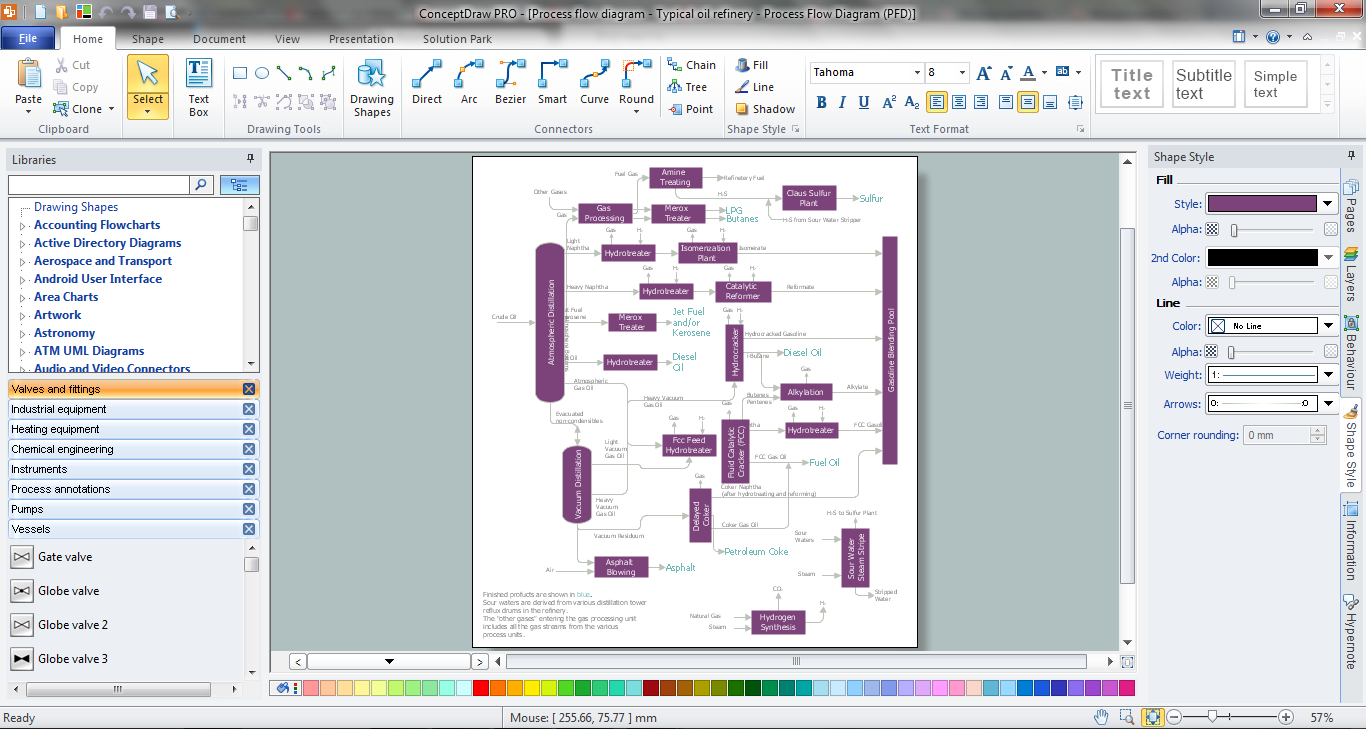
Picture: Process Engineering
Related Solution:
Communication is the main challenge and the key success factor for organizational project management in company with remote projects. Communicating visually via Skype you bring all projects together to achieve corporate goals.
Picture: Remote Projects in Corporate Strategy
Related Solution:
Now the problem of complexity the Cause and Effect Fishbone Diagram creating is solved thanks to the ConceptDraw DIAGRAM diagramming and vector drawing software extended with Fishbone Diagrams solution from the Management area.
Picture: Cause and Effect Fishbone Diagram
Related Solution:
ConceptDraw DIAGRAM software is the best Mac diagramming software for drawing any type of diagrams. Its rich set of samples and templates, and specific features to draw with great visual appeal on Mac OS X.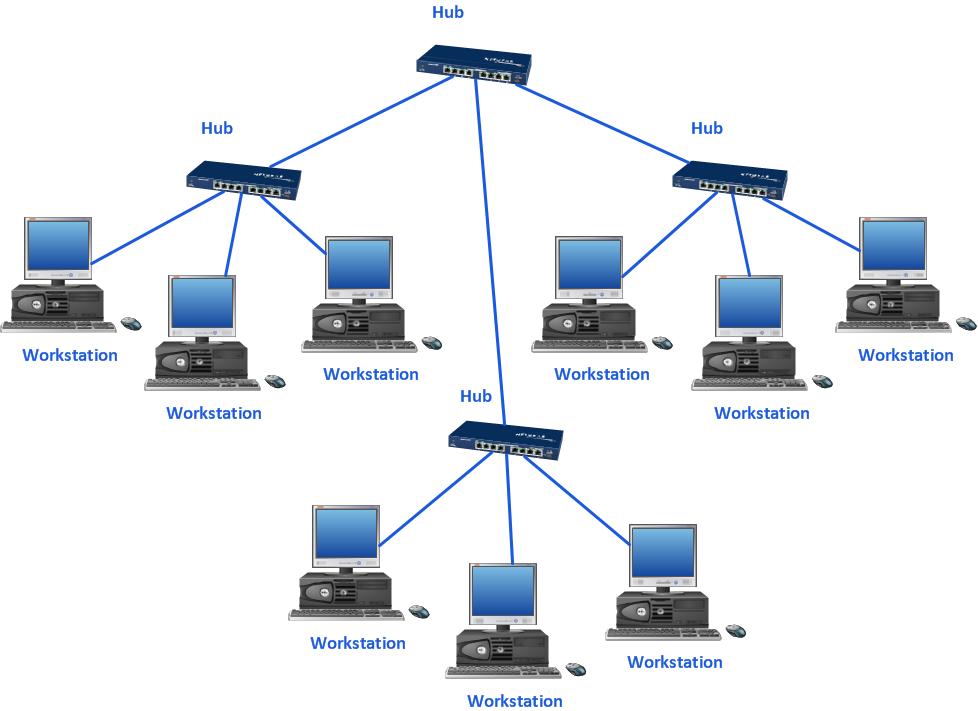
Picture: Mac Diagramming Software
Electrical Engineering Solution used together with ConceptDraw DIAGRAM drawing facilities makes short a work of drawing various electrical and electronic circuit schemes. A library of vector objects composed from symbols of Analog and Digital Logic elements of electric circuit includes 40 symbolic images of logic gates, bistable switches of bi-stable electric current, circuit controllers, amplifiers, regulators, generators, etc. All of them can be applied in electronic circuit schemes for showing both analog and digital elements of the circuit.
Electrical Engineering Solution used together with ConceptDraw DIAGRAM drawing facilities makes short a work of drawing various electrical and electronic circuit schemes. A library of vector objects composed from symbols of Analog and Digital Logic elements of electric circuit includes 40 symbolic images of logic gates, bistable switches of bi-stable electric current, circuit controllers, amplifiers, regulators, generators, etc. All of them can be applied in electronic circuit schemes for showing both analog and digital elements of the circuit.
Picture:
Electrical Diagram Symbols F.A.Q.
How to Use Electrical ConceptDraw Diagram Software
Related Solution:
ConceptDraw
MINDMAP 16