
The UML use case diagram template "System of goods selling via catalogues" is created using ConceptDraw DIAGRAM diagramming and vector drawing software enhanced with Rapid UML solution from ConceptDraw Solution Park.

Rapid UML solution provides templates, examples and libraries of stencils for quick and easy drawing the all types of system and software engineering diagrams according to UML 2.4 notation.
Use ConceptDraw DIAGRAM with UML use case diagram templates, samples and stencil library from Rapid UML solution to visualize a higher-level view of the system for modelling the functionality and behavior.


TEN RELATED HOW TO's:
Near field communication (NFC) is a wireless communication technology that allows smartphones and other similar devices to establish the radio communication with each other on the short distance around 10 centimeters (4 inches).
This example was created in ConceptDraw DIAGRAM using the Computer and Networks Area of ConceptDraw Solution Park and shows the Near field communication (NFC) network.
Picture: Near field communication (NFC). Computer and Network Examples
Related Solution:
The Sales Process is a complex approach for selling a product or service which assumes many steps including the sales planning, realization of the sales marketing and management strategies, sales process analysis, etc. Now we have a ConceptDraw DIAGRAM software extended with unique Sales Flowcharts solution from the Marketing area of ConceptDraw Solution Park which ideally suits for the planning and realization the company's sales process.
Picture: The Sales Process
Related Solution:
The new Value Stream Mapping solution found in the ConceptDraw Solution Park continues to extend the range of ConceptDraw DIAGRAM into a business graphics tool.
Picture: Value Stream Diagram
Related Solution:
The vector stencils library COM and OLE from the solution Software Engineering contains 15 symbols of the COM and OLE objects for ConceptDraw DIAGRAM software.
Picture: COM and OLE Diagram
This sample was created in ConceptDraw DIAGRAM diagramming and vector drawing software using the UML Use Case Diagram library of the Rapid UML Solution from the Software Development area of ConceptDraw Solution Park.
Picture: Sample for UML
Related Solution:
ConceptDraw gives the ability to draw Flowchart documents. Flowcharts solutionis a powerful tool that extends ConceptDraw application for drawing business flowcharts.
ConceptDraw DIAGRAM vector diagramming and business graphics software enhanced with with templates, green and interactive flowchart makers, samples and stencil libraries from ConceptDraw Solution Park which all focused to help with drawing flowcharts, block diagrams, bar charts, histograms, pie charts, divided bar diagrams, line graphs, area charts, scatter plots, circular arrows diagrams, Venn diagrams, bubble diagrams, concept maps, and others.
Picture: The Best Flowchart Software Available
Related Solution:
Data Flow Diagram is used to depict the flow of data through the system, where it enters and exits the system, as well as where it is stored. To simplify the process of drawing a data flow diagram (DFD), ConceptDraw DIAGRAM provides a DFD Library - design elements that will help you make your diagram as informative, streamlined and understandable as possible. Data flow diagrams are useful to create a general overview of the system or to document major data flows.
Here are the library of symbols used in data flow diagrams (DFD). Data Flow diagrams are graphic means of business process visualization. Any business process may involve the data transfer. It can be easily shown using data flow diagrams. DFDs are used to represent the processing and transformation of data within a business process. One can find out the Vector library of DFD symbols, that is a component of ConceptDraw solution for Data Flow Diagramming and is welcome to use in as addition to the common Conceptdraw DIAGRAM diagramming facilities.
Picture: DFD Library — Design elements
Related Solution:
Learn what a workflow diagram is, how it works, when to use it, and how to create one. See examples, handoffs, approval flows, and workflow diagram best practices.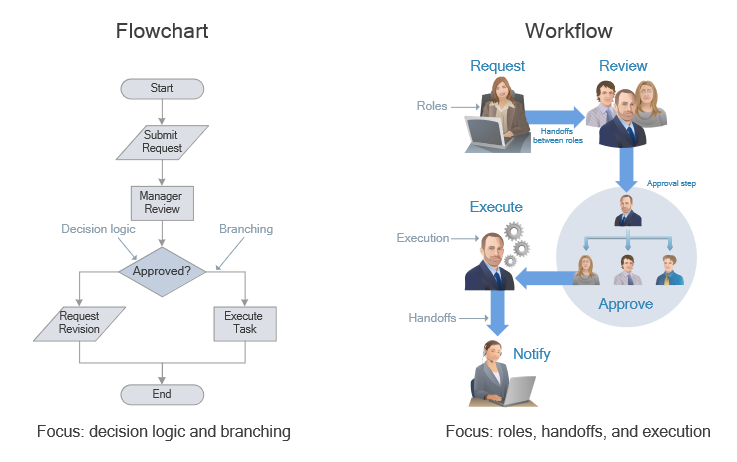
Picture: Workflow Diagram: Definition, Examples, and How to Create
Related Solution:
This will let you create professional diagrams and charts using its simple RapidDraw option just in clicks. Take a look on a diagram you are looking for and create it fast and quickly.
Picture: Powerful Drawing Feature for Creating Professional Diagrams
In ConceptDraw DIAGRAM it really is sp simple to draw even the most complex cross-functional flowcharts. Use the RapidDraw technology and Cross-Functional libraries in ConceptDraw DIAGRAM for the best results.
Picture: How to Simplify Flow Charting — Cross-functional Flowchart
Related Solution:


