UML Use Case Diagram Example - Taxi Service
This sample was created in ConceptDraw DIAGRAM diagramming and vector drawing software using the UML Use Case Diagram library of the Rapid UML Solution from the Software Development area of ConceptDraw Solution Park.
This sample shows the work of the taxi service and is used by taxi stations, by airports, in the tourism field and delivery service.
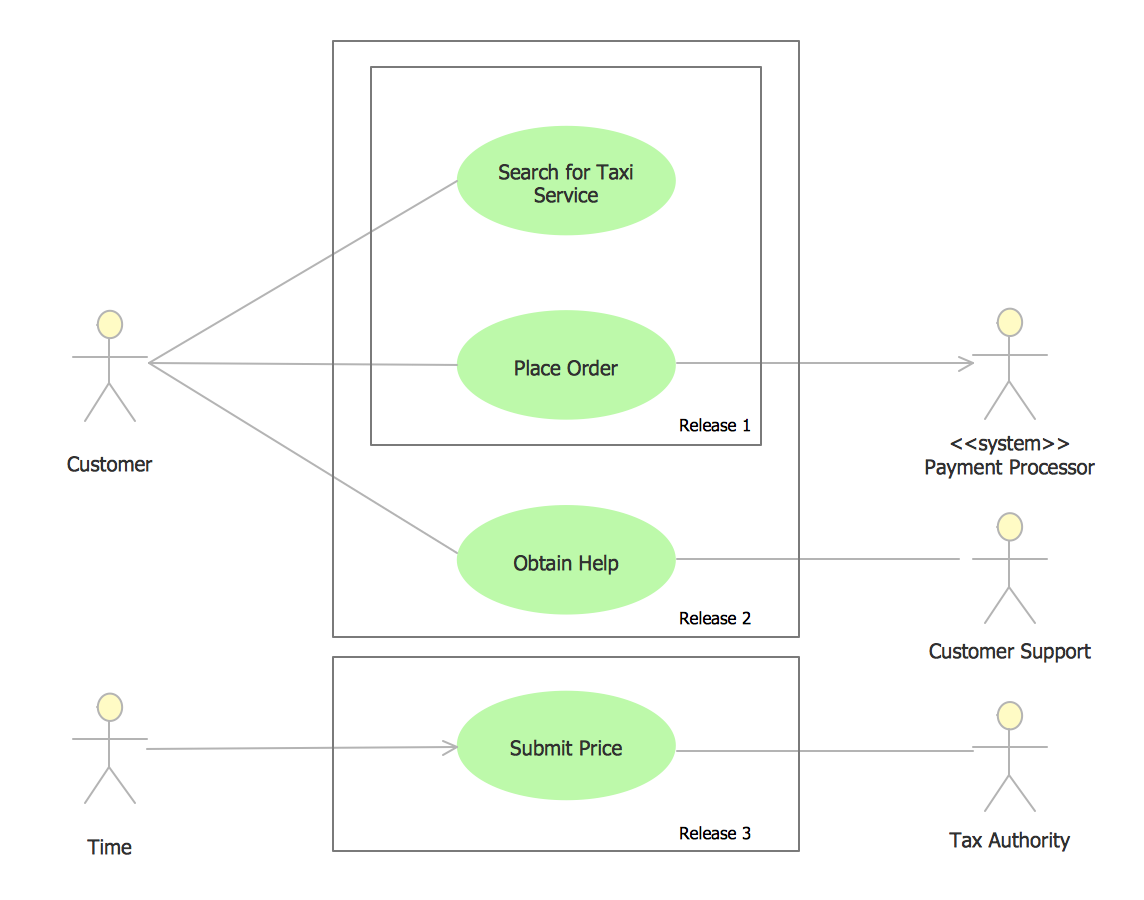
Example 1. Use Case Diagram Taxi Service UML
Using the libraries of the Rapid UML Solution for ConceptDraw DIAGRAM you can create your own visual vector UML diagrams quick and easy.
UML Resource:
- UML Software
- How to create a UML Diagram
- UML Diagram Examples
- Class Diagram
- Use Case Diagram
- Timing Diagram
- Interaction Overview Diagram
- Communication Diagram
- State Machine Diagram
- Activity Diagram
- Deployment Diagram
- Package Diagram
- Collaboration Diagram
- Object Diagram
- Sequence Diagram
- Composite Structure
- Component Diagram
NINE RELATED HOW TO's:
ConceptDraw DIAGRAM is a powerful software that helps you create professional and easy drawing diagrams for business, technology, science and education.
Picture: Create Sophisticated Professional Diagrams - Simply
The Rapid UML solution from Software Development area of ConceptDraw Solution Park includes 13 vector stencils libraries for drawing the UML 2.4 diagrams using ConceptDraw DIAGRAM diagramming and vector drawing software.
Picture: Design Elements for UML Diagrams
Related Solution:
UML Timing Diagram as special form of a sequence diagram are used to explore the behaviors of objects throughout a given period of time.
ConceptDraw has 393 vector stencils in the 13 libraries that helps you to start using software for designing your own UML Diagrams. You can use the appropriate stencils of UML notation from UML Timing library.
Picture: UML Timing Diagram, Design Elements
Related Solution:
If your company is in chaos in clutter and no one understands their rights and responsibilities, maybe it's time to change that. One of the ways to put the company in order is to draw an organization chart that would reflect the structure and show the relationships among departments and positions. This is a very useful and easy to understand scheme.
This is example of the one of the most typical kind of organizational chart. It depicts an organizational structure of the hierarchical type. Its construction is similarv to pyramid. The single main position on the top - in this case, the mayor's position followed by sub-levels of authority in his command. Each position in the pyramid reports only to his supervisor, and takes only a report of direct subordinates. Such scheme limits the number of communications. This organizational structure is effectively used in public organizations. Also it is suitable for any organization with the need for multiple levels of middle managers. The ability to create organizational charts of different types is supplied with ConceptDraw Ogrcharts solutions.
Picture: How to Draw an Organizational Chart
Related Solution:
This UML activity diagram shows the abstract example of orchestration of service-oriented business process. Orchestration is the method for composition the hierarchical and self-contained service-oriented business processes. It is coordinated by the single agent.
This sample was created in ConceptDraw DIAGRAM diagramming and vector drawing software using the Rapid UML Solution from the Software Development area of ConceptDraw Solution Park.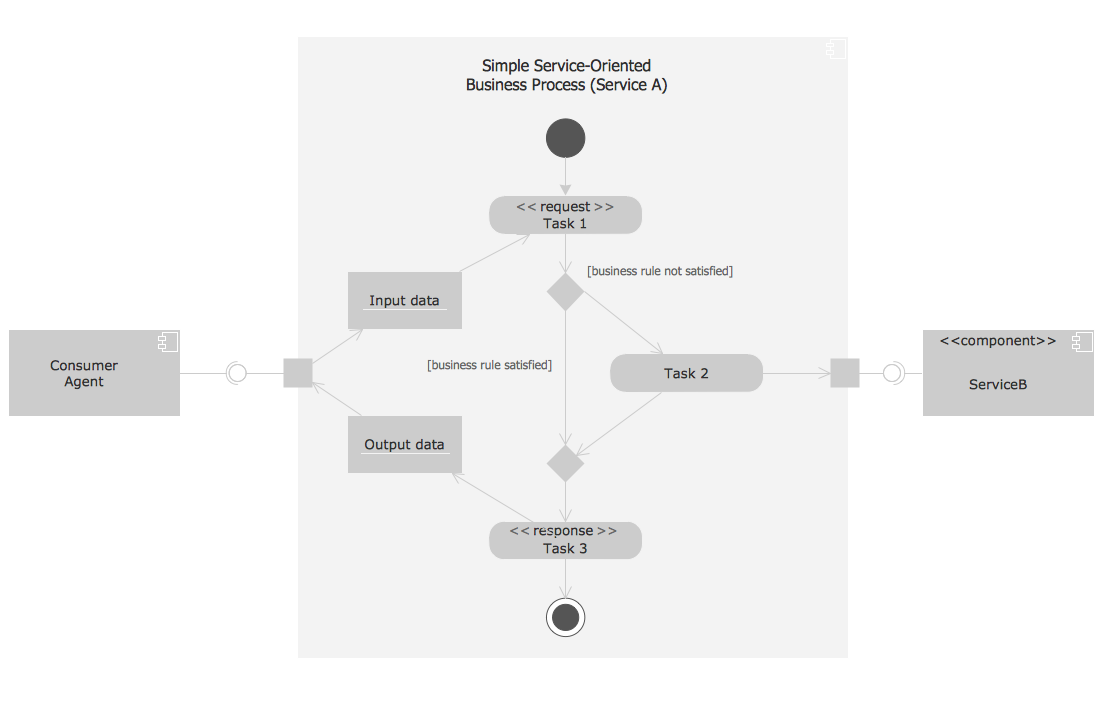
Picture: Process with UML
Related Solution:
You can use many tools to create a representation of a system behavior or a scheme of objects relationships. Some of them are quite abstract and useless, and some, like UML tools help clarifying both the structure and the behavior of a system. There are various types of uml diagrams and tons of examples explaining the difference between them.
UML 2.2 specification has many kinds of diagrams. They are divided into two groups( structure and behavior diagrams). This class diagram shows the hierarchical structure of UML 2.2 specification. Class diagram - the most suitable tool for this task because it is designed to describe basic structure of a system. This diagram can be use as a visual aid for learning UML.
Picture: UML Tool & UML Diagram Examples
Related Solution:
The world-best Entity Relationship Diagram software suitable for professional ERD drawing is ConceptDraw DIAGRAM software extended with the Entity-Relationship Diagram (ERD) solution. This solution contains all libraries, templates and samples you may need for professional ERD drawing.
Picture: Entity Relationship Diagram Software
Related Solution:
Audit procedures are the specific tests and methods that auditor executes when gathering the evidence which are necessary for making an opinion on the financial statements of the firm. There are three types of audit procedures: data selection, reliability validation, relevance confirmation.
Thanks to the extensive drawing tools which provides the Audit Flowcharts solution from the Finance and Accounting area of ConceptDraw Solution Park, you can easy and effectively develop and realize various audit procedures.
Picture: Audit Procedures
Related Solution:
Also included are standardized hr flowchart symbols, meaning your diagrams will be relevant and understood by all business associates.
Picture: HR Flowchart Symbols
Related Solution:
ConceptDraw
DIAGRAM 18