Workflow Diagram Data
Data flow
ConceptDraw DIAGRAM is a workflow diagram software contains specific features help you to draw diagrams faster, such as RapidDraw, or Arrows10. There is also a rich set of samples and templates to give you an example of data may be visualized as workflow diagram.
ConceptDraw DIAGRAM is a software for simply depicting the workflow diagram. The Workflow Diagrams solution contains pre-designed libraries and templates. This type of diagrams represents the transferring of data, documents, and tasks during performance of a work process.

Pic.1 Workflow diagram sample.
This example shows a workflow diagram that clearly illustrates stages a business consists of and relations between all parts of business.
See also Samples:
TEN RELATED HOW TO's:
When searching for a diagramming tool, we look for a powerful and reliable software that would be easy to use. To mention one, ConceptDraw DIAGRAM has all the necessary features to create cross-functional flowcharts (Swim Lanes) quick and effortlessly. You can draw swim lane diagrams in both vertical and horizontal ways.
This cross-functional flowchart displays a payroll process. It explains to each participant his role in the process depending on the category, represented with swimlanes. Using this flowchart, every employee can easily find out what he can expect in terms of salary. Generally a cross-functional diagram enables one to take a look at processes with a wider scope and with more precision than simple flowchart. Business process capturing using cross-functional flowcharts can be useful for stakeholders and managers to define clearly the staff's roles and responsibilities.
Picture: Cross-Functional Flowchart (Swim Lanes)
Related Solution:
Use the advantages of hierarchical tree structure of mind map while developing the organizational structure of your organization. Create an Organizational Chart from your map. Double click the icon to create an Organizational Chart.
The diagram is created automatically from the active page of your map by ConceptDraw DIAGRAM and will be opened in Slideshow mode.
Picture: Organizational Chart
Related Solution:
It can be tough to get straight into business papers and processes.Otherwise, you can learn how to create flowcharts for an accounting information system and visualize these documents. Accounting diagrams are clear and easy to understand for all the participants of the process.
There are symbols used for creating accounting flowcharts using ConceptDraw DIAGRAM and its Accounting Flowcharts solution. Accounting flow charts are a special kind of flow charts. Actually a variety of flowcharts are often used to facilitate many aspects of a workflow of accounting department. Accounting flowcharts are utilized to support creating accounting documentation, to depict positions responsible for fulfillment of each phase of accounting workflow.
Picture:
How to Create Flowcharts for an
Accounting Information System
Related Solution:
The Building Plans area of ConceptDraw Solution Park includes a set of solutions of Interior Design. The Interior Design solutions for ConceptDraw DIAGRAM allow you simply and quickly create the professional looking Building Plans that will help you to design, redesign your room, flat, home, office, cafe or any other building. Having the ready plan of the rooms you can easy rearrange the furniture, interior objects on the plan and see the future result at once.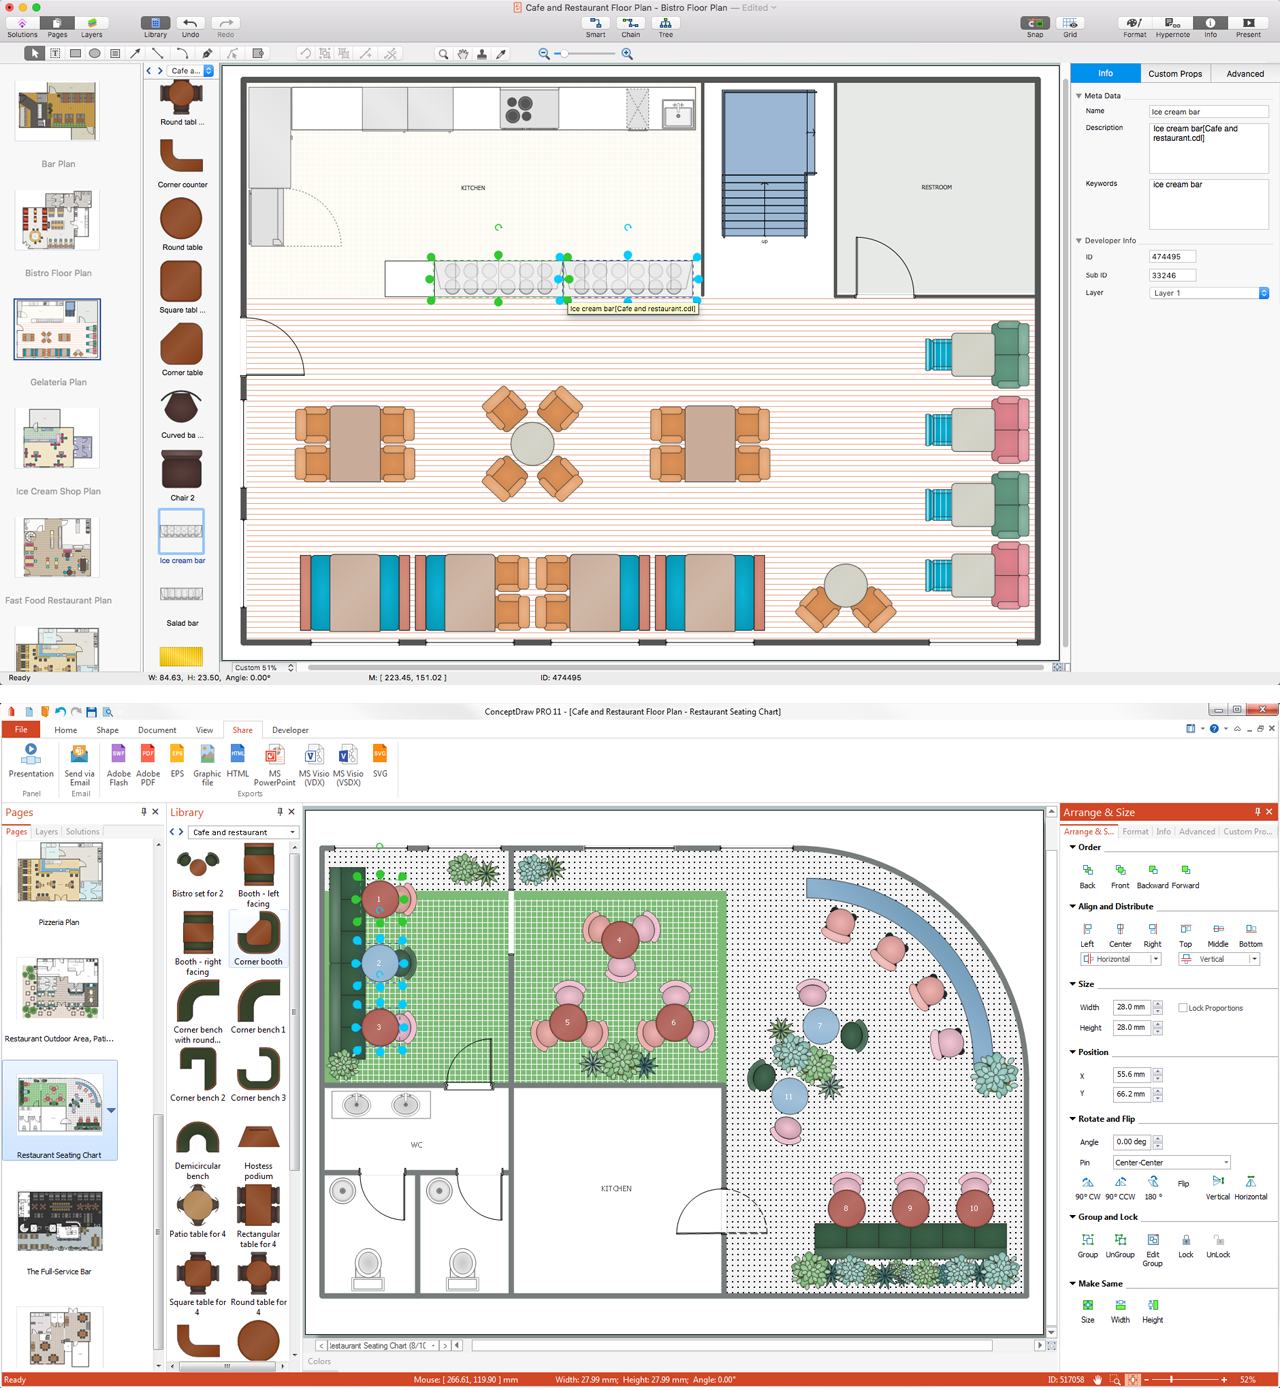
Picture: Interior Design Software. Building Plan Examples
Related Solution:
Flow charts are used in chemistry to draw chemical processes. ConceptDraw DIAGRAM software extended with Chemical and Process Engineering solution is the easiest for using a multifunctional diagramming tool, which will help to create a Flow Chart in chemistry, Chemistry diagrams of any type, and Chemistry flow diagrams with ease. You can illustrate any chemical processes in a few minutes, including refinery processes, distillation, the release of natural gas condensate, and many more.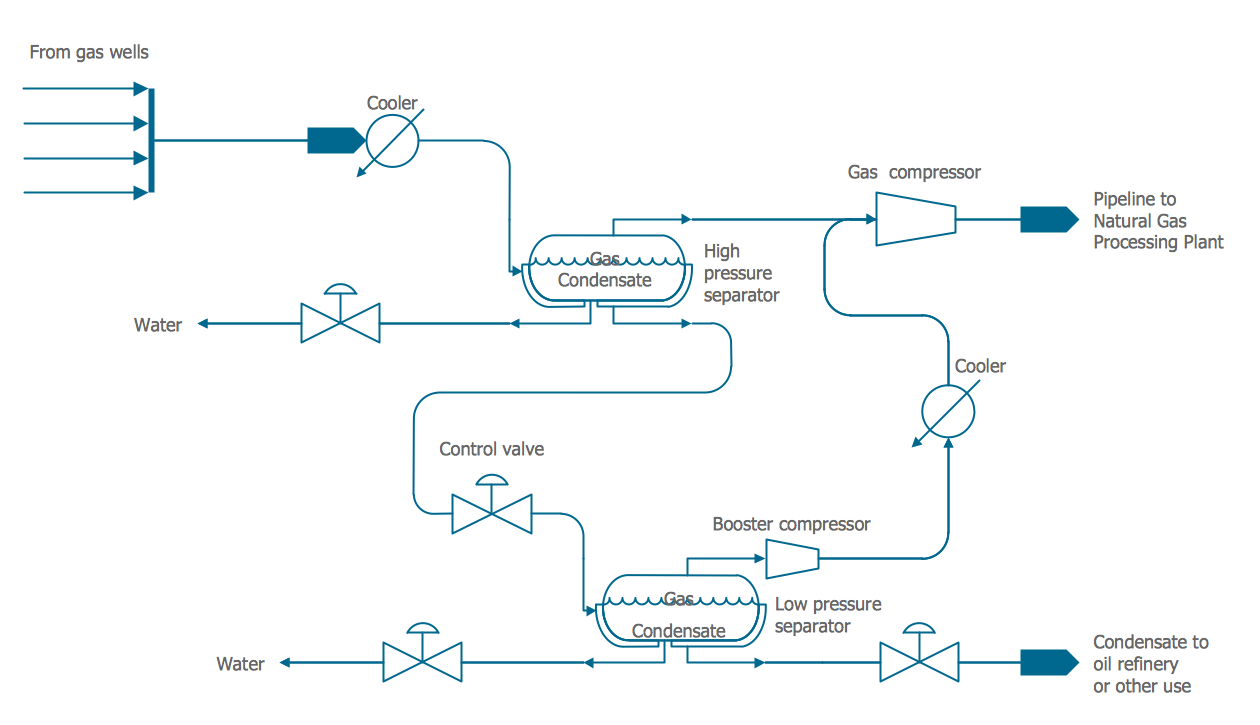
Picture: Flow Chart in Chemistry
Related Solution:
To draw a good diagram of a business workflow you should have a ready-to-use set of pre-designed objects you may drag-and-drop to your document focusing on the workflow structure and meaning, not drawing tools. ConceptDraw DIAGRAM with Workflow Diagrams solution provides complete set of design element you may use to draw a good diagram of a business workflow.
Picture: How to Draw a Good Diagram of a Business Workflow?
Related Solution:
Using Skype for Business will let you control teams and deliver information worldwide in a real-time. This is an important tool for everyday work.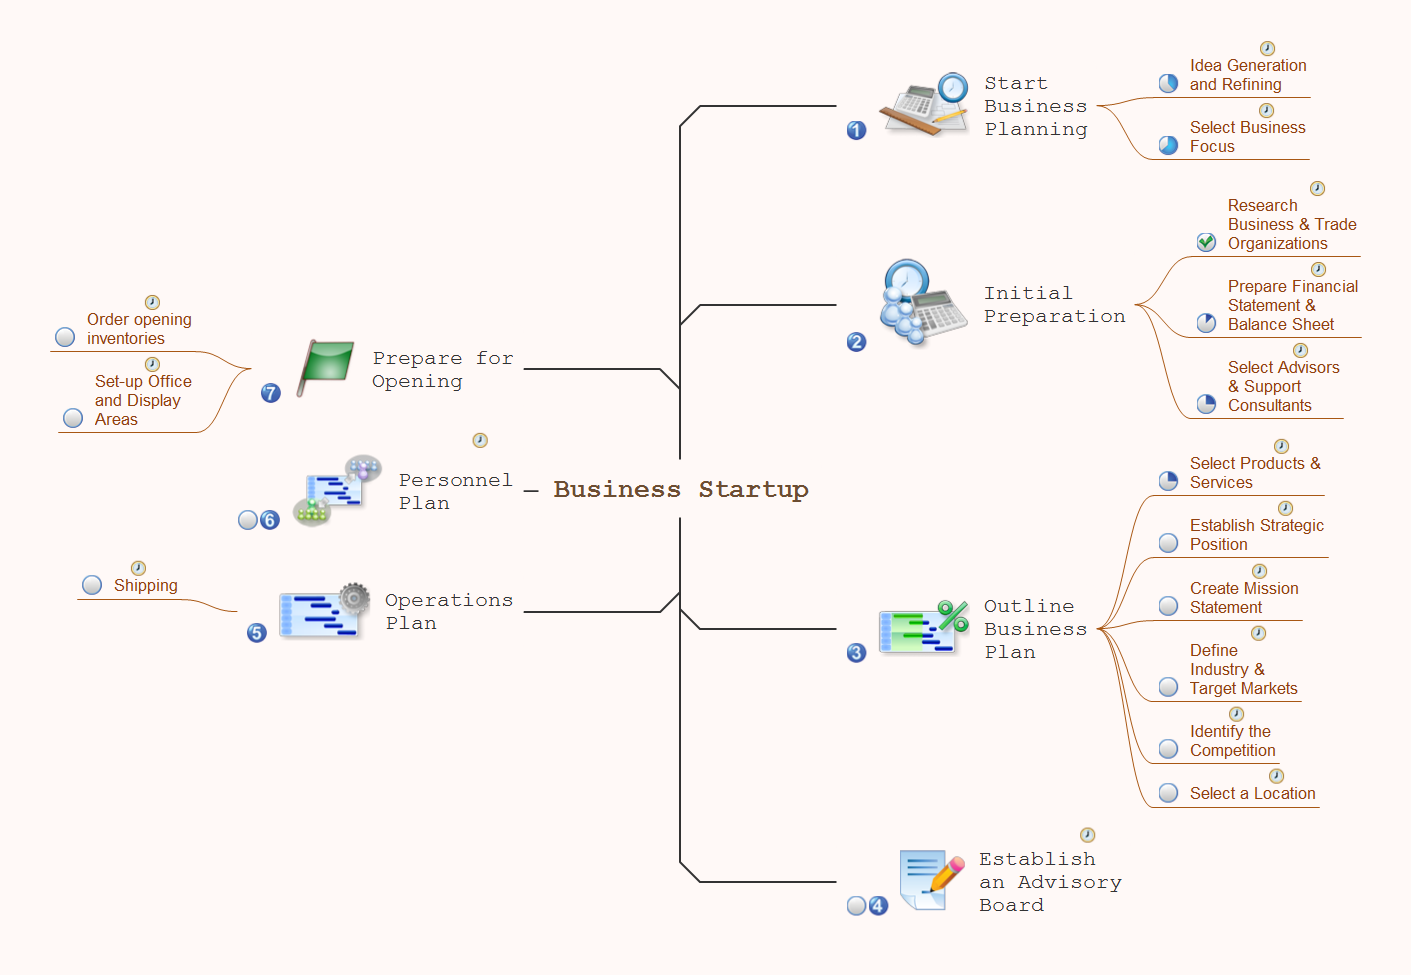
Picture: How To Use Skype for Business
Related Solution:
ConceptDraw has 142 vector stencils in the 8 libraries that helps you to start using software for designing own Business Process Diagrams. Use Swimlanes library with 20 objects from BPMN.
Picture: Business Process Elements: Swimlanes
Related Solution:
ConceptDraw Business Finance Illustration examples and libraries contain vector clip art for drawing different Business and Finance Illustrations. You may find Advertising example, Project Management example, Business Model example and many more.
Picture: Business and Finance Illustrations Example
Related Solution:
Use ConceptDraw DIAGRAM software with Flowcharts Solution to create Process Flow Charts, Flow Chart Process Maps, and High-Level Process Flow Charts to illustrate ✔️ high-level processes in industrial, chemical, and process engineering, ✔️ major plant processes, ✔️ minor details
Picture: Process Flow Chart
Related Solution:
ConceptDraw
DIAGRAM 18