What is an Organizational Chart and how it works?Organization Chart Software
Organizing process is the process of creating the organizational structure of an enterprise. The organizing process consists of several stages. First, you need to divide the organization into departments, respectively to strategies, and then establish relationships of authority. After that, managing director delegates his rights and authorities. Delegacy is the transfer of the tasks and powers of the person who assumes responsibility for their implementation. If the leader does not delegate tasks, then he should do them. Staff authority is an advisory, personal apparatus e.g. presidential administration, which has no hierarchy. Organization structure is an important part of organizing process and there are many tools to facilitate that.
What is Organizational Chart?
Competent organogram structuring can significantly improve the efficiency of the organization or department. Organization chart is a diagram displaying organization posts written in boxes and arrows, connecting them and showing the subordination of positions and relations between company departments and workers. Organizational chart should be a proactive management tool, not a reactionary. It shouldn’t reflect the current hierarchy and chain of command in the company, but the one which is more consistent with the goals of the company. Therefore, this scheme should be developed by senior management, in cooperation with the HR department, discussed with the heads of key departments. Such a diagram should be the goal to which the organization wants to strive to improve the effectiveness of their work.

Example 1. Organizational Chart
Importance of Organizational Charts in Business
Organizational charts offer a number of advantages to businesses. They provide a clear structure of a business and organization, understanding the hierarchy in the workplace. This improves communication across team members and different departments, efficiency of communication, and work across the entire organization. Organizational charts give the understanding of which employees are involved in a project, who is the project manager, which place occupies each employee in this hierarchy, who is the immediate supervisor to whom, and explain the roles and responsibilities of each employee. This also facilitates greatly the onboarding of new employees.
Organizational charts improve decision-making and make it more efficient. They help in resource allocation and alignment of goals, influence the productivity and profitability of the organization. All these factors and abilities lead to enhancing productivity and job satisfaction, the organization’s responsiveness and competitiveness, streamline the process of aligning efforts and goals in one direction.
Organizational charts facilitate business growth. They help businesses to implement efficient decision-making processes and achieve company goals and objectives. Organizational structures accelerate processes in the workplace and are an important tool to boost employee productivity. They help to organize the workforce, keep track of human resources, clarify roles and authorities, easier the search for people to implement the right task, prevent overlapping and duplication of work, help you identify gaps in skills, bottlenecks, and reduce potential conflicts or misunderstandings within the team, supports company's reorganization and restructuration.

Example 2. Organogram Design in Org Chart Builder
Benefits of Organizational Charts
Organizational charts offer many benefits to employees and high management in enterprises and businesses, and other stakeholders:
give the overview of the enterprise's hierarchy, relationships, roles, responsibilities, and reporting structure;
provide the information in a structured form;
visualize employees’s tasks and each one can see their role;
improve collaboration, communication, and flow of information;
enable workforce planning, restructuring, and planning for future growth;
support great new hire onboarding;
help to manage workload;
motivate employees;
make planning easier.
Visual Representation of Structure
One of the benefits of an Organizational chart is its ability to provide a visual representation of the hierarchical structure, functions, and relationships in an organization of any size and direction. The clear structure simplifies the organization of efficient work, helps in project or process managing a company, assists in establishing communication and ensures coordinated teamwork. It supports a company in efficient problem-solving and decision-making, simplifies onboarding new employees through getting to know the company's structure and colleagues even before meeting them. Organizational chart clarifies who is reported to whom in a hierarchy and who to contact to resolve different issues.
Organizational chart can have a vertical or horizontal representation of the company structure. Boxes, arrows, and lines display a team and make connections and relationships in the company visible. Generally, there are three types of organizational charts. The most popular is a hierarchical organizational chart structure similar to a pyramid, where one person or group is at the top and all other elements have less authority or power and are placed at lower levels. At the same time, when employees have more than one superior, the matrix organizational chart is more useful. The flat organization chart, also called a horizontal organization chart usually includes only managers and employees, and all they have exceptionally high level of responsibilities in the company and are directly involved in strategic decisions making, and usually there are no high or middle management levels in such companies.

Example 3. Flat Organogram
It is convenient to design Organizational charts using a special structure chart maker or professional organizational structure creator. If the organization is too large, the chart can be divided into smaller ones. Organogram must clearly show the company's hierarchy and subordination structure. One of the largest threats to the company's performance is the double subordination of employees. It is important to comply with horizontal layers of the chart. Employees of the same status shall be placed on the same horizontal line, even if some of them directly subordinate to the supreme manager, and some to the interim manager. This allows employees to forge interagency communication on their horizontal level more effectively, helping to communicate with people endowed with the same amount of responsibility. The lack of qualitative interaction between departments reduces the efficiency of the company.
Clarification of Roles and Responsibilities
Responsibility is a commitment to carry out existing tasks and be accountable for their satisfactory result, which can’t be delegated. The authority is a limited right to use the organization's resources and to direct the efforts of its staff to perform certain tasks, which is delegated to a position, not to the person who holds the position. There are two types of authority: line and staff. Line authority creates a hierarchy of levels of control, where instructions are transferred directly from a manager to a subordinate and then to the other employee. Organizational Chart is an efficient tool to outline the roles and responsibilities of employees.
Improved Communication
Communication within an organization is a fundamental and really important point. Organizational charts visually represent the organizational structure within a company and provide insights into the roles and responsibilities of the employees, communication, and ways to improve it. Understanding the hierarchy within a company or an enterprise affects the improvement efficiency of communication across one team member, different teams, and even different departments.
Decision-Making and Accountability
Organizational charts enhance efficiency and speed up the decision-making process. Understanding everyone his role and defining expectations, reducing confusion and eliminating bottlenecks contribute to correct workload distribution, increasing the enterprise's efficiency, and helps in decision-making. Organizational charts help to capture the accountabilities and this is especially valuable for large organizations because the organizational accountability increases the company's transparency. It includes the information about company's values and goals, major functions within an organization and the primary roles of employees, areas of responsibility for accomplishing goals and completing assignments, and making decisions that respond to the company's expectations.

Example 4. Organizational Chart — WASO
Organizational Chart Software — How it Works
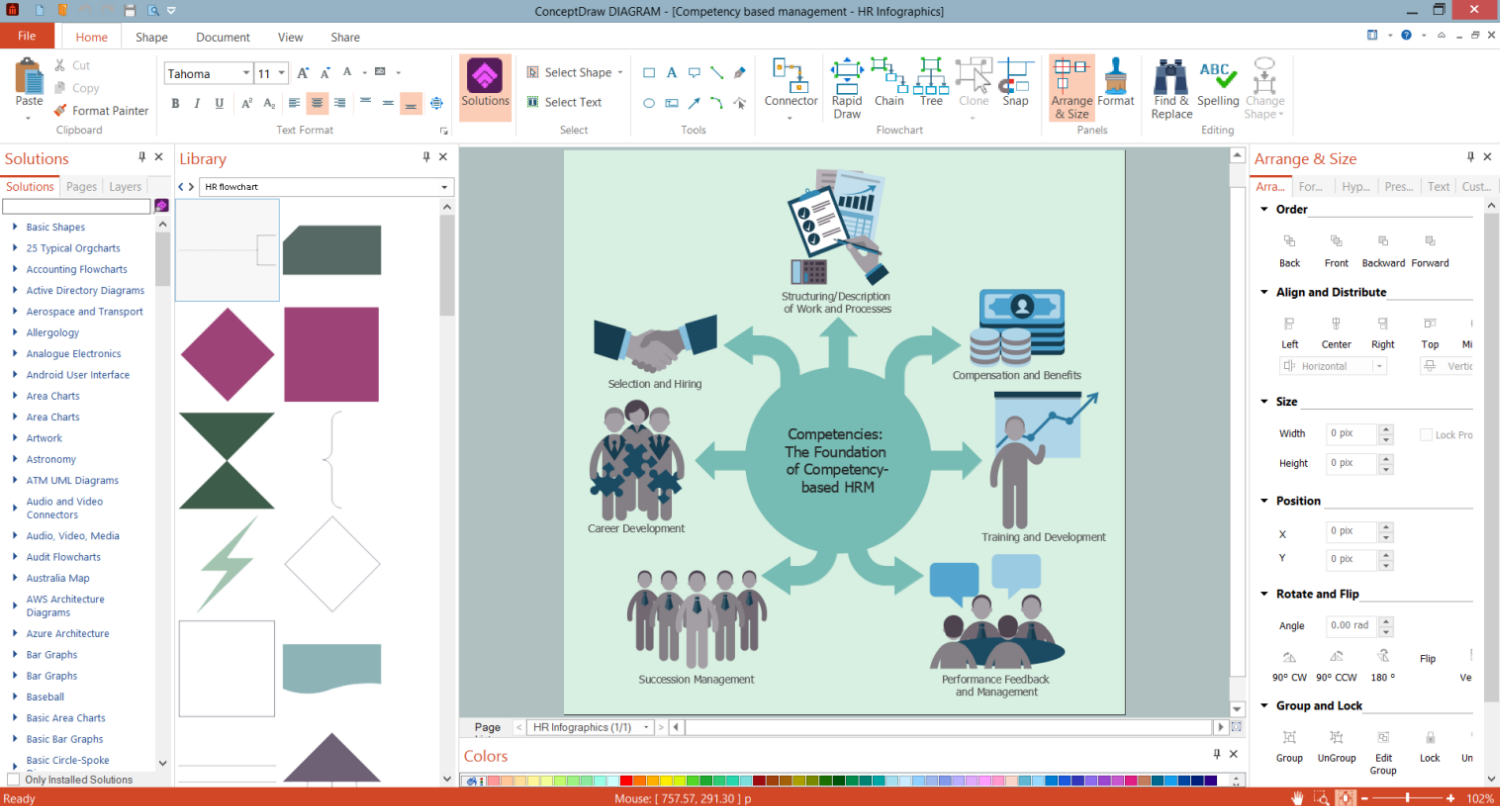
Specialized software to create Organizational charts is incredibly useful and time-saving. ConceptDraw DIAGRAM extended with Organizational Charts Solution from the Management Area is a powerful organogram and organization chart software. It allows you easy create different standard types of Organizational charts such as Horizontal Org Charts, Flat Org Charts, Inverted Org Charts, Matrix Structure Charts; Flowcharts, Timelines and much more!

Example 5. ConceptDraw DIAGRAM — Organogram and Organizational Structure Chart Maker
ConceptDraw STORE allows you to navigate the ConceptDraw Solution Park, manage downloads and updates, take the access to libraries, templates and samples. Organizational Charts Solution is available from the ConceptDraw STORE too.

Example 6. Organizational Charts Solution in ConceptDraw STORE
Summary
Organizational Charts Solution for org chart builder ConceptDraw DIAGRAM provides you with organizational chart tool including:
Wide variety of templates and samples,
Organizational Chart Library with large quantity of ready-to-use predesigned vector stencils
to help you quick and easy design your own Organograms and Organizational Charts.

Example 7. Organizational Chart Library Design Elements
Use actively the colors designing your Organograms and Organizational Charts. ConceptDraw DIAGRAM organizational chart maker offers you a huge color palette. Colored and bright Organograms and Organizational Charts have greater success!

Example 8. Organogram
The examples you see on this page were created in organizational chart maker ConceptDraw DIAGRAM using the tools of Organizational Charts Solution and demonstrate Organizational Charts and Organograms including the organogram of the management organization of the Eindhoven University of Technology. An experienced user spent 5 minutes creating this sample.
Use the Organizational Charts Solution for ConceptDraw DIAGRAM organization chart software to create your own Organograms of any complexity quick, easy and effective.
The Organograms designed with hierarchy chart maker ConceptDraw DIAGRAM are vector graphic documents and are available for reviewing, modifying, converting to a variety of formats (image, HTML, PDF file, MS PowerPoint Presentation, Adobe Flash or MS Visio), printing and send via e-mail in one moment.