Made with
ConceptDraw
MINDMAP 16

Physical Activity Plan

ConceptDraw Office

ConceptDraw Office is an integrated set of visualization products and document exchange technologies. ConceptDraw OFFICE consists of a diagramming platform, a mind mapping, and a project management tool. These tools are essential to generate business diagrams, mind maps, project plans, dashboards, presentations, schematics, and any other business visualizations. These tools have access to an online service, ConceptDraw Solution Park that will deliver additional product extensions in the future. This is a time saving assistant for generating your business documents and presentations.

ConceptDraw Office consists of a diagramming platform, a mind mapping, and a project management tool. These tools are essential to generate business diagrams, mind maps, project plans, dashboards, presentations, schematics, and any other business visualizations.

ConceptDraw MINDMAP Samples

Sample mind maps created in ConceptDraw MINDMAP that demonstrate the different capabilities and applications of the program for business, personal, or education use.

Mind map of a physical activity sample plan detailing a proposal to incorporate more physical activity into a college community.

Physical Activity Plan *

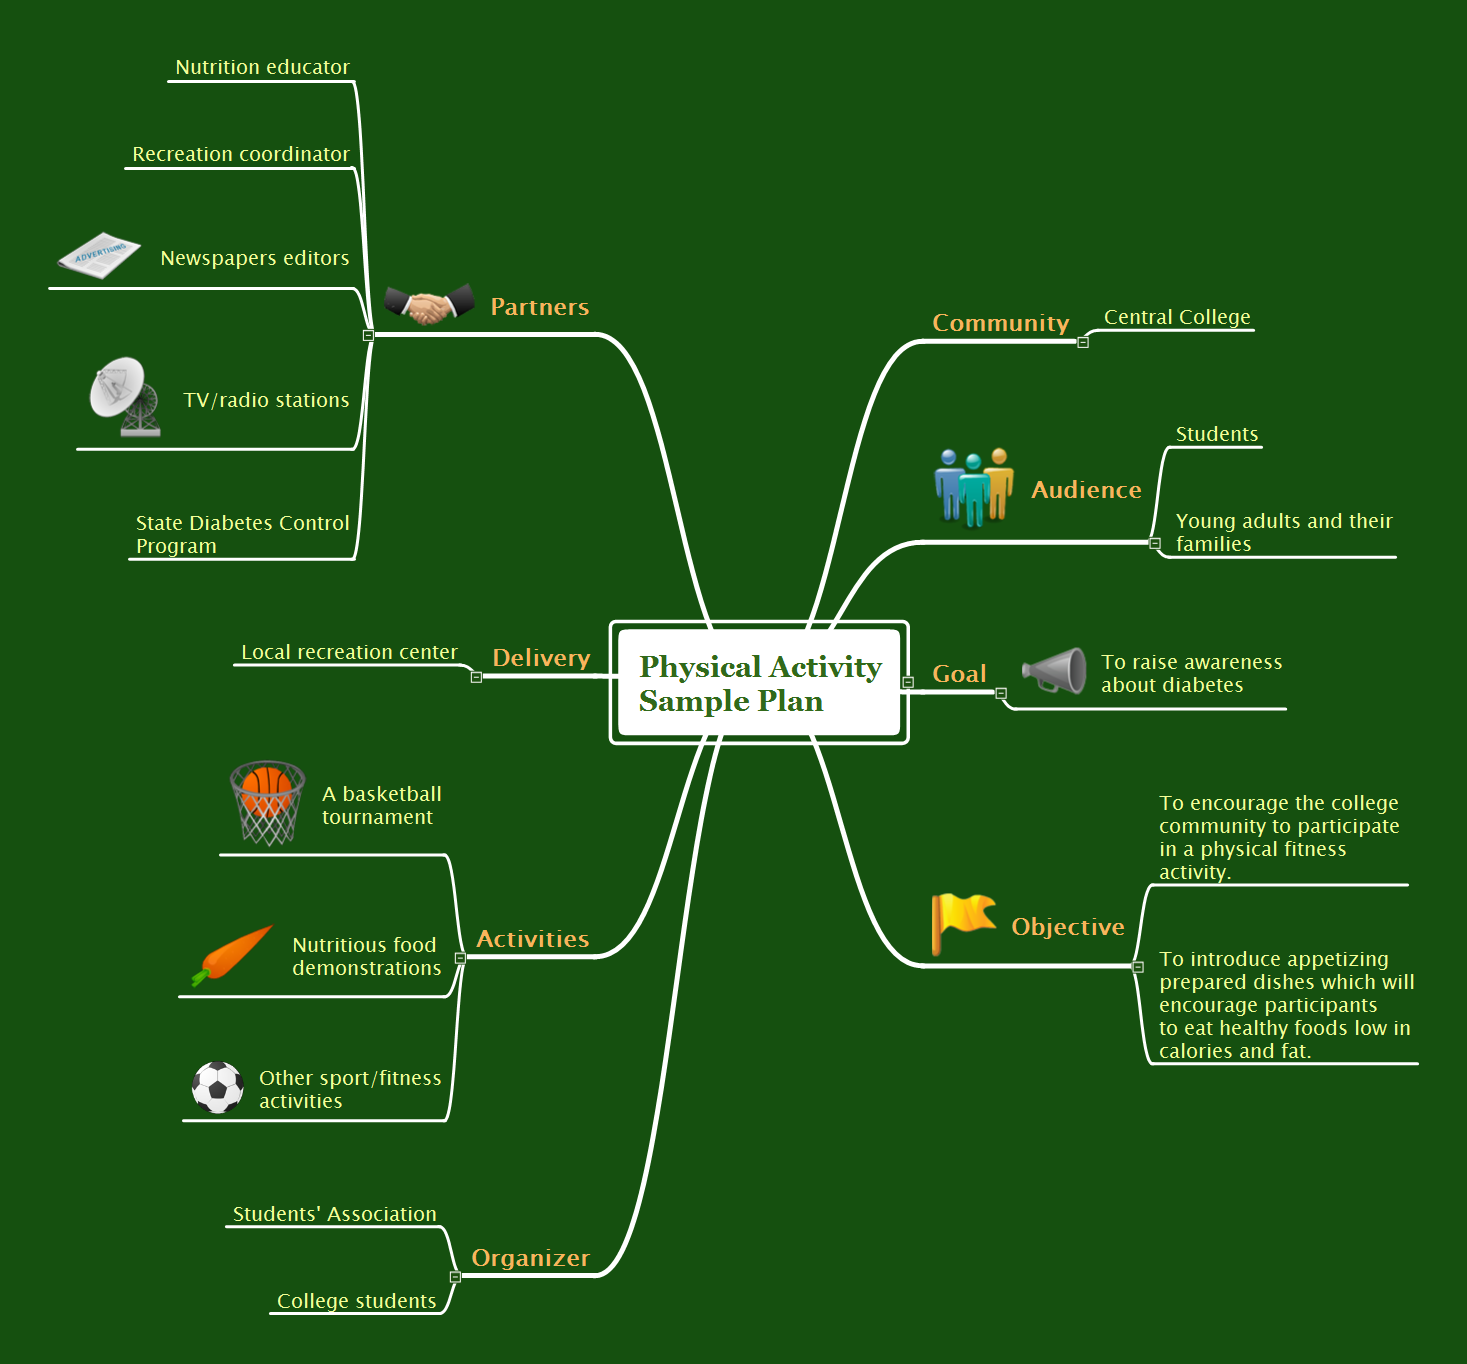
Example 1. Physical Activity Plan


Export to Outline


Physical Activity Sample Plan
    • Community
      • Central College
    • Audience
      • Students
      • Young adults and their families
    • Goal
      • To raise awareness about diabetes
    • Objective
      • To encourage the college community to participate in a physical fitness activity.
      • To introduce appetizing prepared dishes which will encourage participants to eat healthy foods low in calories and fat.
    • Organizer
      • Students' Association
      • College students
    • Activities
      • A basketball tournament
      • Nutritious food demonstrations
      • Other sport/fitness activities
    • Delivery
      • Local recreation center
    • Partners
      • Nutrition educator
      • Recreation coordinator
      • Newspapers editors
      • TV/radio stations
      • State Diabetes Control Program

The Benefits for ConceptDraw MINDMAP Brainstorming Software

  • ConceptDraw MINDMAP is effective for brainstorming, designing mind maps, idea generating, creative and lateral thinking, creativity and problem solving.
  • ConceptDraw MINDMAP is ideal for team and personal work in Business, Marketing and Project Management.
  • The libraries with large quantity of vector objects help to illustrate your mind maps and to make them bright, visual and comprehensible.
  • Use of View Navigator tool lets create presentations from a mind map: you can simply select the map parts you want to present, sequence your slides, and preview the presentation.
  • ConceptDraw MINDMAP provides wide capabilities of importing and exporting in various formats: Microsoft PowerPoint, Microsoft Word, MS Excel, Mindjet MindManager, image, HTML, PDF file.


EIGHT RELATED HOW TO's:
Computer networks nowadays are spread all across the world. The large number of parameters, such as geographic scale or communication protocols, can divide networks. One of the most common types of networks is called local area network (LAN). It convenient to represent network examples by means of diagrams. This local area network (LAN) diagram provides an easy way to see the way the devices in a local network are interacted. The diagram uses a library containing specific symbols to represent network equipment , media and the end-user devices such as computers (PC, mac, laptop) , network printer, hubs, server and finally a modem. There are two types of network topologies: physical and logical. The current diagram represents precisely a physical type of LAN topology because it refers to the physical layout of a local network equipment.Local area network (LAN) diagram
Picture:
What is a Local Area Network?
Examples of LAN Diagrams
Related Solution:
Risk Diagram (PDPC) - ConceptDraw OFFICE suite is a software for Risks Diagram making. This diagram identifies possible risks in accomplishing corrective actions. With the Risks Diagram, one analyzes each action separately in a tree of all actions and develops a preventive action in response of each potential obstacles or circumstances which may be a risk.CORRECTIVE ACTIONS PLANNING. Risk Diagram (PDPC) *
Picture: CORRECTIVE ACTIONS PLANNING. Risk Diagram (PDPC)
You want to make an infographic and need the useful and convenient drawing tools for this? In this case the ConceptDraw DIAGRAM software extended with Education Infographics Solution is a real godsend for you.Make an Infographic *
Picture: Make an Infographic
Related Solution:
When we start to speak about databases, we must always mention database structure visualization. One of the most common ways to do it is to create an entity relationship diagram, and to put appropriate symbols on it. It is important either for database projecting and for its' future maintenance. Entity Relationship Diagram describes data elements and their relationships within a database. There are a set of special symbols that depict each element of an entity relationship diagram. Entities - represents some stable components such as supplier, employee, invoice, client, etc. Relation symbols show how the entities interact. Attributes define characteristics of the relationships. Attributes can be one-to-one or many-to-many. Physical symbols is used in the physical models. They represent items such as fields, tables, types and keys. ERD physical symbols are the building material for the database. Notation lines are used to illustrate the relationships. The most common method is Crow’s Feet notation. You can use ConceptDraw Entity-Relationship Diagram (ERD) solution to represent a database using the Entity-Relationship model.Entity Relationship Diagram Symbols
Picture: Entity Relationship Diagram Symbols
Related Solution:
Analyze each identified action separately in the tree of all actions and then develop a preventive action in response to potential obstacles or circumstances have been identified as a risk. The PDPC determines the risks when corrective action is not performed correctly. Also, it helps develop descriptions for preventive actions at the level of execution.Risk Diagram (Process Decision Program Chart) *
Picture: Risk Diagram (Process Decision Program Chart)
Related Solution:
UML Diagram Estate Agency. This sample was created in ConceptDraw DIAGRAM diagramming and vector drawing software using the UML Use Case Diagram library of the Rapid UML Solution from the Software Development area of ConceptDraw Solution Park. This sample shows the work of the estate agency and is used by the estate agencies, building companies, at the trainings of the estate agencies, for understanding the working processes of the estate agencies.UML Use Case Diagram Example - Estate Agency *
Picture: UML Use Case Diagram Example - Estate Agency
Related Solution:
Fishbone diagrams work for most entrepreneurs and almost any industry or person having a problem. Professional diagramming software may help you create Fishbone (Cause and Effect or Ishikawa) diagrams. When people are unclear about what is causing an issue, ConceptDraw DIAGRAM will be your lifesaver. When to use a Fishbone diagram? Originally developed as a quality control tool, you may find a Fishbone diagram helpful when used in many cases, such as to analyze a complex problem when there are many causes, for identifying all possible root causes for an effect or a problem, when you need different point of view to look on a problem, to uncover bottlenecks and identify where and why a process doesn't work, for acceleration a process when traditional ways of problem solving consume many time.When To Use a Fishbone Diagram *
Picture: When To Use a Fishbone Diagram
Related Solution:
An advanced tool for creating presentations, if you decide to represent data without spending hours on that.Best Software for Making Presentations *
Picture: Best Software for Making Presentations
Related Solution:
ConceptDraw
MINDMAP 16