Bubble diagrams in Landscape Design with ConceptDraw DIAGRAM
Bubble diagrams — it is the name for several different types of diagrams. Thus call diagrams which are analogs of «mind maps», such diagrams are used in landscape design. Moreover, bubble diagrams — it is a diagrams with a bubble presentation of data and the size of a bubble is a parameter of data too. For example, it can display the importance of the data in diagram or its value. So you can operate three parameters on 2-dimensional diagram — X and Y coordinates of a bubble and its size.
How to Design Landscape. There is an idea of bubble diagrams in landscape design. Unlike the bubble diagrams, which are an analog of «mind maps», in landscape design these diagrams have the completely different meaning. Such diagrams are used on the very first stages of a landscape design project.
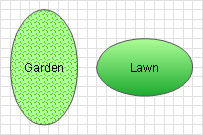
It is quite difficult to create a detailed plan with the pictures of walls and precise sizes. In this case you can use bubble diagrams. Bubbles in such diagrams represent roughly pictured areas, which define the areas of landscape design in the future project — flowers-beds, lawns, pools, playgrounds and so on.
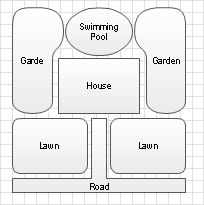
Besides the simplicity of creation, such diagram will help you to define the links between the areas of your landscape design and see the project as a whole. Bubble diagram visualizes the future project without any special costs on its creation. It is much easier to create an abstract plan with rough areas shapes than to create a detailed plan with anchors to the existing walls plants and to find out that primordial conception was wrong or just don’t suits the customer. Furthermore, using the bubble diagrams you can define the places of possible interactions of the landscape design areas. You will be able to define from what point you could see the garden or the pool without difficulties of creation a detailed plan.
Also you can use arrows between the areas with indicating of types of link instead of intersecting areas. For example, you can show that it is possible to go from one area to another and it is possible to see one more area but impossible to go there.
Materials, season and weather. As a matter of fact, bubble diagrams it is a rough draft of the future project, the first stage in the creation of more detailed drafts of natural landscape design with references to specific materials and plants, sometimes it refers to season and weather. Bubble diagrams are an analog of the plan for a report or an essay.
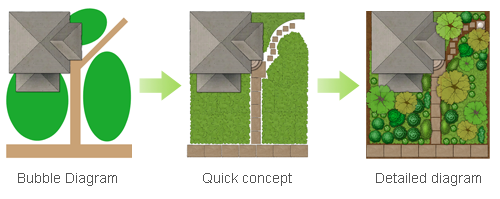
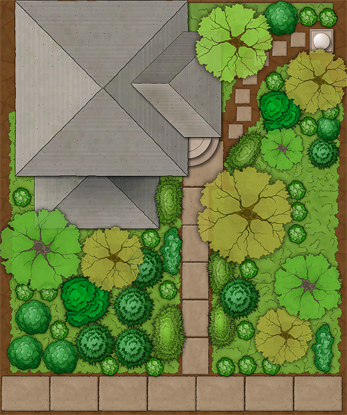
For the creation of a bubble diagrams you can use a plotting paper, which is placed over an existing location plan, and outline the future areas with a pencil and then paint them for more clear zoning, an idea of measuring design units. But in the computer age it is a much more convenient to use the special software. For example, using ConceptDraw you could create bubble diagrams as well as following concept models with nature illustrations. Using the special libraries with objects of landscape design later on you will be able to create a detailed plan of the landscape.
Landscape Design Software for Mac & PC and Garden Design Software. Creation of a bubble diagrams in ConceptDraw is an easy task as you can use the ready scanned location plan instead of plotting paper and paper location plan. Besides scanning of the ready paper location plan you can easy create it using special ConceptDraw libraries and templates for creation room plans and location plans. The main advances of computer design is easiness of plans editing and even amateur can create a professional good-looking diagram without any troubles.
How to Draw a Landscape Design Plan: Design drawings. For creation of bubble diagrams in ConceptDraw you can use layers. Thus, for example, you can place the ready location plan on the first layer. To prevent an accidental editing of this plan and easing the work with a diagram you can lock this layer and use it as a background for the bubble diagrams. Later on you will be able to switch off the visibility of this layer.
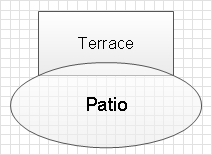
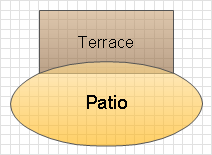
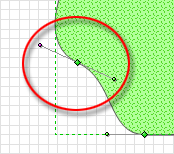
To create a bubbles you can use ready library objects such as ovals and rectangles as well as drawing tools, which let you to create areas of any complexity and configuration. Draw them just over the locked layer with the location plan. When creating the bubble diagrams on a paper, plotting paper is used to see the corresponding location plan under it. To see the walls and plants of the location plan in ConceptDraw you can use the transparency of objects. You can set the value of the transparency of any object from full transparency, so you will be able to see only the control frame of the object, to full opacity with the step of 1%. Look at terrace deck and patio example...
Instead of tiring coloring of paper diagram you can fill all selected areas with the selected color at once. It is very convenient if you have a lot of areas of the same type in your diagram, for example flower-beds. Moreover, you can use not only solid colors but also different fill patterns or gradient fill. For objects description you can use a legend, i.e. define which color corresponds to which area type, or you can add a text description to objects on the diagram. Basically, any area in the diagram could be signed as you can use small fonts and zoom in any part of the diagram later.
Bubble diagrams, created using ConceptDraw can be easily edited whereas in case of using a paper diagrams as a rule you will need to create the new diagram each time. In ConceptDraw you can edit any object. For example, you can change the size of an object or add a control dots to change the shape of an existing object – fro example, you create the pentagon from the square adding one control dot to any side of the square. As a rule, areas in bubble diagrams have more complex form than trivial rectangles or ovals, so in ConceptDraw you can use the tool of creation of the free curves, which lets you to create the objects of any form and later on edit the curvature of any part of the object.
ConceptDraw supports work with multiple-sheet diagrams, so can be used for creation of the following diagrams in the same document and creation of the interactive links between them. It is very convenient for creation of presentations for customers. Also, ready bubble diagrams can be used as the base for following more detailed plans, whereas you need to create new paper documents.

Example 1. Bubble diagrams — landscape design
The main advance of the bubble diagrams is the simplicity of their creation. It lets you to create several variants of design in a short period of time and without hard work and choose the best from them. Don’t forget that you don’t need to concentrate on the small details of the future landscape — just use your imagination for creation the best concept, which will be obvious from the created bubble diagrams.