Made with
ConceptDraw
DIAGRAM 18

Fishbone Diagram Problem Solving

The Ishikawa diagram, Cause and Effect diagram, Fishbone diagram — all they are the names of one and the same visual method for working with causal connections. Originally invented by Kaoru Ishikawa to control the process quality, the Ishikawa diagram is well proven in other fields of management and personal scheduling, events planning, time management.

The Fishbone diagram is one of the main tools used to measure, assess, monitor and improve the quality of production processes and is included to the list of Seven tools of quality control. The Ishikawa diagram allows you to organize the reasons in a convenient visual format, to find among them the main, to identify the major causation factors and consequences in the interesting problem or situation, and also to prevent the occurrence of undesirable factors and causes.

The Ishikawa diagram is a chart in the form of a fish, whose head is a problem, the fins are variants for its causes. At this it is important to indicate the really essential reasons, without going into too much detailing.

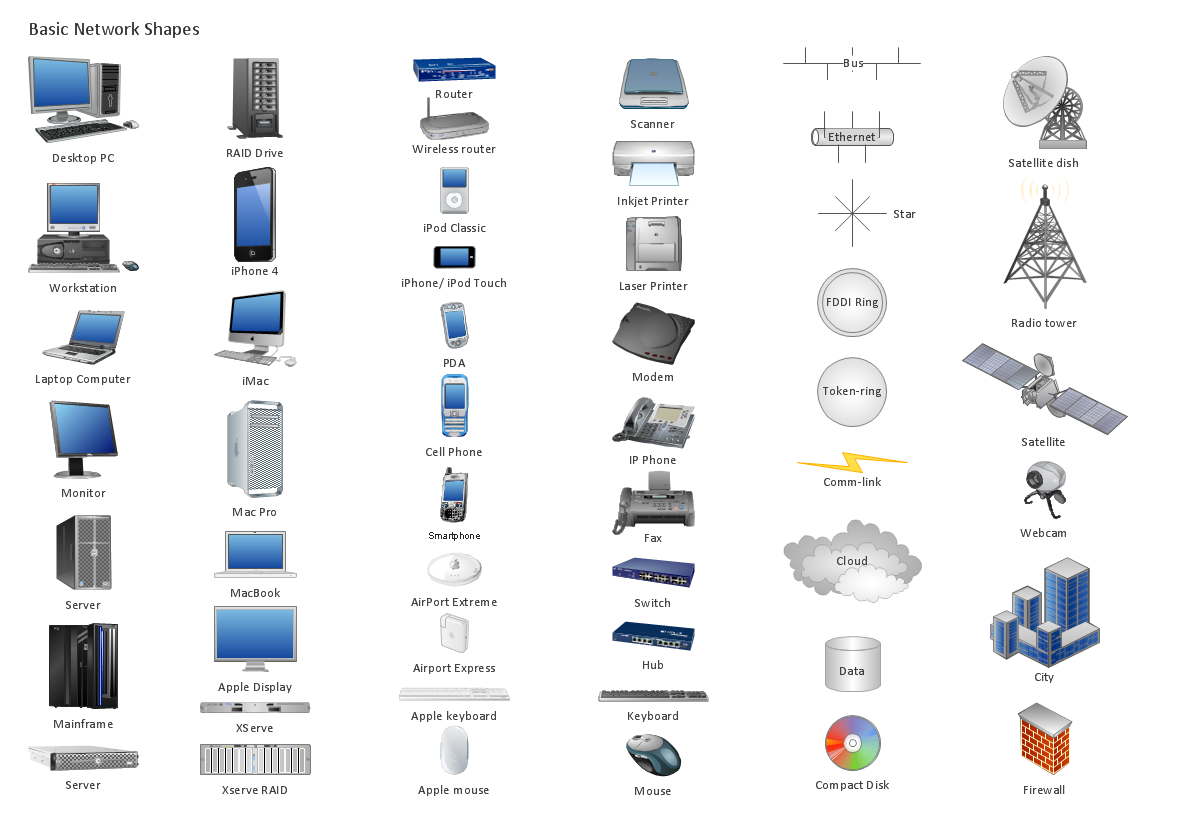
To design easily the Fishbone diagram, you can use a special ConceptDraw DIAGRAM ector graphic and diagramming software which contains the powerful tools for Fishbone diagram problem solving offered by Fishbone Diagrams solution for the Management area of ConceptDraw Solution Park.

Fishbone Diagram Problem Solving *

Example 1. Fishbone Diagram Problem Solving

Fishbone Diagrams Solution contains the Fishbone Diagrams library with a lot of ready-to-use vector objects by using which a Fishbone diagram can be simply created even by a beginner. This solution provides also variety of quick-start templates, examples and samples demonstrating fishbone diagram problem solving. Each of them is available at ConceptDraw STORE and can be used as a good base for designing your own Fishbone diagram without efforts.

Fishbone Diagram Construction with ConceptDraw DIAGRAM  title=

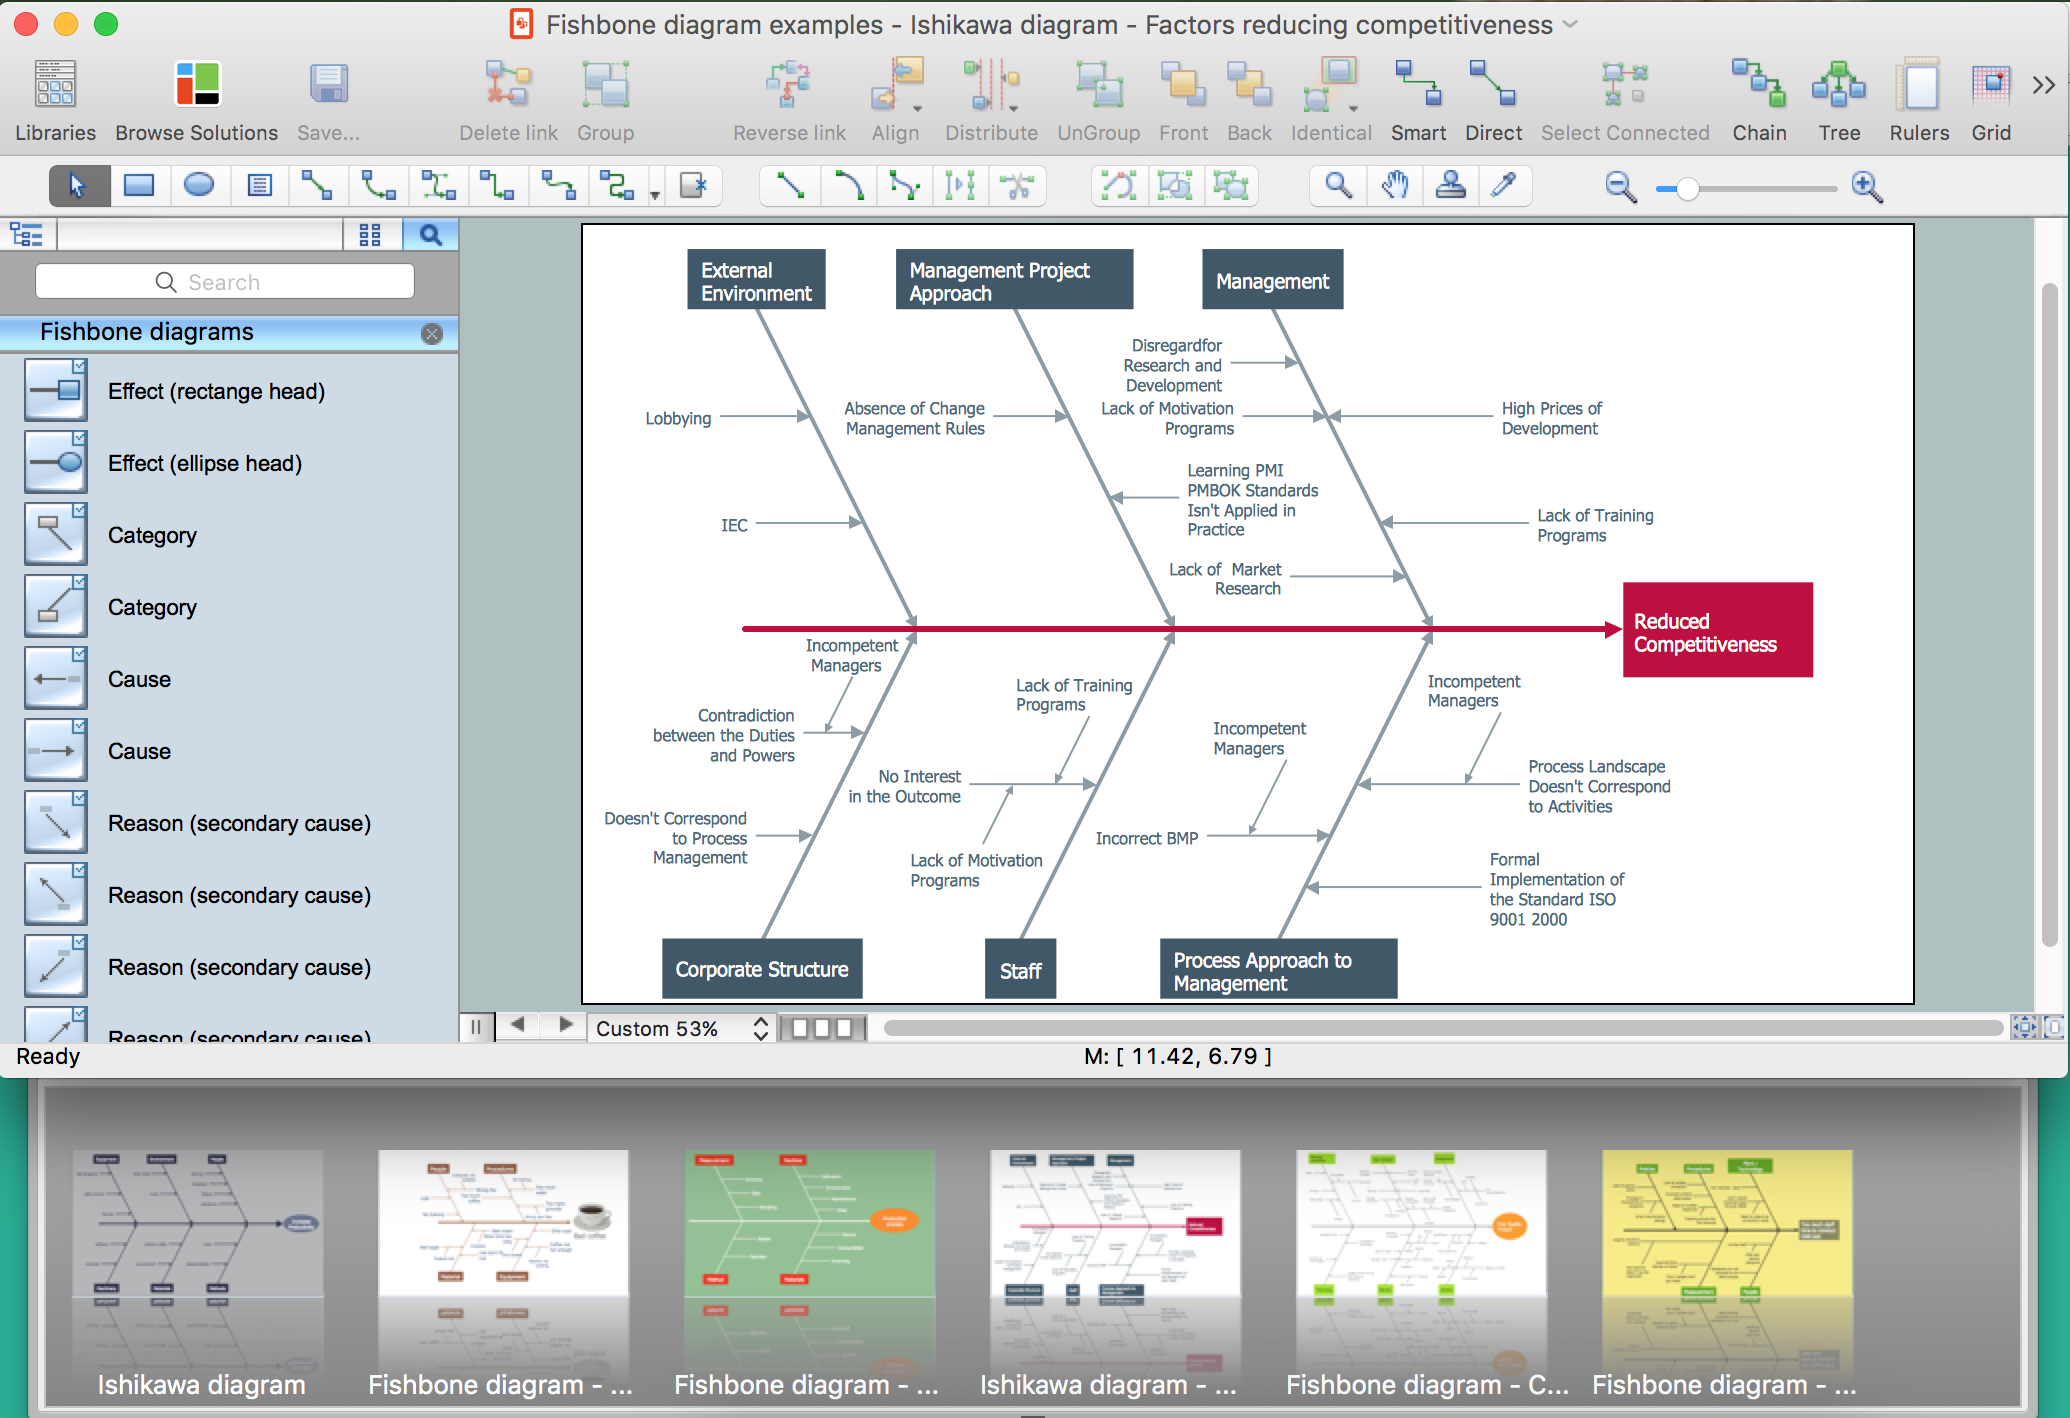
Example 2. Fishbone Diagram Construction with ConceptDraw DIAGRAM /p>

Fishbone diagram is a perfect problem analyzing and solving graphic method. To make your diagrams even more attractive and successful don't afraid to use bright colors and colorful clipart from other libraries of ConceptDraw Solution Park.

Fishbone Diagram - Bad Coffee

Example 3. Fishbone Diagram - Bad Coffee

The samples and templates you see on this page were created in ConceptDraw DIAGRAM using the Fishbone Diagrams Solution tools and are available for using from ConceptDraw STORE. An experienced user spent 10 minutes creating each of them.

Use the Fishbone Diagrams Solution for ConceptDraw DIAGRAM Solution Park for fast and effective cause and effect analysis and fishbone diagram problem solving.

All source documents are vector graphic documents. They are available for reviewing, modifying, or converting to a variety of formats (PDF file, MS PowerPoint, MS Visio, and many other graphic formats) from the ConceptDraw STORE. The Fishbone Diagrams Solution is available for all ConceptDraw DIAGRAM or later users.


TEN RELATED HOW TO's:
Use the set of special professionally developed swim lane flowchart symbols - single, multiple, vertical and horizontal lanes from the Swimlanes and Swimlanes BPMN 1.2 libraries from the Business Process Diagram solution, the Swim Lanes library from the Business Process Mapping solution as the perfect basis for your Swim Lane Flowcharts of processes, algorithms and procedures.Swim Lane Flowchart Symbols *
Picture: Swim Lane Flowchart Symbols
Related Solution:
To visualize the relationships between subsets of the universal set you can use Venn diagrams. Сreate your own professional-looking Venn Diagrams quick and easy.Multi Layer Venn Diagram
Picture:
Multi Layer Venn Diagram
Venn Diagram Example
Related Solution:
The Enhanced Interior Gateway Routing Protocol (EIGRP) is a progressive distance-vector dynamic routing protocol. It was developed by the Cisco Systems and is available as an open standard from 2013. EIGRP is used to help automate routing decisions and configuration of the computer network. It allows the routers of the same logical area automatically share route information.EIGRP. <br>Computer and Network Examples *
Picture: EIGRP. Computer and Network Examples
Related Solution:
Special libraries of highly detailed, accurate shapes and computer graphics, servers, hubs, switches, printers, mainframes, face plates, routers etc. Use ConceptDraw DIAGRAM with Computer & Networks solution for drawing LAN and WAN topology and configuration diagrams, Cisco network diagrams, network wiring schemes and floor plan layouts.Network diagram
Picture: How To use Switches in Network Diagram
Related Solution:
Sometimes, it's not easy to fit everything you need into your premise. So, you can discover how to use building plan examples and get inspired from viewing them. You can find a lot of office layout and floor plans templates in the ConceptDraw Solution Park. This drawing shows the sample of interior design of a middle-size restaurant. It was designed with a help of ConceptDraw Cafe and Restaurant Plans solution. Extensive libraries of vector objects of the interior element enabled us to design this example quickly and with no efforts. You can use this interior plan as a template while designing an interior for your own restaurant. It will help you to compose and organize elements of the interior, to bring a balance between free space and furniture in your establishment. It can be applied to organize and arrange the furniture, equipment and decorative elements in the restaurant interior and achieve balance between furniture and free space.How To use Building Plan Examples *
Picture: How To use Building Plan Examples
Related Solution:
Planning a computer network can be a challenge for a junior specialist. However, knowing how to draw a computer network diagrams isn’t a rocket science anymore. There are a lot of special software for creating such diagrams with predesigned templates and examples. The core for Network Fault Tolerance System presented here, is the equipment of Cisco. You can see here the certified Cisco equipment icons. Generally, ConceptDraw DIAGRAM libraries contain more than half of a thousand objects representing the standardized images of Cisco equipment. ConceptDraw solution for network diagramming is a great network diagramming tool for any level skills - from students to network guru.How to Draw a Computer Network Diagrams
Picture: How to Draw a Computer Network Diagrams
Related Solution:
The Time-Money-Quality Triangle illustrates an advertising truism, that you can't have all three.Pyramid Diagram *
Picture: Pyramid Diagram
Related Solutions:
It’s obvious that a good manager detects threats just in time to prevent a company crisis. If you had ever asked about what SWOT analysis is, then you must have interest in business strategies. After you build a SWOT matrix, you’ll see the pros and cons of your strategy. The method of SWOT analysis is used in strategy management. It helps to estimate the Strengths, Weaknesses, Opportunities, and Threats generated during an activity of particular business. A SWOT matrix can be build for companies, products, or individuals. Using SWOT analysis means to state business goals and to determine factors, both the internal and external that are good and bad to reach the business goals. The capabilities of ConceptDraw MINDMAP and ConceptDraw DIAGRAM software help professional to carry out SWOT analysis with maximum effectiveness.What is SWOT Analysis? *
Picture: What is SWOT Analysis?
The Total Quality Management Diagram solution helps your organization visualize business and industrial processes. Create Total Quality Management diagrams for business process with ConceptDraw software.Best Value — Total Quality Management *
Picture: Best Value — Total Quality Management
Related Solution:
Create flowcharts, org charts, shipping flowcharts, floor plans, business diagrams and more with ConceptDraw. Includes 1000s of professional-looking business templates that you can modify and make your own.Basic Diagramming *
Picture: Basic Diagramming
Related Solution:
ConceptDraw
DIAGRAM 18