
Pic. 1. Circuits and Logic Diagram Software
Circuits and Logic Symbols
Electrical Engineering solution from the Industrial Engineering Area of ConceptDraw Solution Park includes the following 26 libraries with near 1000 predesigned vector objects:
- Analog and Digital Logic
- Composite Assemblies
- Delay Elements
- Electrical Circuits
- Electron Tubes
- IGFET
- Inductors
- Integrated Circuit
- Lamps, Acoustics, Readouts
- Logic Gate Diagram
- Maintenance
- MOSFET
- Power Sources
- Qualifying
- Resistors
- Rotating Equipment
- Semiconductor Diodes
- Semiconductors
- Stations
- Switches and Relays
- Terminals and Connectors
- Thermo
- Transformers and Windings
- Transistors
- Transmission Paths
- VHF UHF SHF

Pic. 2. Circuits and Logic Diagram Symbols
On this picture you can see the Circuits and Logic symbols from the libraries of Electrical Engineering solution that you can use for quick, easy and effective designing professional looking Circuits and Logic Diagrams of any difficulty.
Circuits and Logic Diagram Sample
Electrical Engineering solution from the Industrial Engineering Area of ConceptDraw Solution Park contains a large number of templates and samples that you can use and change for your needs.

Pic. 3. Amplifier
This example was created in ConceptDraw DIAGRAM using the Electrical Engineering solution and shows the scheme of an amplifier.
The Circuits and Logic Diagrams produced with ConceptDraw DIAGRAM are vector graphic documents and are available for reviewing, modifying, converting to a variety of formats (image, HTML, PDF file, MS PowerPoint Presentation, Adobe Flash or MS Visio), printing and send via e-mail in one moment.
See also Samples:
TEN RELATED HOW TO's:
ConceptDraw DIAGRAM diagramming and vector drawing software extended with Specification and Description Language (SDL) Solution from the Industrial Engineering Area of ConceptDraw Solution Park provides powerful drawing tools for quick and easy creating well-designed FSM diagrams.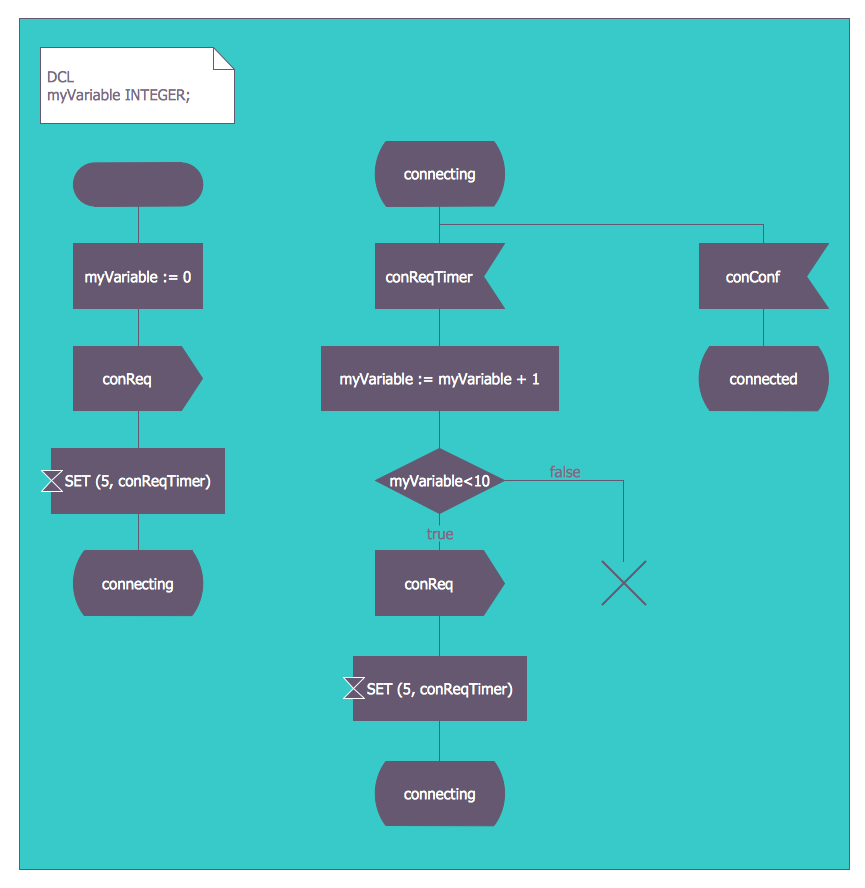
Picture: FSM — Finite-state Machine
Related Solution:
If you are an advanced diagramming software user, you might use it daily. Traversing the Internet in searching of alternative to MS Visio for MAC and PC, you can fulfill all your requirements with ConceptDraw DIAGRAM. Don’t hesitate to transfer your documents to another operating system.
When looking for a smart and simple tool for business diagrams as alternative to MS Visio for Apple OS X platform, ConceptDraw DIAGRAM certainly is the best choice. Making many kinds of business charts, numerous technical drawings is what ConcepDraw DIAGRAM is the best. One can easy create any diagram and complete it perfectly and quickly. The big collection of vector object libraries, templates and samples, make it the best Microsoft Visio alternative: ConceptDraw DIAGRAM is simpler to use, less expensive, and supports project management and mind mapping methods.
Picture:
In Searching of Alternative to MS Visio for Mac and PC
with ConceptDraw DIAGRAM
To maintain big and complex mechanical systems, you need an appropriate education and tools. It’s needless to say that mechanical drawing is important part of any industrial project. There are a lot of standard symbols depicting valves, pumps, motors, etc.
This drawing illustrates the content of the Fluid Power Equipment library provided by the ConceptDraw Mechanical Engineering solution. The solution is composed from the 8 libraries, containing about 500 elements related to mechanical engineering visualization. it will be helpful for drawing various schemes, charts and blueprints of pneumatic, and hydraulic equipment or other drawing related mechanical engineering. All drawings can be freely resized without loss of quality due to the vector graphics components of its facilities.
Picture:
Mechanical Drawing Symbols F.A.Q.
How to Use Mechanical Engineering Design Software
Related Solution:
You need design Cylinder Venn Diagram? Nothing could be easier with ConceptDraw DIAGRAM software.
Picture: Cylinder Venn Diagram
Related Solution:
No science can't exist without illustrations, and especially astronomy! Illustrations help to visualize knowledge, natural phenomenons which are studied by astronomy, they equally effective help in work, during the learning process and on the conferences.
Now we have professional astronomy illustration software - ConceptDraw DIAGRAM illustration and sketching software with templates, samples and libraries of a variety of astronomy symbols, including constellations, galaxies, stars, and planet vector shapes; a whole host of celestial bodies. When drawing scientific and educational astronomy illustrations, astronomy pictures and diagrams, can help you reach for the stars!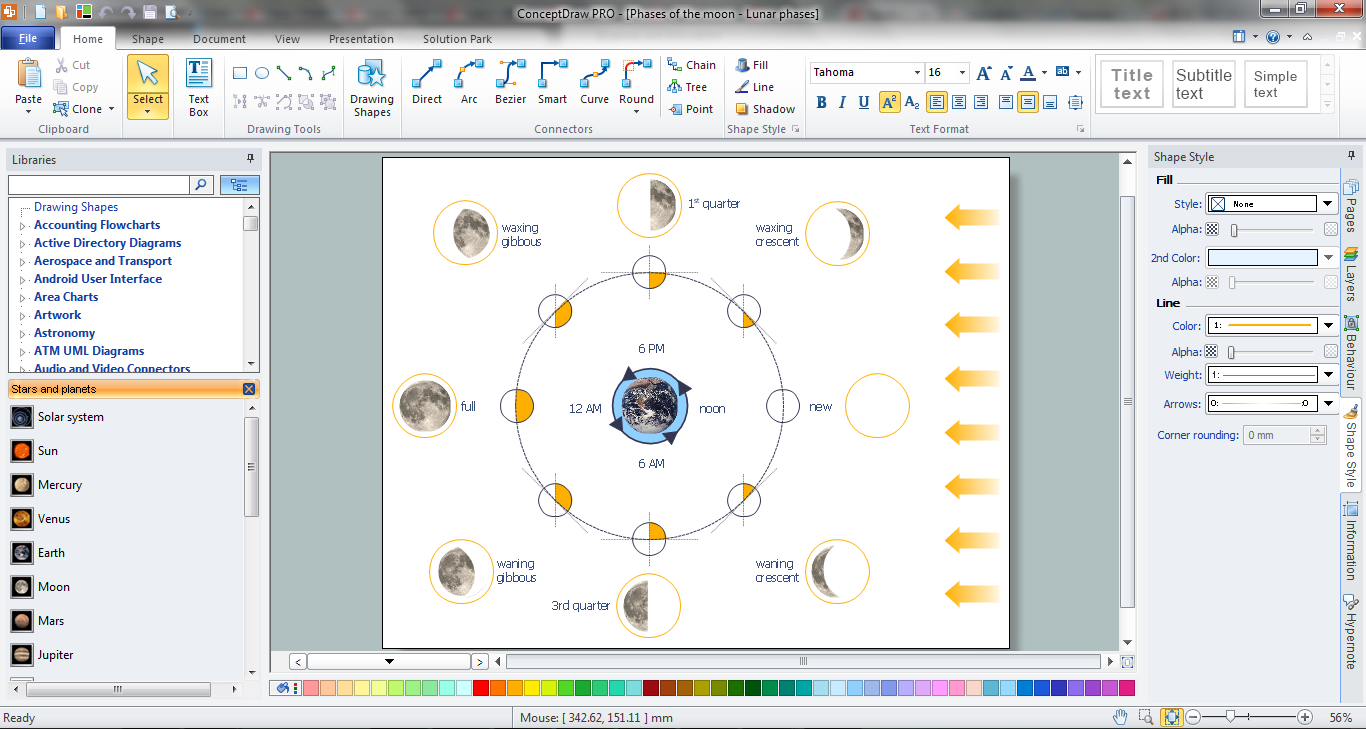
Picture: Illustration Software
Related Solution:
One of the ways effectively visualize what is a Cloud computing or Cloud computing architecture, is to create the Sequence diagram for Cloud computing. The ConceptDraw DIAGRAM diagramming and vector drawing software enhanced with Cloud Computing Diagrams solution from the Computers and Network area of ConceptDraw Solution Park will help you design all desired types of diagrams related with cloud computing.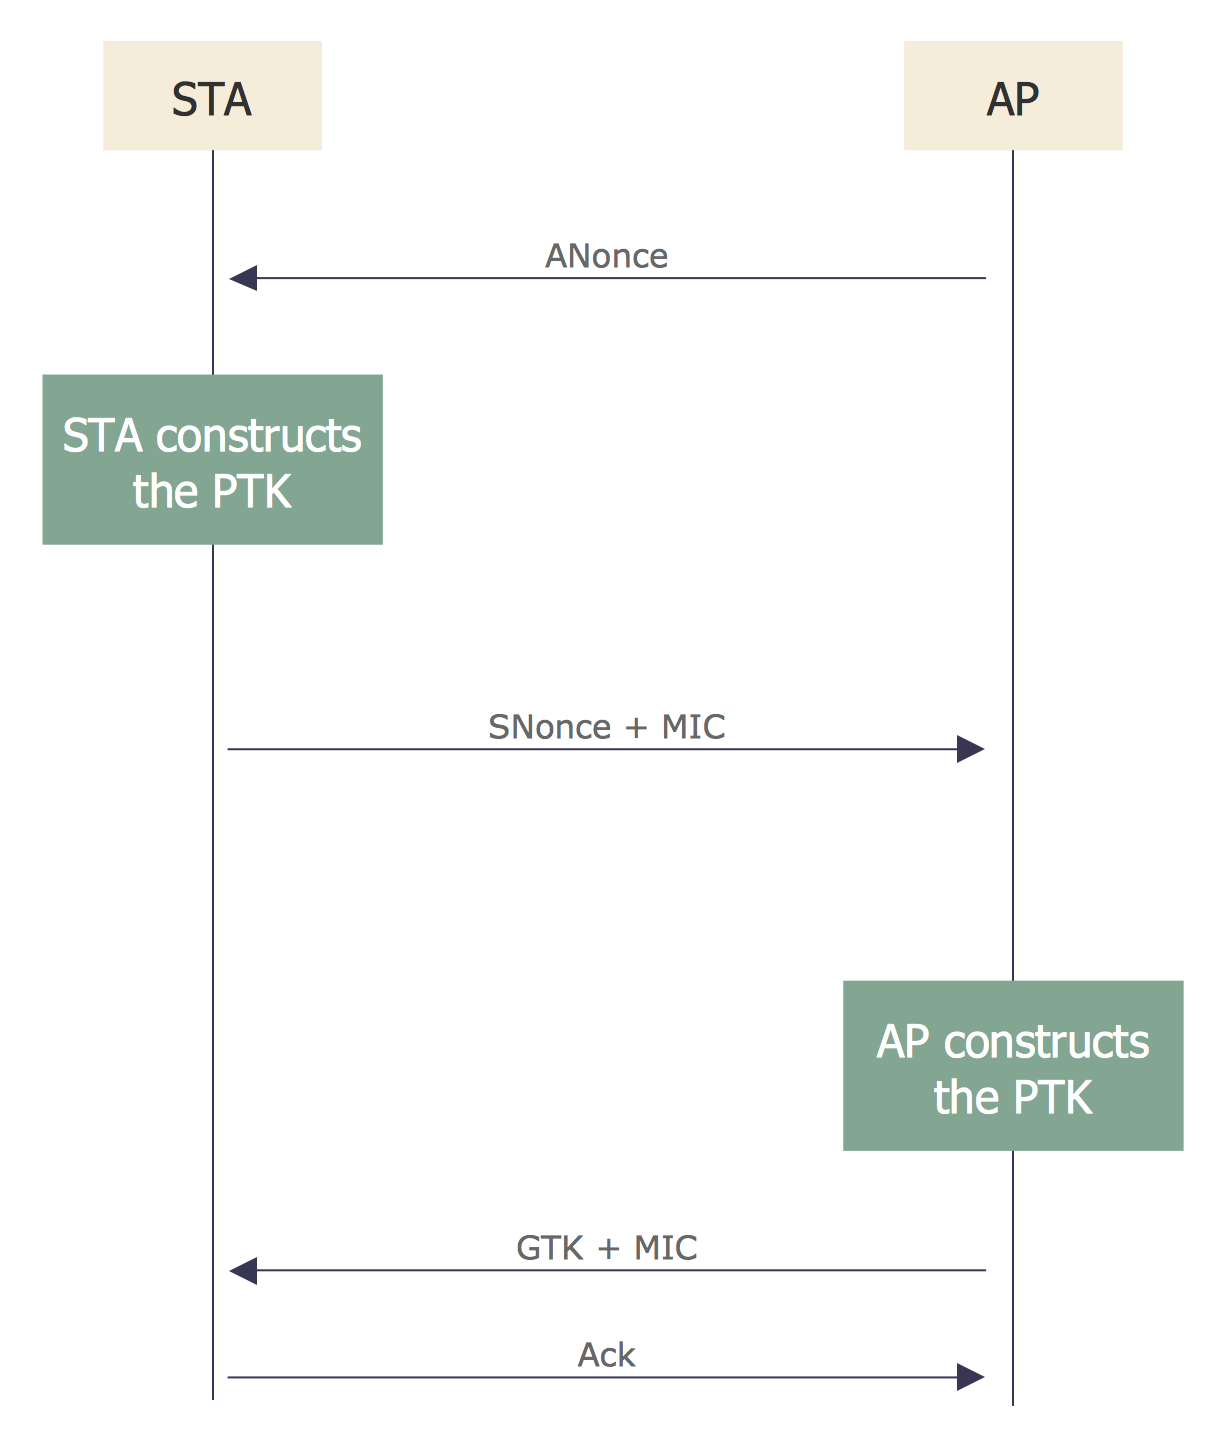
Picture: Sequence Diagram for Cloud Computing
Related Solution:
Definition, examples, layout options, best practices, and common mistakes for cross functional flowcharts (swimlane diagrams).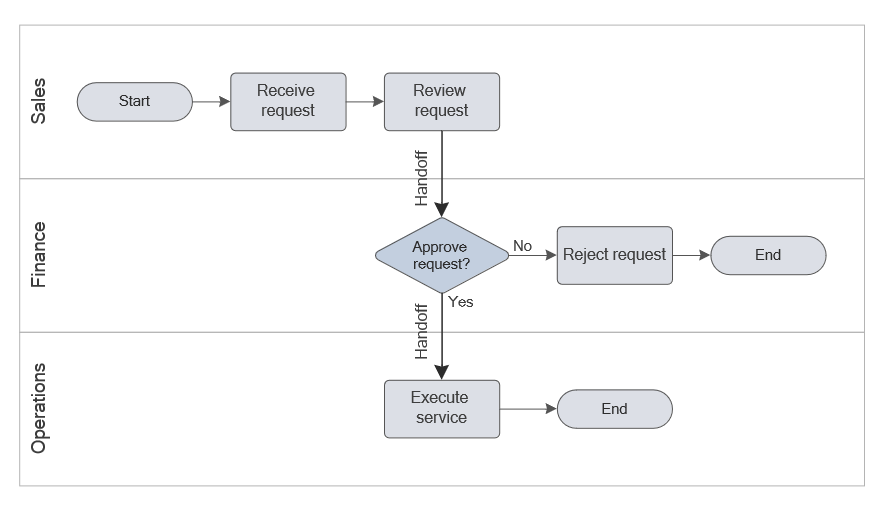
Picture: Cross Functional Flowchart (Swimlane Diagram): Definition, Structure, Examples, and How to Create
Related Solution:
As concept map consists from conception-blocks and links between them, you can use ConceptDraw library objects and add to a document as much objects as you need. ConceptDraw tools let you to edit, group, move objects, change their appearance and add text signs and raster or vector pictures.
ConceptDraw DIAGRAM diagramming and vector drawing software extended with Concept Maps Solution from the Diagrams Area is effective tool for creating professional looking Concept Maps.
Picture: Concept Maps
Related Solution:
While studying, many of the students encounter the necessity of remaking class projects, over and over. To facilitate this process you can use special electrical and telecom plan software, which helps altering projects in several clicks. Using templates will fasten your work, and you will have more free time.
This sample represents an electrical and telecommunication floor plan. Electrical and telecom floor plans contain a floor plan , on which imposed the layout of electrical, and telecommunications equipment. They shows electrical and telecom details regarding the current floor of a building: lightening, fixtures, wires, outlets, circuit panels, etc. Using of standart notation of electrical and telecommunication symbols makes the plan understandable for engineers, architects, constructors, specialist in electricity and telecommunications.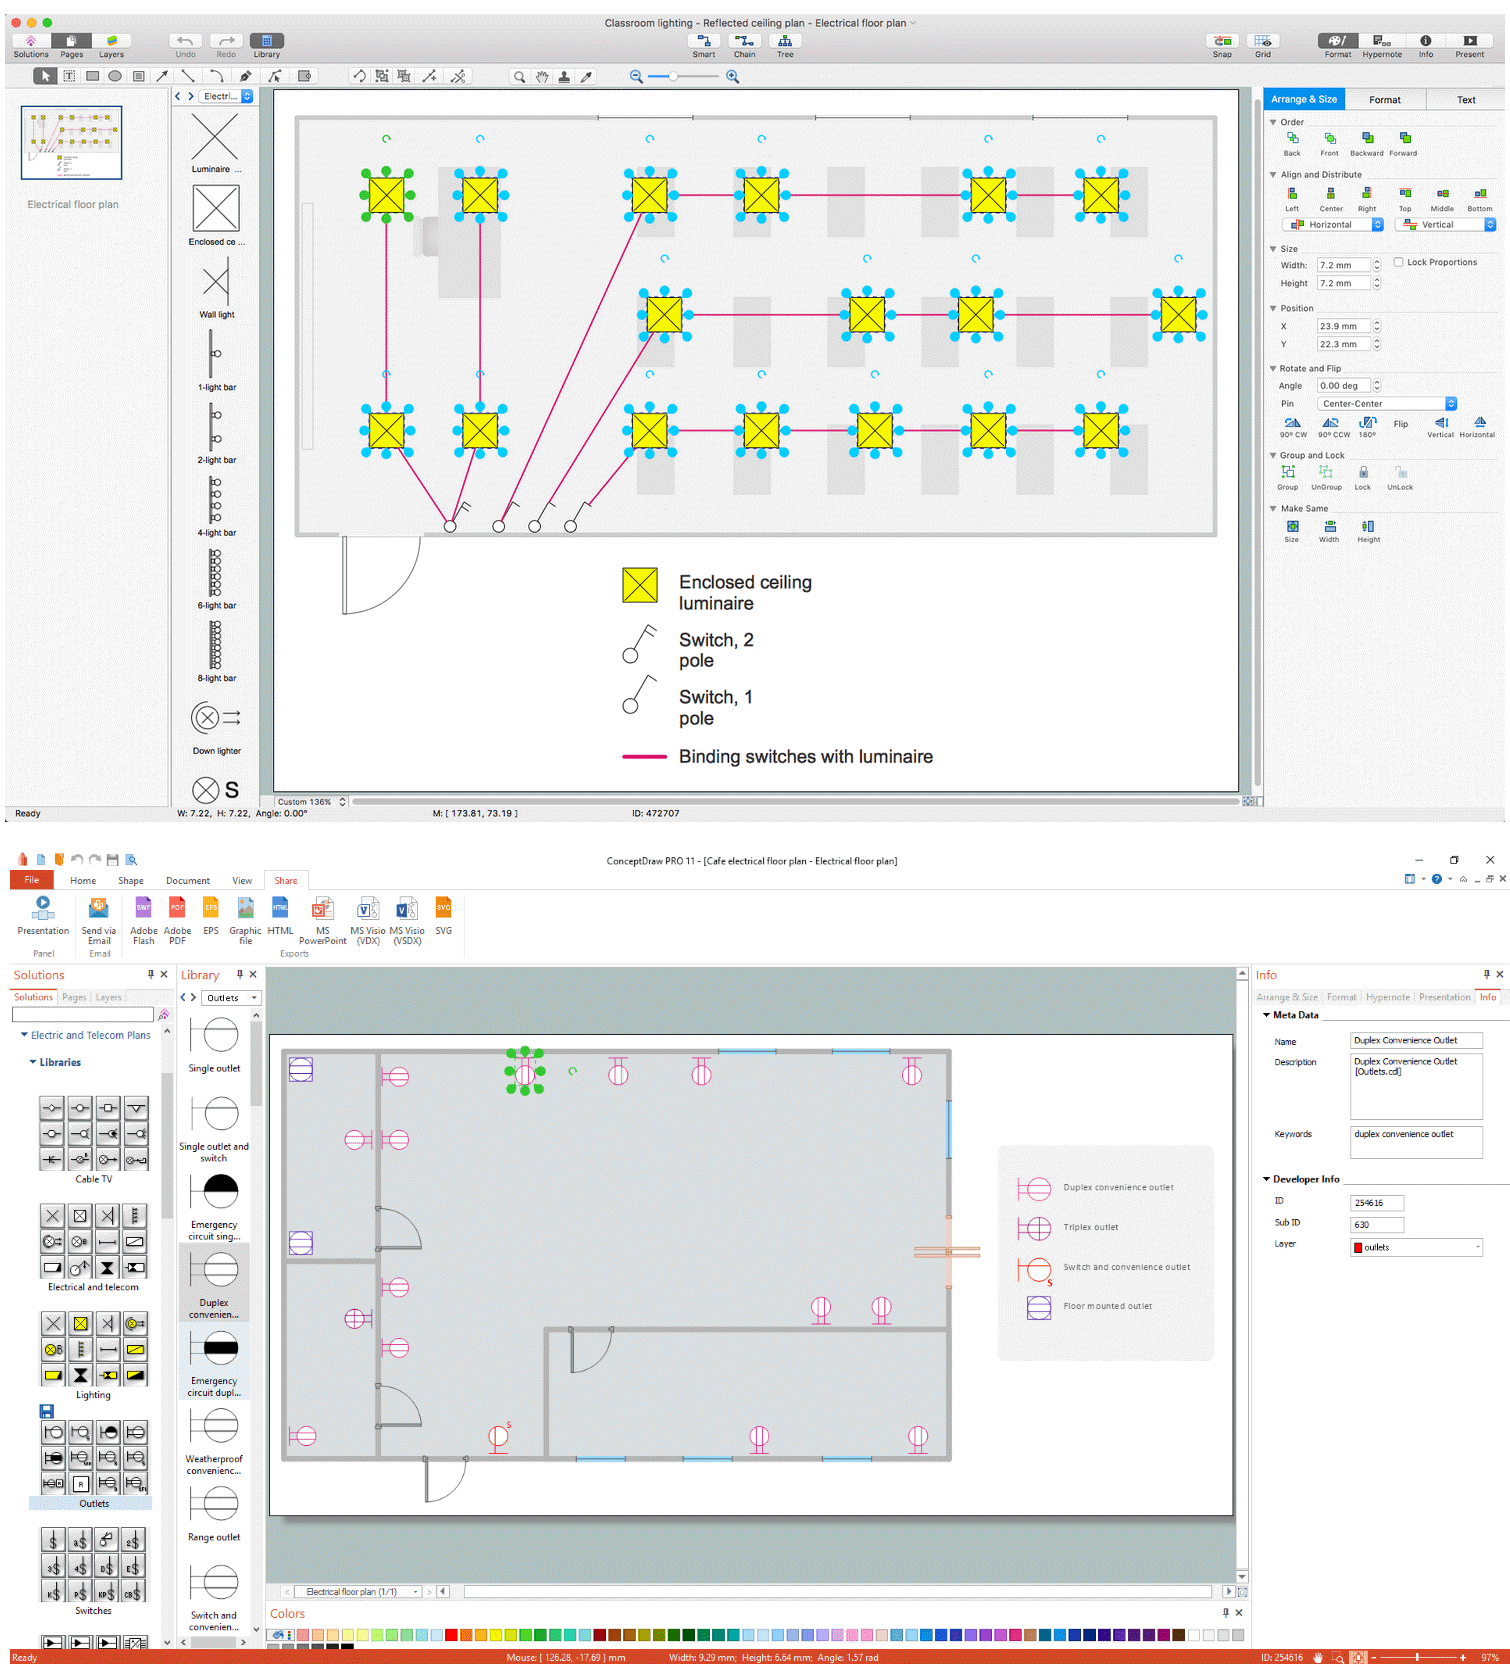
Picture: Electrical and Telecom Plan Software
Related Solution:
Use the libraries from the Block Diagrams solution to draw block diagrams for your business documents, presentations and websites in a few minutes.
Picture: Block Diagram
Related Solution:

