ConceptDraw DIAGRAM The best Business Drawing Software
|
Brief info about ConceptDraw - business drawing software. ConceptDraw DIAGRAM is new software for business and technical drawing. Powerful business drawing tools, extensive libraries with pre-drawn shapes, free samples of business drawings, technical drawings and flowcharts, support of many graphic formats enable users to visually develop their business drawings charts and diagrams in any combination of drawings, diagrams and flow charts. ConceptDraw DIAGRAM is the only professional business drawing and diagramming software of its kind designed to work on both Macintosh OS X and Windows.
Samples of business drawing created with ConceptDraw Business Drawing software
|


TEN RELATED HOW TO's:
ConceptDraw MINDMAP - an excellent tool for exporting mind maps to PowerPoint to visualize and presenting your project. You can simply generate, change, update your mindmap and then make a presentation in PowerPoint.
Picture: How To Do A Mind Map In PowerPoint
Related Solution:
Have you ever created the fire plans on the base of Fire Evacuation Plan Template? It's incredibly convenient and time-saving way. Let's try to make sure this with Fire and Emergency Plans solution for ConceptDraw DIAGRAM software.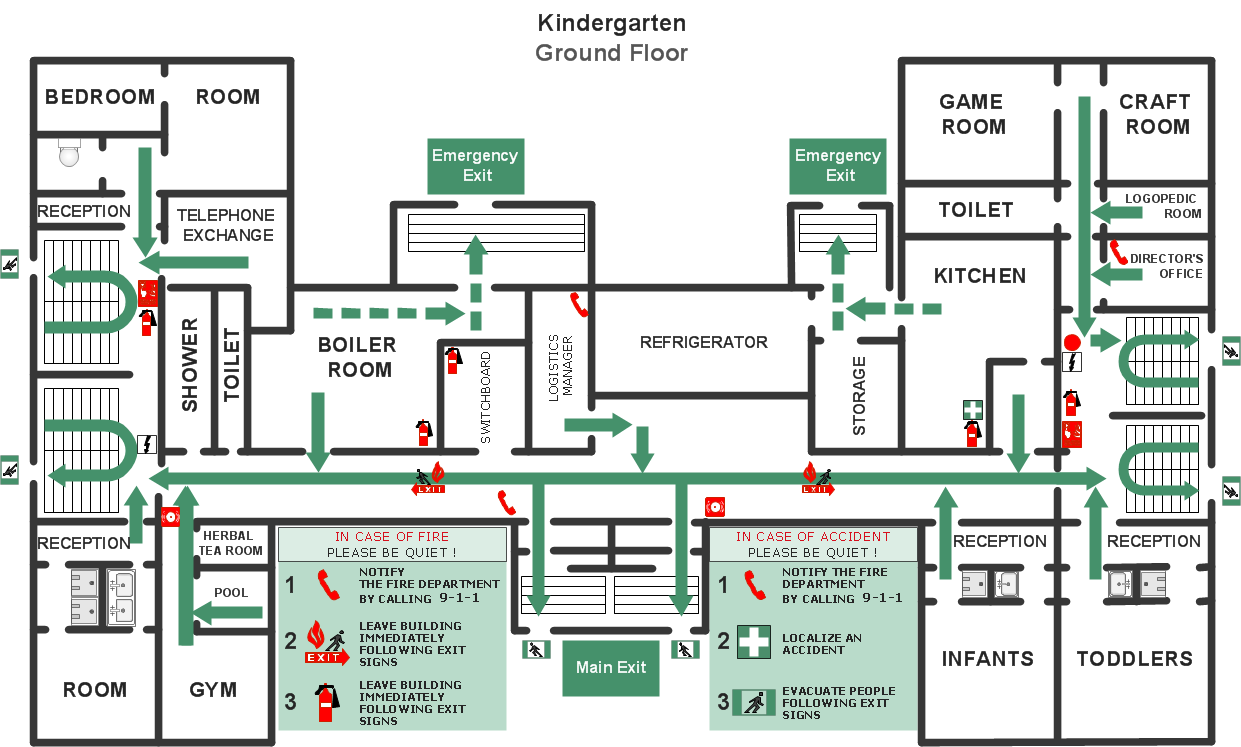
Picture: Fire Evacuation Plan Template
Related Solution:
Project timeline is a type of chart which allows visually represent the chronology of works for the project, placing the key points of the project (milestones) on a timescale.
You need to make professional looking project timeline? Create it with ConceptDraw DIAGRAM! ConceptDraw DIAGRAM extended with Timeline Diagrams Solution from the Management Area is the best timeline diagrams software
Picture: Project Timeline
Related Solution:
ConceptDraw DIAGRAM is a powerful tool that helps you create professional looking cross-functional flowcharts with the well-designed objects. ConceptDraw DIAGRAM - Drawing Software for Vertical Cross Functional Flowchart. ConceptDraw allows you to focus on work, not the drawing process. ConceptDraw Arrows10 Technology allows to draw connectors with smart behavior that gives flexibility to you during work process.
Picture: Vertical Cross Functional Flowchart
Flow chart is a diagrammatic representation of an algorithm and essential part of planning the system. Flow charts are widely used in technical analysis and programming for easy writing programs and explaining them to others. So, one of the most popular type of flow charts is Technical Flow Chart.
Technical Flow Chart can be drawn by pencil on the paper, but it will be easier to use for designing a special software. ConceptDraw DIAGRAM diagramming and vector drawing software extended with Flowcharts Solution from the Diagrams Area of ConceptDraw Solution Park will be useful for this goal.
Picture: Technical Flow Chart
Related Solution:
Diagramming software for Mac and PC - create flowcharts and presentations for Social Media Organizing.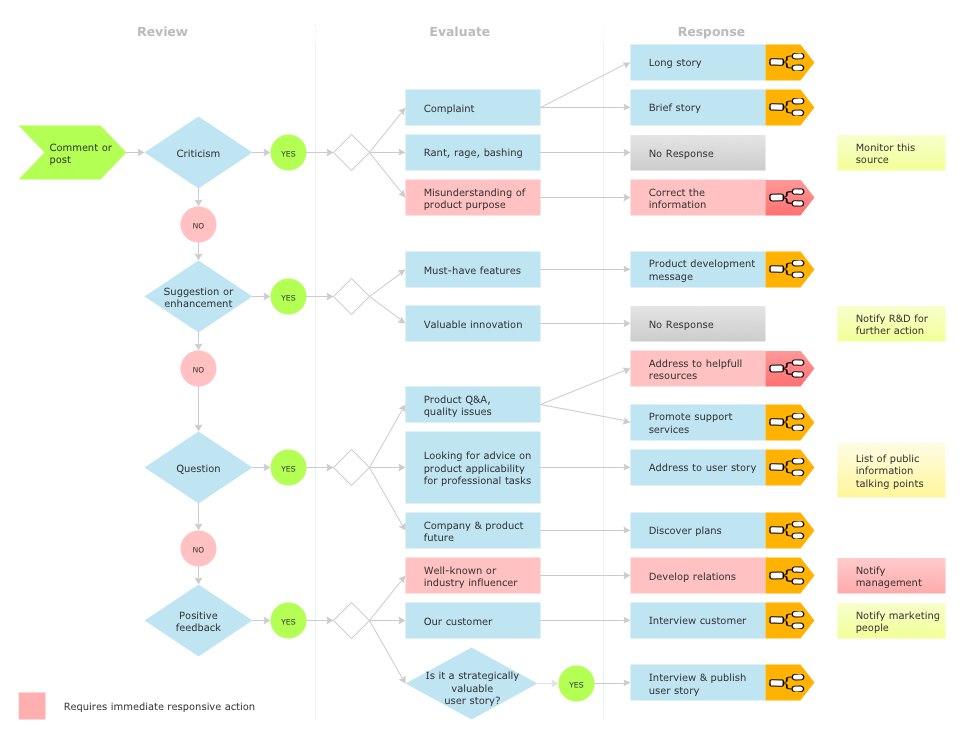
Picture: Social Media Response DFD Flowcharts - diagramming software ( Mac PC )
Related Solution:
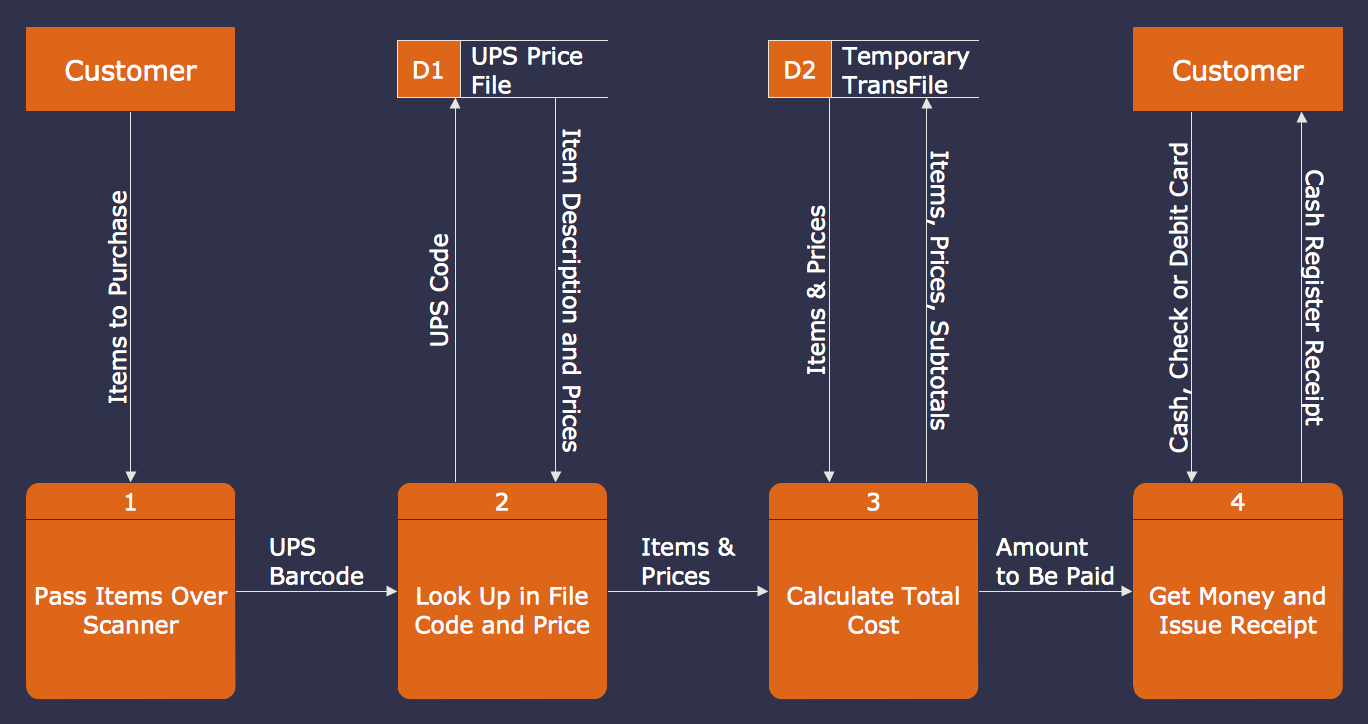
The Accounting flowchart shows how information flows from source documents through the accounting records. The are based on the accounting procedures or processes.
Flowcharts are used to represent accounting information in a system. There are special symbols which are used to create accounting flowcharts. Try conceptdraw flowcharting set of symbols to draw a professional charts.
Picture: Why Flowchart Important to Accounting Information System?
Related Solution:
This sample shows the Spider Chart that represents the budget and spending for one organization and allows to compare them. The multivariate data are represented on the Spider Chart as a two-dimensional chart with four or more variables displayed on the axes that start in one point. The Spider Charts are used in the management, business and sport.
Picture: Spider Chart Template
The Ishikawa diagram, Cause and Effect diagram, Fishbone diagram — all they are the names of one and the same visual method for working with causal connections. Originally invented by Kaoru Ishikawa to control the process quality, the Ishikawa diagram is well proven in other fields of management and personal scheduling, events planning, time management. It is a chart in the form of a fish, whose head is a problem, the fins are variants for its causes.
To design easily the Fishbone diagram, you can use a special ConceptDraw DIAGRAM vector graphic and diagramming software which contains the powerful tools for Fishbone diagram problem solving offered by Fishbone Diagrams solution for the Management area of ConceptDraw Solution Park.
Picture: Fishbone Diagram Problem Solving
Related Solution:
Mac compatible remote presentation, A simple way to share your presentation remotely via Skype. All participants receive presentation file.
Picture: Mac Compatible Remote Presentation
Related Solution:
ConceptDraw
DIAGRAM 18