Organizational Chart Template
Organizational Chart helps you to show the relationships of positions in an organization in terms of authority and responsibility. Orgcharts are typically used to provide both employees and individuals outside of the organization with a “snapshot” picture of the reporting relationships, divisions of work and levels of management.
Inside the Orgcharts solution, you will find templates, which provide a foundation to allow you to depict a wide array of organizational structure types - and to represent any matrix organization structure, functional organizational structure, or business structure - in addition to predesigned samples and vector shape libraries containing all the icons you need to effectively illustrate your organizational structure chart.
This sample was created in ConceptDraw DIAGRAM diagramming and vector drawing software using the Organizational Charts Solution from the Management area of ConceptDraw Solution Park.

Pic.1. Organizational Chart solution
This sample shows the Organizational Chart that displays the structure of the organization in the field of Project Management and the relationships of the company′s parts. Organizational Chart that you see has a tree structure. This sample is very useful for management diagramming.

Pic.2. Software Work Flow Process in Project Management with Diagram
Using the libraries of the Organizational Charts Solution for ConceptDraw DIAGRAM you can create your own professional Organizational Charts Diagrams quick and easy.

Pic.3. Organizational Charts library
All source documents are vector graphic documents. They are available for reviewing, modifying, or converting to a variety of formats (PDF file, MS PowerPoint, MS Visio, and many other graphic formats) from the ConceptDraw STORE. The Organizational Charts Solution is available for all ConceptDraw DIAGRAM or later users.
TEN RELATED HOW TO's:
Perfect charts and graphics diagramming software with rich examples and template. ConceptDraw is ideal to draw Charts and Graphics.
Picture: Basic Diagramming
Related Solution:
A network diagram is used to depict the topology of a computer network or, talking more broadly, any telecommunications network in general. In order for a computer network diagram to be understandable, clearly identifiable icons must be used for each network appliance. Cisco network templates, also called Network Topology Icons, is a brand of symbols developed and used by Cisco. Since Cisco Systems is the largest networking company in the world, it's list of networking symbols is widely recognized and exhaustive.
The diagram of the ISG network topology diagram illustrates the Cisco Intelligent Services Gateway. Since Cicso company offers service providers a possibility to provide control of state and resources in a broadband network, network architects and engineers need some facilities to create ISG topology diagrams.This Cisco ISG network diagram was created in ConceptDraw DIAGRAM using its solution for Cisco network diagrams. The vector library of this solution comprises over 500 icons of Cisco hardware and accessories. They can be used to design LAN, WAN, ISG and other Cisco equipped network diagrams.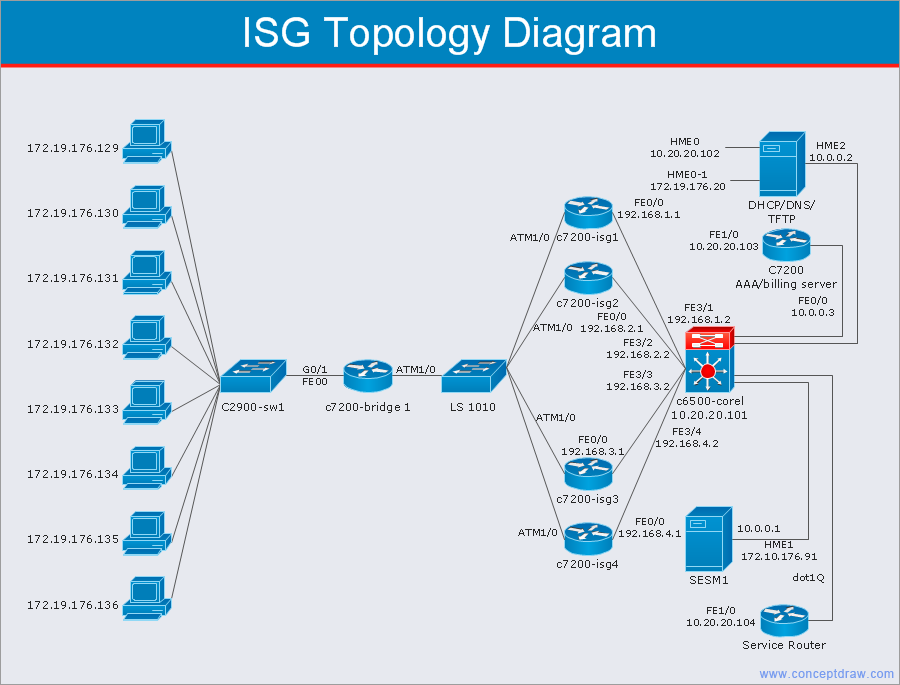
Picture: Cisco Network Templates
Related Solution:
The ConceptDraw vector stencils library Cisco Optical contains symbols for drawing the computer network diagrams.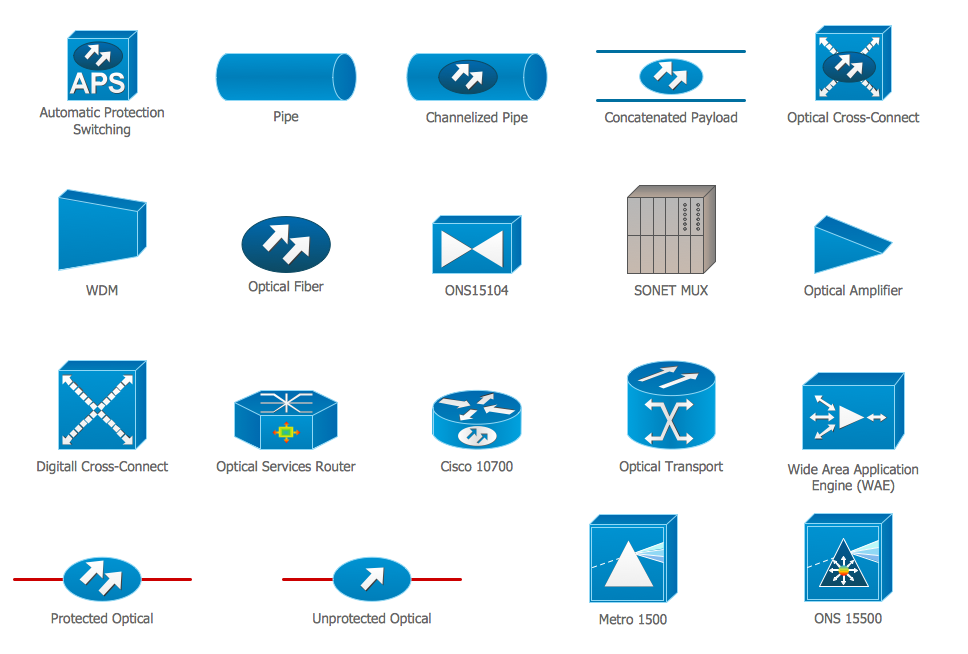
Picture: Cisco Optical. Cisco icons, shapes, stencils and symbols
Related Solution:
If you are just a beginner in drawing flowcharts, it may seem that a sheet of paper and a pen are just enough. However, at the time you would want to share your results, diagramming applications would suite you better. it’s very easy to create diagrams that way and to discover new kinds of flowcharts.
The huge collection of sample ConceptDraw diagrams, charts, illustrations and other types of business drawings includes a wide range of business themes. A huge number of graphic images of ConceptDraw documents is divides on business application areas according to business-oriented solutions for which they were made.Here is a short visual list of samples of flowcharts, process diagrams, UML models, management charts, computer network diagrams, maps, infographics, illustrations, etc. In short, each ConceptDraw solution is accompanied with at least ten samples representing some particular examples of the application of the given chart.
Picture: Applications
Database structures are usually described by ER-diagrams which represents entities as boxes with lines-connections between them. You can create any entity-relationship diagram (ERD) by means of ConceptDraw DIAGRAM using ready-to-use templates and special libraries containing all the needed symbols and shapes. Creating a model for your database from now on can take just a few minutes.
ERD (entity relationship diagram) designed to show the logical structure of databases. It intended to depict the relationships between data components (entities). ERDs are a popular tool for software engineers and architects. Using ERD they can manage the every aspect of database design. Also ERD can be used as guidelines for testing and communications before software release. This diagram represents the file reference system of the WordPress web platform. Because entity relationship diagrams have such a broad application area through the prevalence of database technology, it can be applied for a wide range of users.
Picture: Entity-Relationship Diagram (ERD) with ConceptDraw DIAGRAM
Related Solution:
Pyramid diagrams help you visualize information as a triangle divided into horizontal slices. Labelled slices represent a hierarchy. Pyramids are used in marketing presentations to show and analyze hierarchy levels.
3D triangular diagram of DIKW pyramid has 6 levels: measurement, facts, data, information, knowledge, wisdom.
The data component include different scattered signs or symbols which are merely useless until these random objective facts are somehow processed. Data is a resource which has to be manipulated or rearranged to get useful. Information can be extracted from a pile of data, it also can be mined from different data storages.
Picture: Pyramid Diagram
Related Solutions:
Use it to make professional looking documents, presentations, and websites illustrated with color scalable vector clipart for geography, weather, and animals.
Picture: How can you illustrate the weather condition
Computer networks nowadays are spread all across the world. The large number of parameters, such as geographic scale or communication protocols, can divide networks. One of the most common types of networks is called local area network (LAN). It convenient to represent network examples by means of diagrams.
This local area network (LAN) diagram provides an easy way to see the way the devices in a local network are interacted. The diagram uses a library containing specific symbols to represent network equipment , media and the end-user devices such as computers (PC, mac, laptop) , network printer, hubs, server and finally a modem. There are two types of network topologies: physical and logical. The current diagram represents precisely a physical type of LAN topology because it refers to the physical layout of a local network equipment.
Picture:
What is a Local Area Network?
Examples of LAN Diagrams
Related Solution:
Any classroom is unique for the room layout, for the location of windows and lighting, the purposes of the classes are also different, so the arrangement of chalkboard and seating places will be different and must consider all these points. ConceptDraw DIAGRAM software extended with School and Training Plans Solution from the Building Plans Area of ConceptDraw Solution Park offers you the possibility to design the Classroom Seating Charts of any complexity.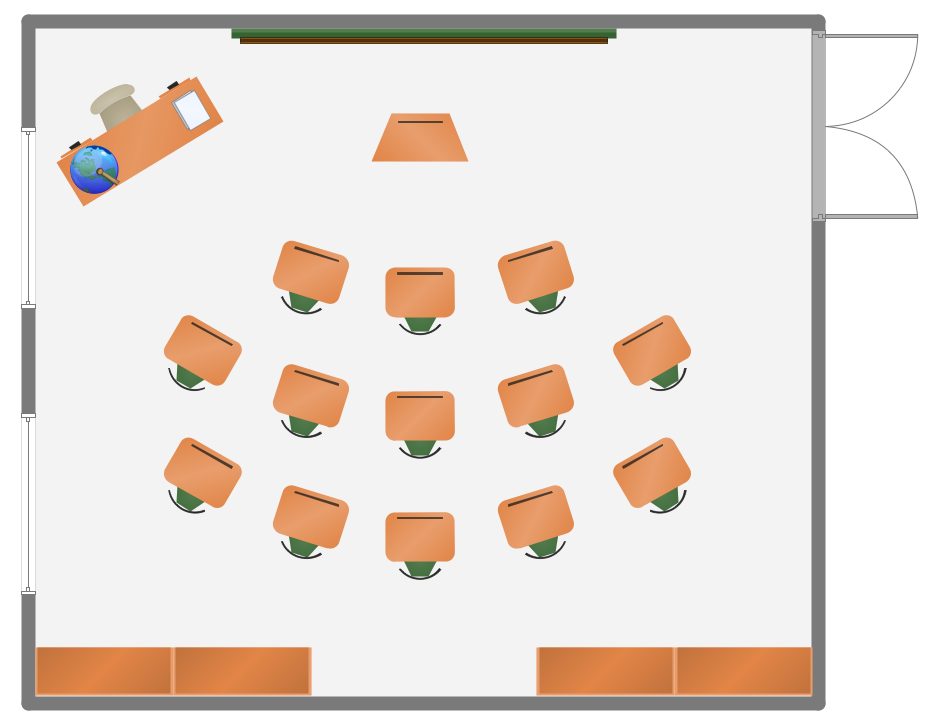
Picture: Classroom Seating Charts
Related Solution:
The Time-Money-Quality Triangle illustrates an advertising truism, that you can't have all three.
Picture: Pyramid Diagram
Related Solutions:

