Made with
ConceptDraw
DIAGRAM 18

Create Organizational Chart

CSOdessa team is happy to provide cost-effective organizational chart software for companies of any size. It is a ConceptDraw DIAGRAM extended with Organizational Charts Solution from the Management Area.

ConceptDraw DIAGRAM organizational chart professional software allows quickly create organizational chart, flow charts, timelines, visualize company Organizational chart, hospital Organizational chart, hotel Organizational chart, corporate organizational chart, and much more. Use it for drawing organizational charts for any size company and analyzing organizational structure.

Company Organizational Chart Sample

Example 1. Company Organizational Chart Sample

Thanks to the tools of Organizational Charts Solution you can quick and easy create organizational chart. Among these tools are the following:

  • A set of very convenient Organizational chart templates. You can use Organizational chart templates from ConceptDraw STORE to make the process of Organizational chart creation easier and quicker;
  • Extensive Organizational chart library of tasks-specific symbols and shapes for creating organizational chart;
  • Helpful business Organizational chart examples, a lot of company Organizational chart samples!
  • Opportunity to use Organizational Chart software ConceptDraw DIAGRAM for free up to 21 days! Free updates!
  • Share your company Organizational chart in presentation, local Intranet, on WEB;
  • Organizational chart software ConceptDraw DIAGRAM is a perfect analyzer tool for managers;
  • Organizational chart software ConceptDraw DIAGRAM is an ideal tool for Administrative staff to clearly represent the company Organizational structure.

Create Organizational Chart

  • Launch ConceptDraw DIAGRAM
  • Set a page orientation: File – Page Setup – Horizontal Orientation – Ok.

    Create Organizational Chart

  • Open the Organizational Charts library from the Libraries panel.

    Create Organizational Chart

  • Take the Consultant (title) object from the library. Place it on the page.

    Create Organizational Chart

  • Open Inspectors – Line tab – Set Pattern, Change color.

    Create Organizational Chart

  • Inspectors – Fill Tab – Change color, set Opacity.

    Create Organizational Chart

  • Add the text – Open the Text tab from Inspectors – Change color, font, font size.

    Create Organizational Chart

  • From the View Menu switch Rulers, Guides.

    Create Organizational Chart

  • Open the Tools Menu – Snap & Glue – Select Glue to Guides.

    Create Organizational Chart

  • Drag Horizontal Guide from the Ruler to the page.

    Create Organizational Chart

  • Glue the object to the Guide.

    Create Organizational Chart

  • Drag Vertical Guide from the Ruler to the page.

    Create Organizational Chart

  • Take the Consultant object from the library – Glue it to Vertical Guide.

    Create Organizational Chart

  • Change the object size using the Control dots.

    Create Organizational Chart

  • Open Inspectors:
  • Line tab – Deselect Stroke.

    Create Organizational Chart

  • Fill tab – Change color, set Opacity.

    Create Organizational Chart

  • Text tab – Change color, set font, font size.

    Create Organizational Chart

  • Holding down the Option key (ALT), copy the object. Place it on the Guide.

    Create Organizational Chart

  • Add the text.

    Create Organizational Chart

  • Select all the Consultant objects – Distribute option from the Toolbar – Middle.

    Create Organizational Chart

  • Go to the File Menu – Document Properties – Page size – A3.

    Create Organizational Chart

  • Holding down the Option key (ALT), copy the object. Place it on page. Add the text.

    Create Organizational Chart

  • Arrange the objects using Guides.

    Create Organizational Chart

  • File – Document Properties – Page size – Adjust to drawing content – Ok.

    Create Organizational Chart

  • Delete Guides.
  • Align – Align objects.

    Create Organizational Chart

  • Distribute option – Arrange the distance between the objects.

    Create Organizational Chart

  • Select the objects (the main object will be selected with green color) – use Tree Mode from the Toolbar or Tools Menu – Tree Connection Mode.

    Create Organizational Chart

  • The objects will be connected with a direct connector by default.

    Create Organizational Chart

  • Select Smart Connector as a kind of connection.

    Create Organizational Chart

  • Select all connectors –open Inspectors – Line tab – Set Endpoints.

    Create Organizational Chart

  • Make color same as of the main object using Eyedropper.

    Create Organizational Chart

  • Connect all the object rows the same way.

    Create Organizational Chart

  • Drag a yellow diamond of the connector to arrange it.

    Create Organizational Chart

  • Double click on the white space of the page – enter diagram name.

    Create Organizational Chart

  • To edit the text, select it and open the Text tab from Inspectors. Set Font, Font size, Color.

    Create Organizational Chart

  • Shape – Fit to Text.

    Create Organizational Chart

  • Now your Drawing is ready:

    Create Organizational Chart

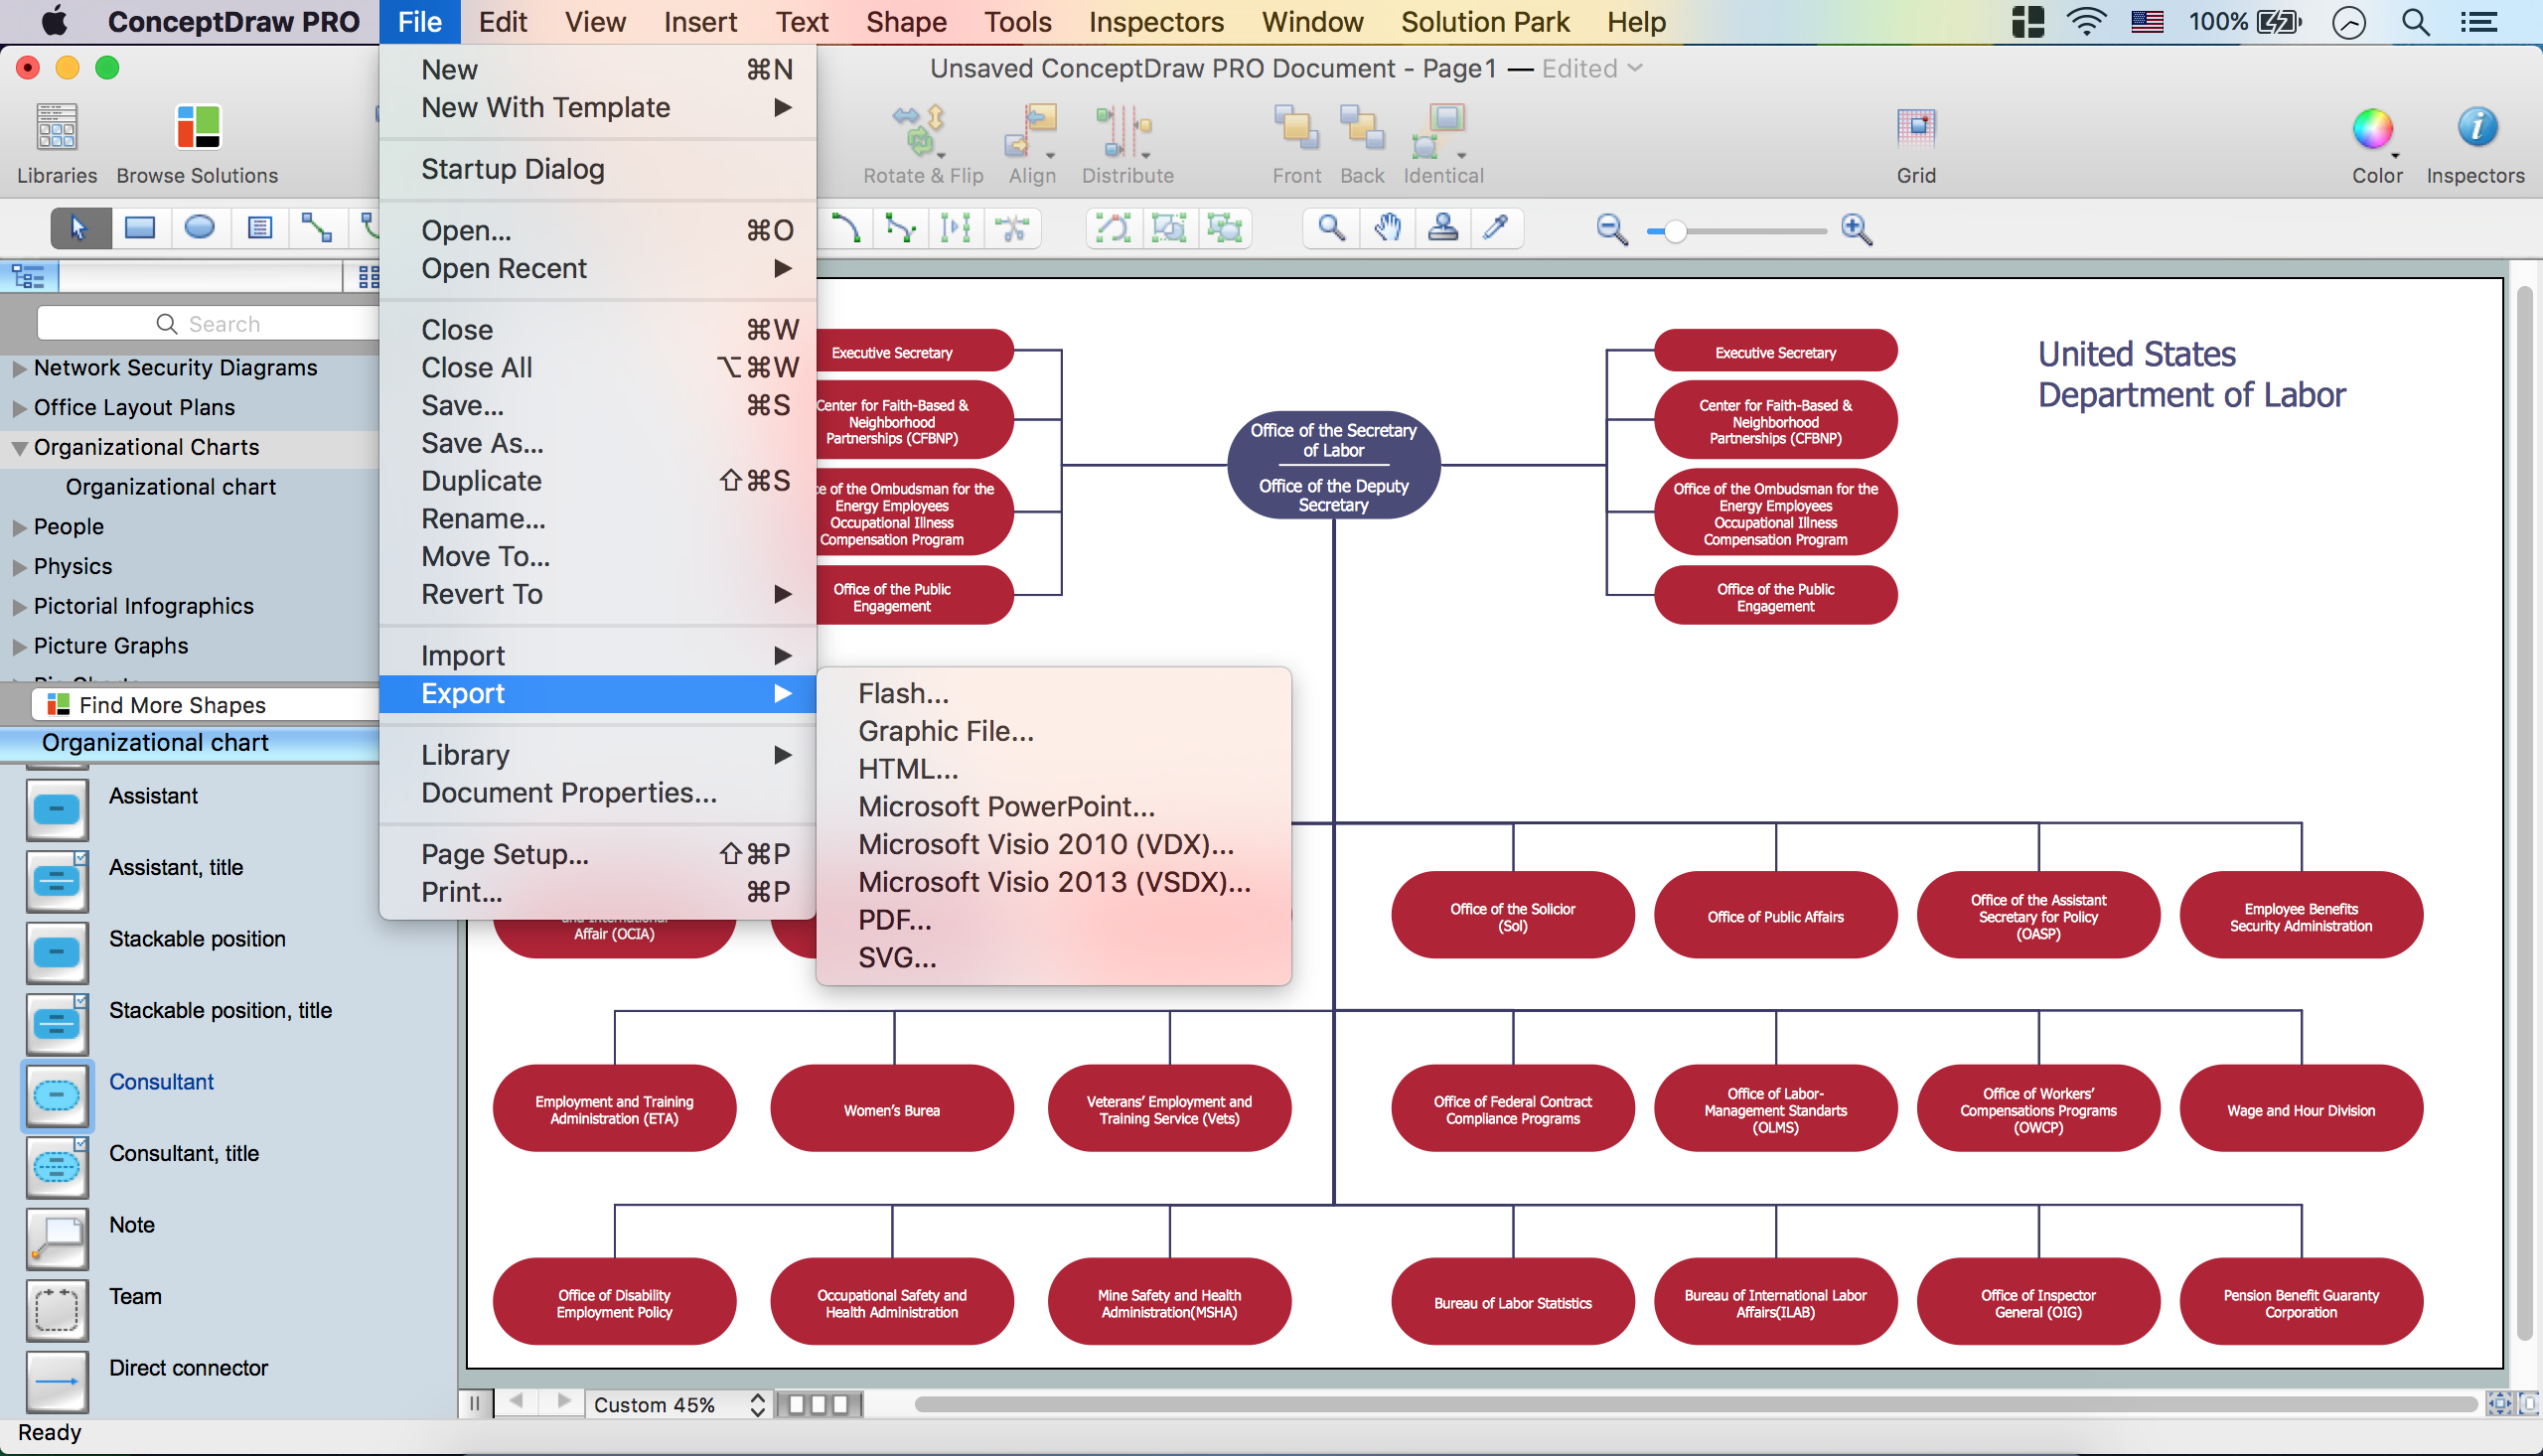
  • You may save it or export to different formats via the File Menu.
Create Organizational Chart *

Advantages of ConceptDraw Organizational Chart Software:

  • Visualize company structure via Organizational chart.
  • Automate Organizational chart creation. Import data from particularly any source.
  • Company Organizational chart with detailed staff information.
  • Specialized Organizational chart creation tools.
  • Single and multi-page Organizational chart with hyperlinks.
  • Extensive Export/Import possibilities (HTML, PDF, Flash, PowerPoint, MS Visio, etc).
  • Possibility to publish Organizational chart and corporate contact information on WEB, your Intranet.

Use ConceptDraw DIAGRAM to oreate Organizational Chart. No other Organizational chart software gives you all these benefits at such reasonable price!


TEN RELATED HOW TO's:
Describing a workflow or approval process can take hours and be too complicated, especially since there are options to do it quickly and vividly. Diagrams called flowcharts replace long paragraphs of boring text and represent information in a graphic way. You can draw one on paper or you can use flowchart software to do it quickly and scalable. This kind of software is easy to use and you don’t need any special skills to start using it. In addition, there are a lot examples and predesigned templates on the Internet. Flowcharts are a best tool for staking out a huge and complex process into some small readable parts. Surely, flowcharts can be drawn manually but the use of standard symbols that make it clear for a wide audience makes a software tool preferred for this task. The core for a successful flowchart is its simplicity. That is why often before beginning making flowchart through software, people draw the sketch on a piece of paper. Designing an effective flowchart means the combination of the data needed to be shown and the simplicity with which you depict it.Flowchart Software
Picture: Flowchart Software: A Comprehensive Guide
Related Solution:
Want to create Diagrams for Amazon Web Services architecture? ConceptDraw Solution Park with AWS architecture Solution will help you!How To create Diagrams for Amazon Web Services architecture *
Picture: How To create Diagrams for Amazon Web Services architecture
Bureaucratic companies usually are characterized by a strict hierarchy and clearly defined responsibilities. However, sometimes organizational structure of a company reminds of somewhat tangled. To clarify it, you can create an orgchart that will represent the company as a tree with its' departments as branches. This organization diagram represents a tree-like organizational structure. This is a typical example of a top-level branches of the hierarchical organizational structure. This part of the tree shows heads of branches who are subordinated completely to the president. The information and solutions are distributed though a tree structure down to the company's departments. Each of the sub-division has its own structure that is reflected in the corresponding organizational chart. This orgchart diagram was created using the vector graphic library supplied with ConceptDraw Organizational Charts solution.Organizational Structure *
Picture: Organizational Structure
Related Solution:
ConceptDraw - Organigram software allows quickly create Organigrams and much more. ConceptDraw DIAGRAM is an ideal tool for Administrative staff to clearly demonstrate the company orgchart professional.Organigrams with ConceptDraw DIAGRAM  *
Picture: Organigrams with ConceptDraw DIAGRAM
Related Solution:
This sample was created in ConceptDraw DIAGRAM diagramming and vector drawing software using the Organizational Charts Solution from the Software Development area of ConceptDraw Solution Park. This sample shows the organizational chart in the field of Architect Engineering. Create your own orgchart professional drawings using ConceptDraw.Business Board Org Chart *
Picture: Business Board Org Chart
Related Solution:
Understanding the connections between an organization department might take some time. If you are a newcomer to a company, an orgchart would help you if don’t know who to call when questions appear. This scheme usually is printed on one of the walls in the office. This template of orgchart is supplied with the ConceptDraw add-on containing solutions for making organizational charts. You can use it to depict an organizational structure of your company. The only you need is - open this template and alter it to cover an organizational features of your business. It is easy to rearrange the orgchart structure by dragging the elements by mouse. Finally fill the template with particular positions of your company's staffing table.Orgchart *
Picture: Orgchart
Related Solution:
Workflow Diagram created by using special software based on graphic mastering technology Arrows10. Its automatics follows the global concept of business graphics and diagramming. The practical effectiveness of Arrows10 technology used in ConceptDraw DIAGRAM are around the quick auto-arrows behaving as expected and connecting boxes of workflow diagram from workflow symbol to process flow symbol. ConceptDraw DIAGRAM is a workflow diagram software contains specific features help you to draw diagrams faster, such as RapidDraw, or Arrows10. There is also a rich set of samples and templates to give you an example of data may be visualized as workflow diagram.Workflow Diagram Data *
Picture: Workflow Diagram Data
Related Solution:
Learn the most common process flowchart symbols used in business process diagrams and workflow charts. Includes symbol meanings, examples, and a practical reference table.Process flowchart symbols reference chart showing terminator, process, decision, input output, document and predefined process shapes
Picture: Process Flowchart Symbols: Meaning, Types and Examples
Related Solution:
If you need to describe some process, diagramming is a perfect tool for almost any imaginable purpose. The set of the most commonly used flow charts symbols is quite wide and includes symbols for operations, processes, data inputs and outputs. You can see the full list of all the symbols used for flowcharting in Flowcharts solution from Diagrams area in ConceptDraw Solution Park. A flow chart is often used for visual representation of a sequential process flow. The flowchart approach to any process is to divide it into some sequential actions. What makes a flow chart so popular and clear to make out is the set of standard flowchart symbols that has the same reading independently from processes described with their applying. The current drawing represents the vector library containing the pack of standard flowchart symbols. This library is supplied with ConceptDraw Flowcharts solution.Flow Chart Symbols
Picture: Flow Chart Symbols
Related Solution:
If you want to find a way to understand complex things in minutes, you should try to visualize data. One of the most useful tool for this is creating a flowchart, which is a diagram representing stages of some process in sequential order. There are so many possible uses of flowcharts and you can find tons of flow charts examples and predesigned templates on the Internet. Warehouse flowchart is often used for describing workflow and business process mapping. Using your imagination, you can simplify your job or daily routine with flowcharts. Warehouse flowcharts are used to document product and information flow between sources of supply and consumers. The flowchart provides the staged guidance on how to manage each aspect of warehousing and describes such aspects as receiving of supplies; control of quality; shipment and storage and corresponding document flow. Warehouse flowchart, being actual is a good source of information. It indicates the stepwise way to complete the warehouse and inventory management process flow. Also it can be very useful for an inventory and audit procedures.Warehouse Flowchart
Picture: Flow Chart Example: Warehouse Flowchart
Related Solution:
ConceptDraw
DIAGRAM 18