ConceptDraw MINDMAP :
Brainstorming, Mind Mapping
for macOS and Windows
ConceptDraw MINDMAPCapture What You Think, Do What You Plan ConceptDraw MINDMAP is a powerful business and personal productivity software application that provides visual organization and access to information for individuals and organizations:

TEN RELATED HOW TO's: ConceptDraw MINDMAP and Evernote has a multitude of options for users — you can save any part of a mind map: including topics, branches, and entire maps to your Evernote.  Picture: Evernote + MindMapping Related Solution: Use Case Diagrams technology. Using visual graphical objects IDEF1 standard allows to model information interrelations.  Picture: IDEF1 standard A pie chart is a circular diagram showing a set of data divided into proportional slices. There are several variations of this chart such as donut chart, exploded pie chart, multi-level pie charts. Although it is not very informative when a ring chart or circle chart has many sections, so choosing a low number of data points is quite important for a useful pie chart.
ConceptDraw DIAGRAM software with Pie Charts solution helps to create pie and donut charts for effective displaying proportions in statistics, business and mass media for composition comparison, i.e. for visualization of part percentage inside one total.  Picture: Pie Chart Software Related Solution: This sample shows the Pie Donut Chart. It was created in ConceptDraw DIAGRAM diagramming and vector drawing software using the ready-to-use object from the Pie Charts Solution from Graphs and Charts area of ConceptDraw Solution Park.
The Pie Donut Chart visualizes the percentage of parts of the whole and looks like as a ring divided into sectors. Pie Donut Charts are widely used in the business, statistics, analytics, mass media.  Picture: Pie Donut Chart. Pie Chart Examples Related Solution: Genomics → Genetic engineering is moving in a rapid fashion. There are new discoveries occurring at an incredibly fast pace.
This map was created from content found at FAQ About Genetic and Genomic Science (National Human Genome Research Institute, www.genome.gov) and shows how simple in is to use a map structure to explain complex subjects. The content from this map and maps similar to this can be used with the eLearning for Skype solution for ConceptDraw MINDMAP to present complex information in a simplified manner.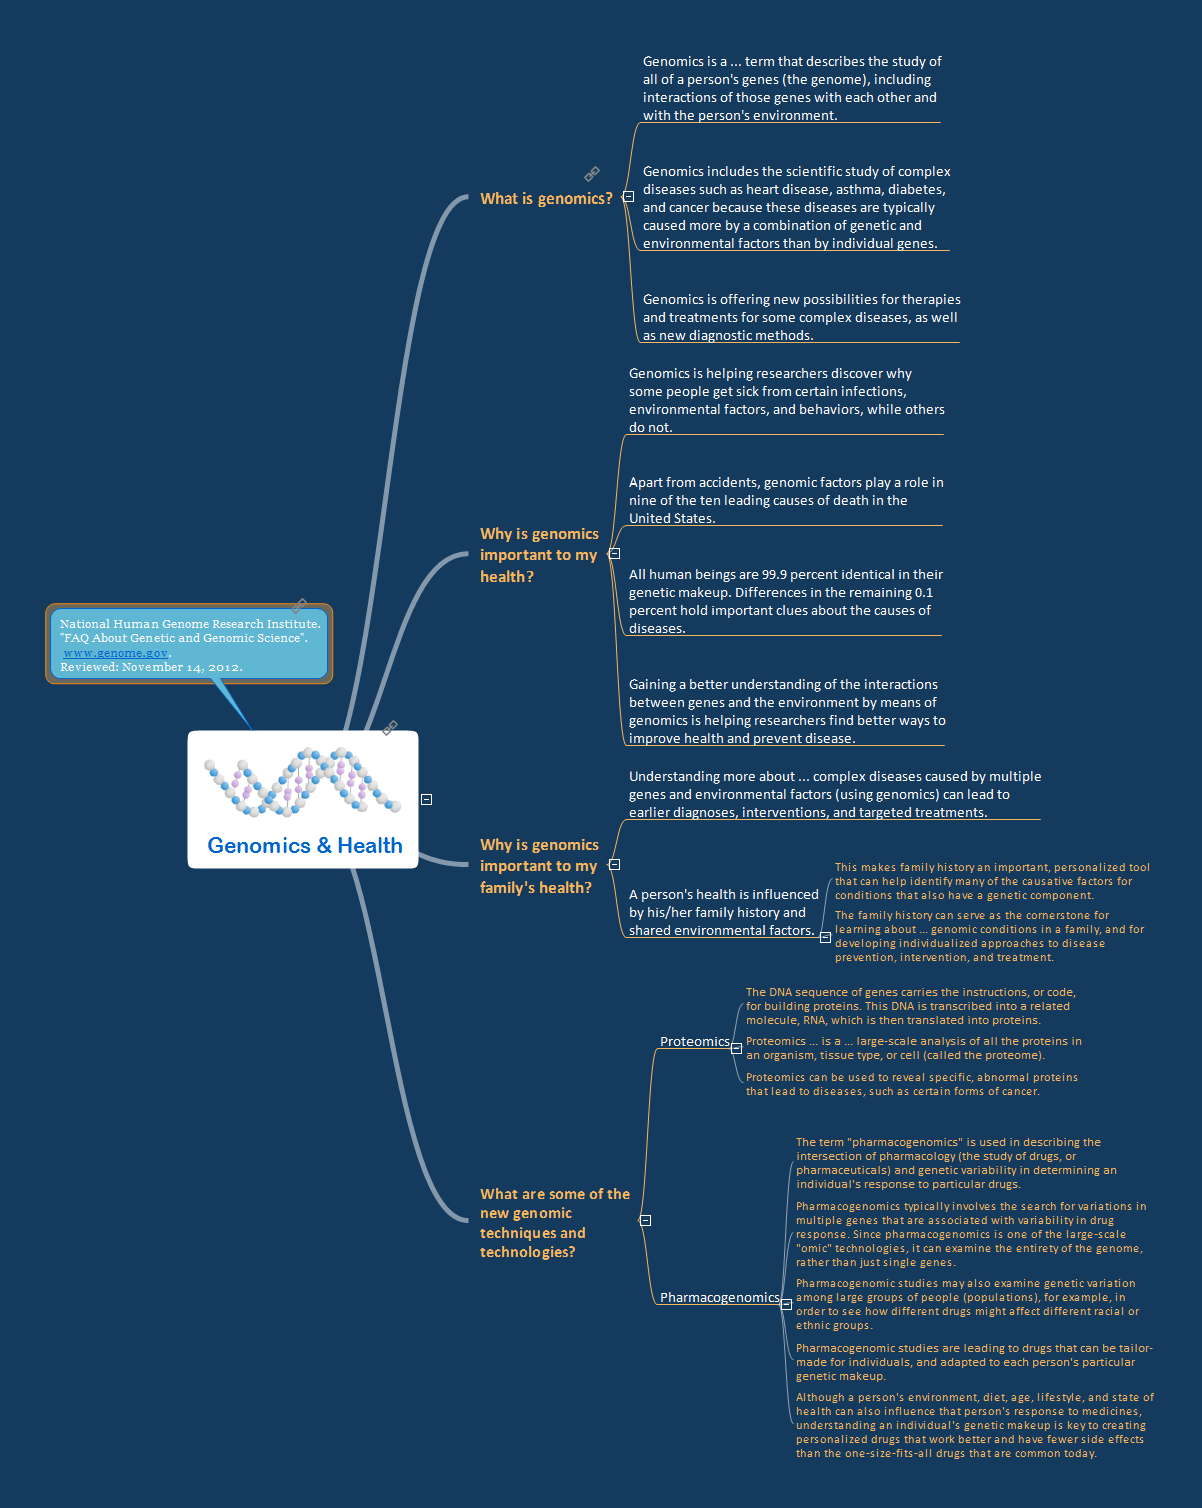 Picture: Genomics Related Solution: ConceptDraw MINDMAP is effective Mind Mapping Software with rich clipart galleries, extensive drawing capabilities, a large quantity of examples of professionally designed mind maps on the different themes and powerful import and export capabilities.  Picture: Mind Mapping Software Related Solution: The Building Plans are very useful and even necessary for architects, builders, designers and simple for those who want to build the home, office, flat or anyone other building. They are also convenient for those who want to design or redesign the home, flat, room, etc. 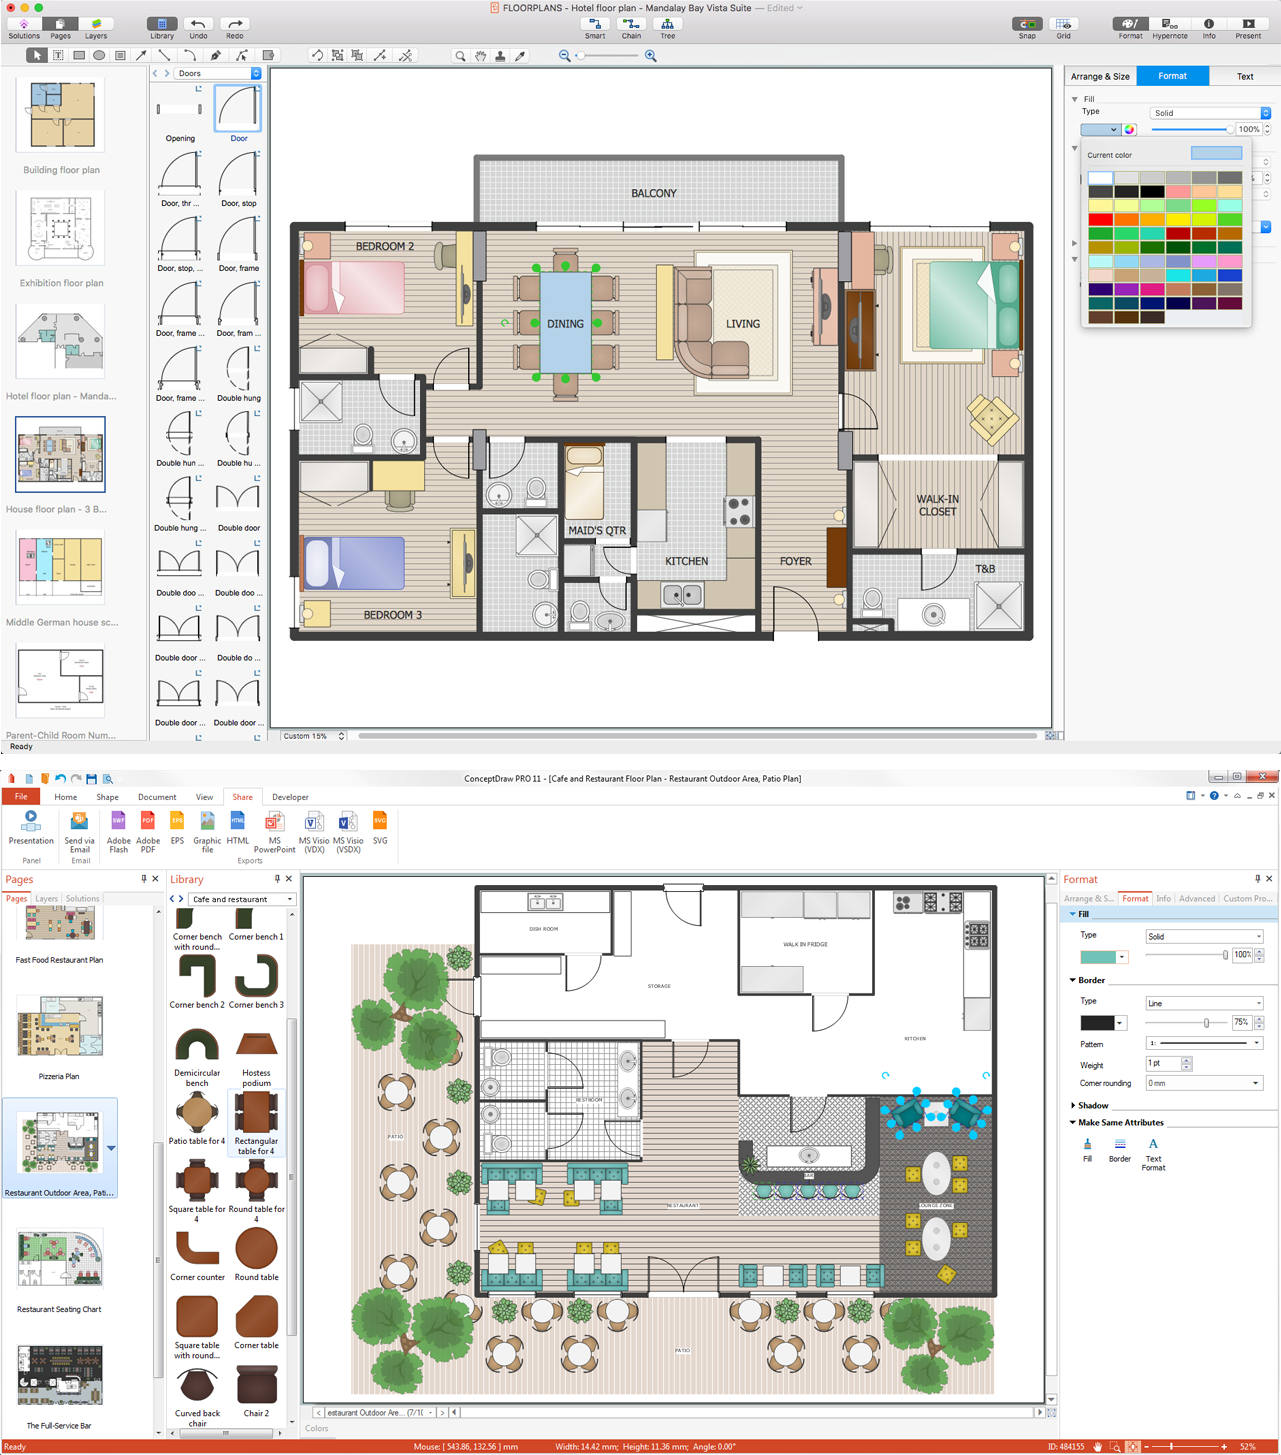 Picture: Building Plan Software. Building Plan Examples Related Solution: Describing a workflow or approval process can take hours and be too complicated, especially since there are options to do it quickly and vividly. Diagrams called flowcharts replace long paragraphs of boring text and represent information in a graphic way. You can draw one on paper or you can use flowchart software to do it quickly and scalable. This kind of software is easy to use and you don’t need any special skills to start using it. In addition, there are a lot examples and predesigned templates on the Internet.
Flowcharts are a best tool for staking out a huge and complex process into some small readable parts. Surely, flowcharts can be drawn manually but the use of standard symbols that make it clear for a wide audience makes a software tool preferred for this task. The core for a successful flowchart is its simplicity. That is why often before beginning making flowchart through software, people draw the sketch on a piece of paper. Designing an effective flowchart means the combination of the data needed to be shown and the simplicity with which you depict it.  Picture: Flowchart Software: A Comprehensive Guide Related Solution: This sample was created in ConceptDraw DIAGRAM diagramming and vector drawing software using the Bubble Diagrams Solution from the Diagrams area of ConceptDraw Solution Park.
This sample clearly shows the Four Dimensions Bubble Diagram of the distribution of chlorine contaminant in the water source. This Bubble Diagram is very useful in the chemistry, hydrology, and ecology.  Picture: Four Dimensions Bubble Plot Related Solution: Visio for Mac and Windows - ConceptDraw as an alternative to MS Visio. ConceptDraw DIAGRAM delivers full-functioned alternative to MS Visio. ConceptDraw DIAGRAM supports import of Visio files. ConceptDraw DIAGRAM supports flowcharting, swimlane, orgchart, project chart, mind map, decision tree, cause and effect, charts and graphs, and many other diagram types.  Picture: Is ConceptDraw DIAGRAM an Alternative to Microsoft Visio? ConceptDraw DIAGRAM 18 | |||||||||||||||||||


