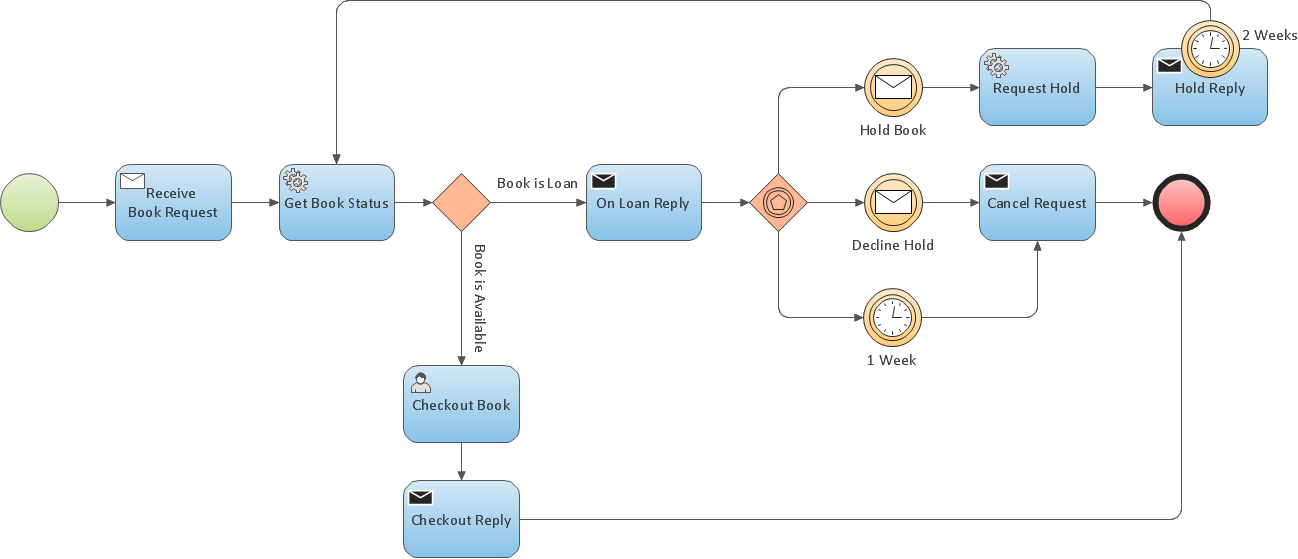
An internal (private) business process is internal to a specific organization and is the type of processes that have been generally called workflow, BPM processes or orchestration of services. It can be executable and non-executable. A private business process is contained within a single pool. The flow of messages can cross the pool boundary to show the interactions that exist between separate private business processes.
TEN RELATED HOW TO's:
This sample was created in ConceptDraw DIAGRAM drawing software using the Flowcharts solution.
Picture: Horizontal Flowchart
Related Solution:
ConceptDraw DIAGRAM diagramming and vector drawing software supplied with GHS Hazard Pictograms Solution from the Industrial Engineering Area of ConceptDraw Solution Park offers the OSHA HAZCOM pictograms, GHS hazard pictograms for easy representing the OSHA's program positions and requirements in a simple and visual way.
Picture: OSHA HAZCOM pictograms
Related Solution:
Use ConceptDraw DIAGRAM diagramming and vector graphics software to visually model your own IT construction processes.
Picture: How to Create a Process Flowchart
Related Solution:
Communication is the main challenge and the key success factor for remote project management. Communicating visually via Skype you bring all team and customers onto the one page.
Remote Presentation for Skype solution for ConceptDraw MINDMAP helps communicate with remote team and customers in visual manner on wide range of issues. Using this solution for regular status meetings allows you to push your team on tasks and keep task statuses up to date.
Picture: Communication Tool for Remote Project Management
Related Solution:
ConceptDraw DIAGRAM is the best BPMN software for ✔️ modeling business processes, ✔️ graphical documenting processes, ✔️ analysis processes, ✔️ optimization business processes, ✔️ identifying inefficiencies, ✔️ efficient decision-making based on created Business Process Diagrams and Business Process Models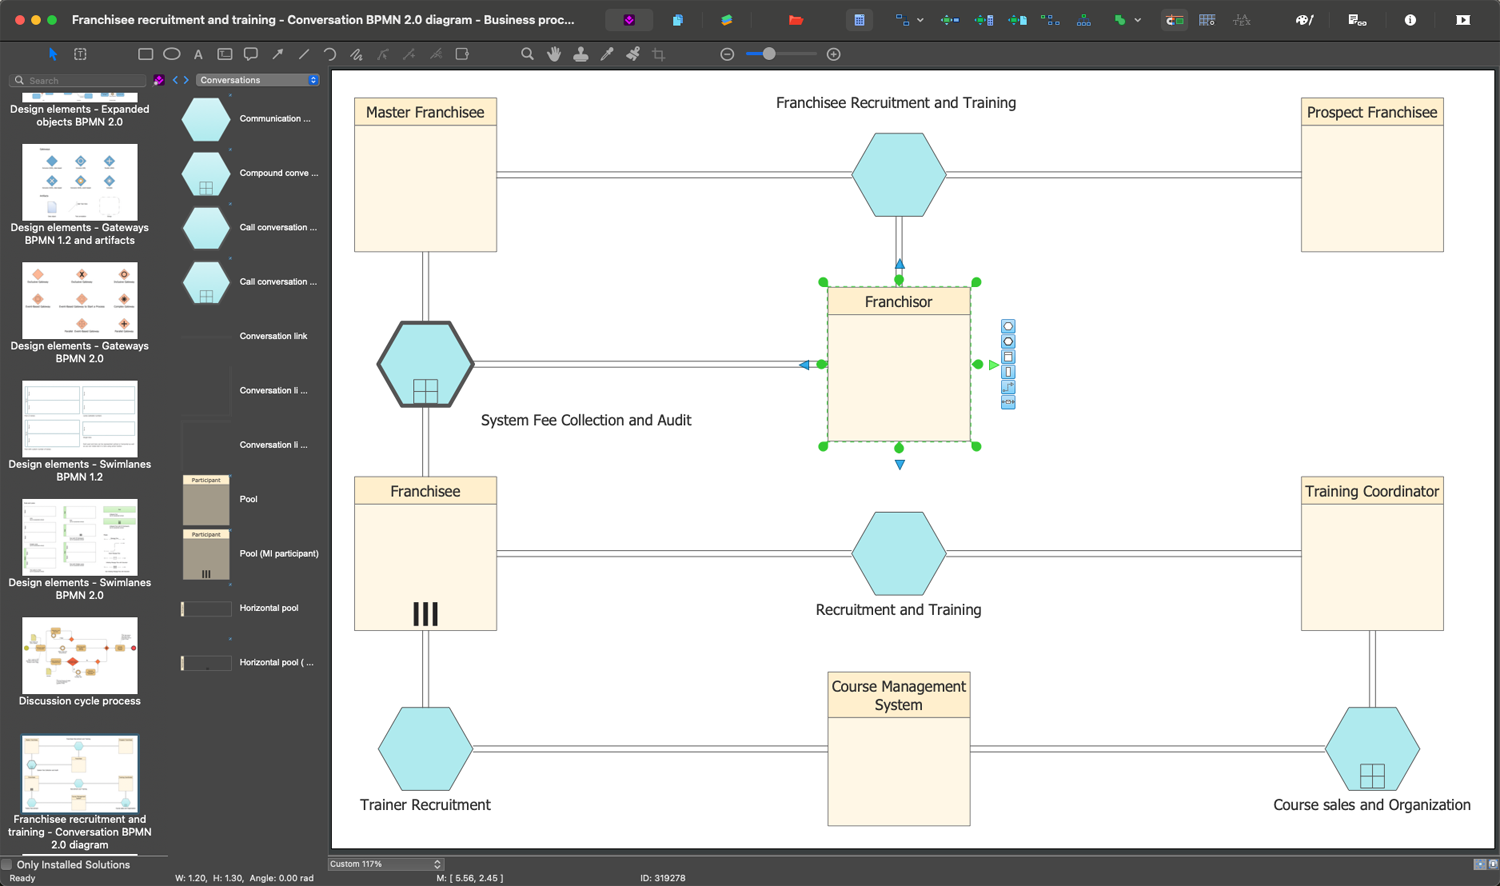
Picture: The Best Business Process Modeling Software: Comprehensive Guide
Related Solution:
The behavior of worker in organization is influences organizational effectiveness. A simple block diagram made with ConceptDraw Block diagrams solution can improve the understanding of expectations of workers regarding what they l contribute to organization and what they wait to obtain. Making block diagram depicting the individual behavior in organization is used in HR management to obtain an optimal and positive overall contribution to the organization.
The behavior of worker in organization is influences organizational effectiveness. A simple block diagram made with ConceptDraw Block diagrams solution can improve the understanding of expectations of workers regarding what they l contribute to organization and what they wait to obtain. Making block diagram depicting the individual behavior in organization is used in HR management to obtain an optimal and positive overall contribution to the organization.
Picture: Basic Diagramming
Related Solution:
A flowchart is a picture of the separate steps of a process in sequential order.
ConceptDraw DIAGRAM is a Process Flowcharts software. This software includes basic package of process flow examples. The software contains object libraries with vector stencils that allows you use RapidDraw technology. By clicking on direction arrows you can add a new object to the flowchart.
Picture: Example Process Flow
Related Solution:
ConceptDraw DIAGRAM diagramming and vector drawing software extended with Sales Flowcharts solution from the Marketing area of ConceptDraw Solution Park offers the set of extensive tools for quick and easy drawing professional looking Sales Process Flowcharts.
Picture: Sales Process Flowcharts
Related Solution:
A competent delegation of responsibilities between workers guarantees business success in most cases. At first sight, it might seem that workflow diagram symbols are quite similar to a regular flowchart. But workflow diagram is a more accurate way to present working processes.
Workflow diagrams are helpful for a working process analyzation, to depict a pathway of process issues, personalize responsibilities and identify resources that will help to optimize a workflow. Generally, Workflow diagram deploys flowchart symbols for displaying work process steps and relationships. But, often it require some additions and improvements to become more professional and illustrative. The Workflow solution for ConceptDraw DIAGRAM provides the user with a big library of symbols that are designed especially for workflow diagrams.
Picture: Workflow Diagram Symbols
Related Solution:
It’s not easy to plan all the details of your landscape at once. Therefore, you can use a bubble diagram to create a draft of the future project. You can develop any bubble diagrams and use them in your landscape design project with ConceptDraw DIAGRAM and it’s predesigned templates.
This bubble diagram can be applied while initiating the development of garden and landscape design. The bubble diagrams used for this purpose are different from the classic bubble diagrams. Being used in landscape and garden design, they obtain the quite another understanding. Bubbles in this diagram visualize some captured areas, which define the general spaces of a future garden: lawn, flower garden, pool, built-up area, lighting, etc. The bubble diagram represents the landscape project without any special expenses on its creation. It is better to make such simple sketch before you drill down into detailed project and cost estimates.
Picture: Bubble diagrams in Landscape Design with ConceptDraw DIAGRAM