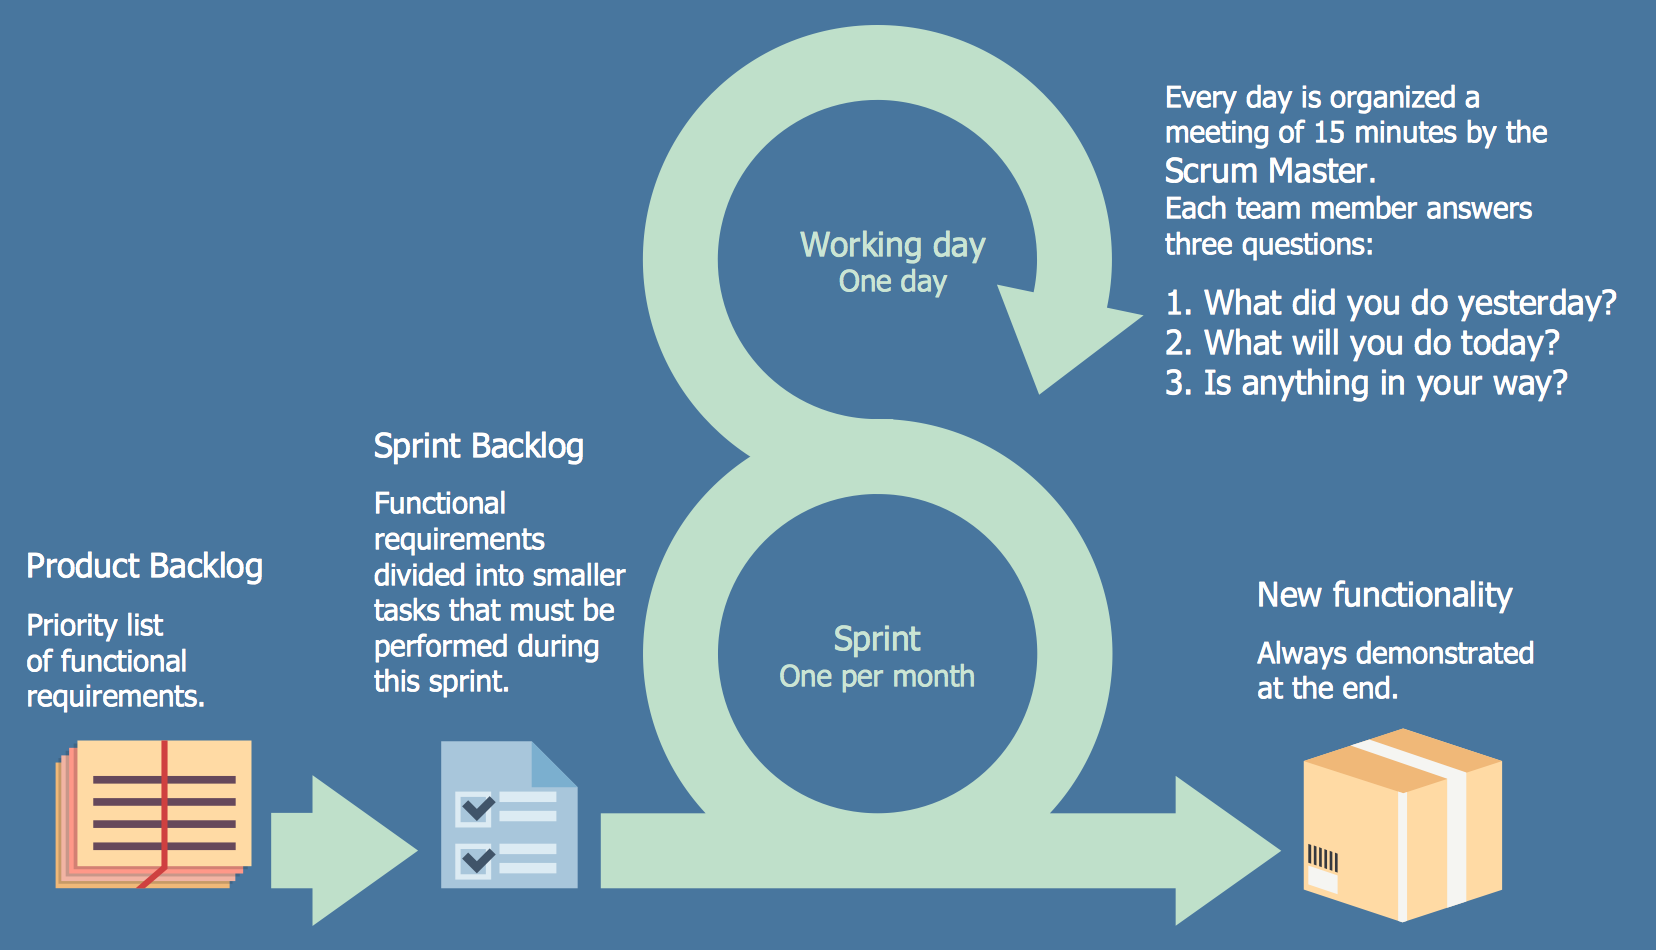
Example 1. Scrum workflow
SCRUM Workflow Solution is a combination of usability, powerful drawing tools and scrum tools. This solution provides large collection of attractive and pictorial scrum samples which are wonderful examples, inexhaustible source of inspiration and also perfect base for your own diagrams. All Scrum samples are offered at ConceptDraw STORE.

Example 2. SCRUM Workflow Solution in ConceptDraw STORE
Scrum tool
One of the main and powerful Scrum tool offered by ConceptDraw DIAGRAM software and SCRUM Workflow solution is its amazing collection of ready-to-use scrum design elements, predesigned scrum icons and clipart, scrum diagrams and live objects of scrum charts. These are 276 objects grouped in 8 libraries.
Look at this diversity! All these 276 objects are well thought-out, carefully developed by scrum specialists and the most important thing - they are vector objects, so you can easy resize them without any loss of quality.
Use with pleasure bright colors, attractive icons, graphical elements and clipart, nice fonts for your diagrams, they are helpful to make them successful! The Align tools of ConceptDraw DIAGRAM will help you make your charts accurate and tidy.
As for the live objects from the Scrum Charts library, they are useful and convenient - you need simply enter the values at the table and the chart will update automatically.

Example 3. Scrum Major Sprint Components
The Scrum samples you see on this page were created in ConceptDraw DIAGRAM using the tools of SCRUM Workflow Solution. An experienced user spent 5-10 minutes creating each of these samples.
Use the SCRUM Workflow Solution for ConceptDraw DIAGRAM Solution Park to create your own professional-looking Scrum workflow diagrams and Scrum workflow schemes of any complexity fast, easy and effective, and then successfully use them for your projects.
All source documents are vector graphic documents. They are available for reviewing, modifying, or converting to a variety of formats (PDF file, MS PowerPoint, MS Visio, and many other graphic formats) from the ConceptDraw STORE. The SCRUM Workflow Solution is available for all ConceptDraw DIAGRAM users.
|
Compatibility:
|
Apple® OS X 10.9 or later
Microsoft® Windows® 7/8.1/10
|
| Price: | ConceptDraw DIAGRAM |
$199 |
TEN RELATED HOW TO's:
A workflow diagram is less general notation than a process flow diagram. Workflow as a term can apply to organizational process which involves people, resources, documents, sort of data, for instance; whereas a process is general collection of steps occuring in any sort of activity. That is why process flow diagram can be used as workflow diagram to describe business process, data flow or department interactions.
The fastest way to create a workflow diagram is using pre-designed workflow template. ConceptDraw DIAGRAM with the Workflow Diagrams solution delivers rich set of workflow diagram templates you may start from.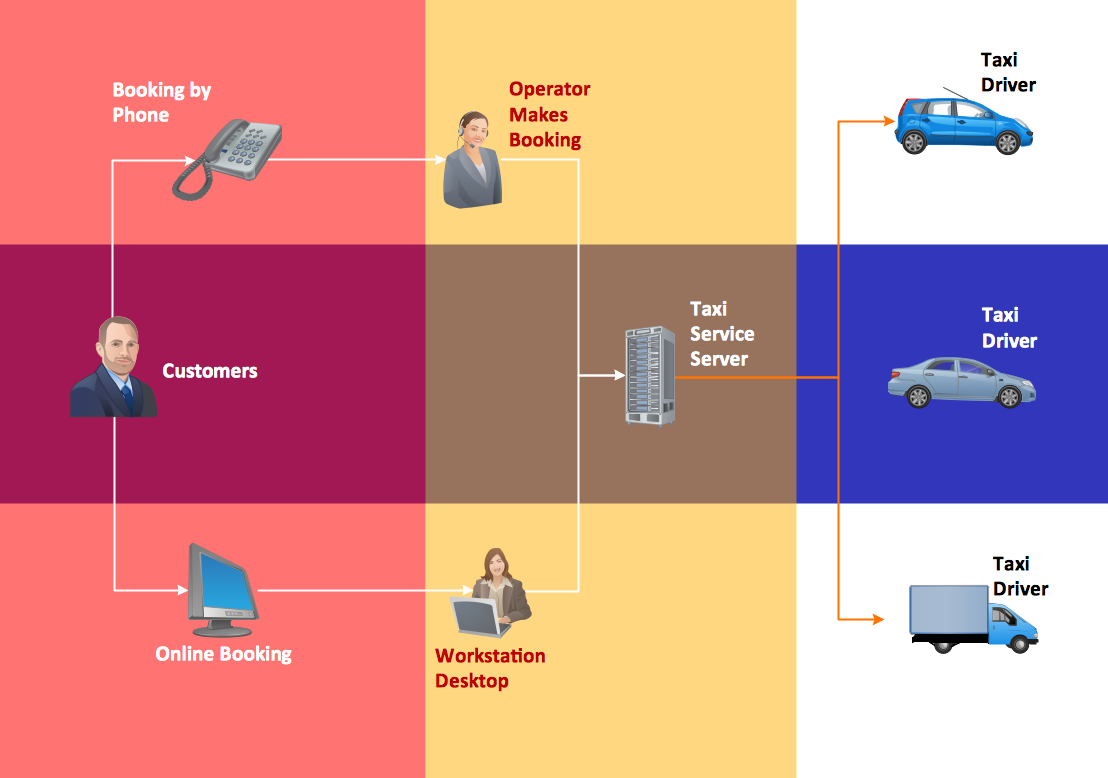
Picture: How To Create a Workflow Diagram
Related Solution:
What is Scrum? Scrum is the famous agile software development methodology which depicts an iterative and incremental approach for the work on the complex projects. Use ConceptDraw DIAGRAM diagramming and vector drawing software extended with SCRUM Workflow solution to draw various types of professional-looking Scrum Charts, Scrum Workflow Diagrams, Scrum Mind Maps, Scrum boards and attractive Scrum Infographics.
Picture: Scrum
Related Solution:
Everything about Bookkeeping: Accounting flowchart process. Which symbols to use, how to make a chart.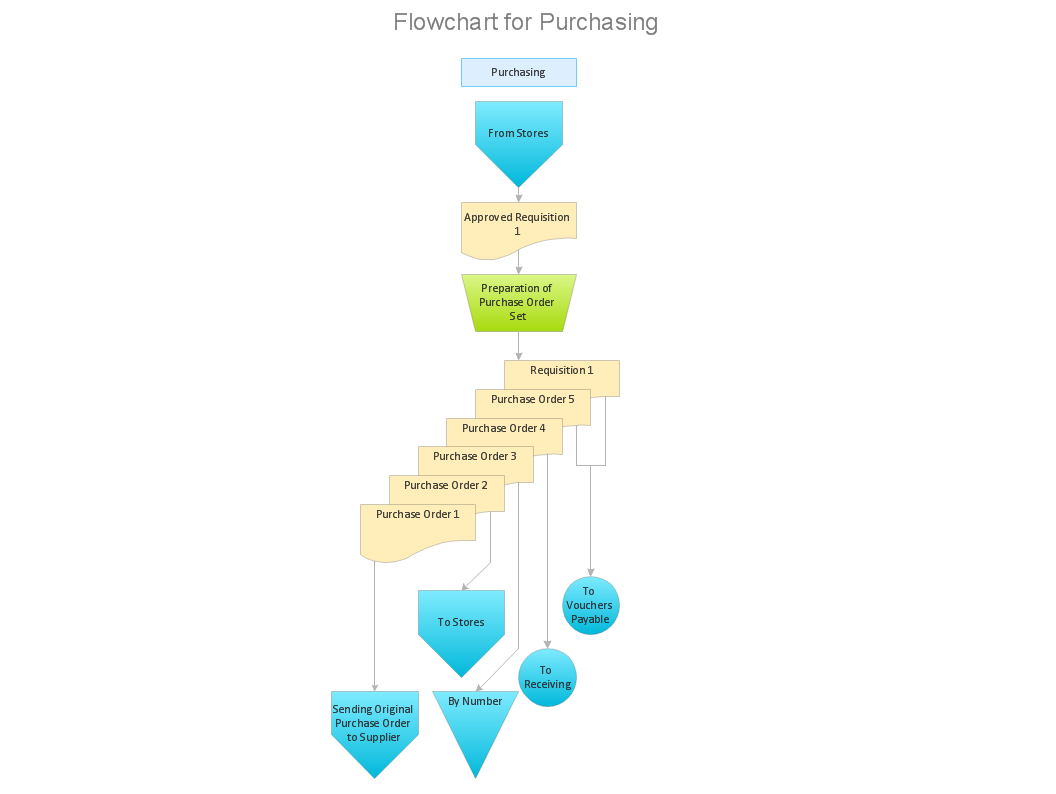
Picture: Introduction to bookkeeping: Accounting flowchart process
Related Solution:
Rack Diagrams visualize the rack mounting of computer and network equipment as the drawing of frontal view of the rack with equipment installed. They are used for choosing the equipment or racks to buy, and help to organize equipment on the racks virtually, without the real installation.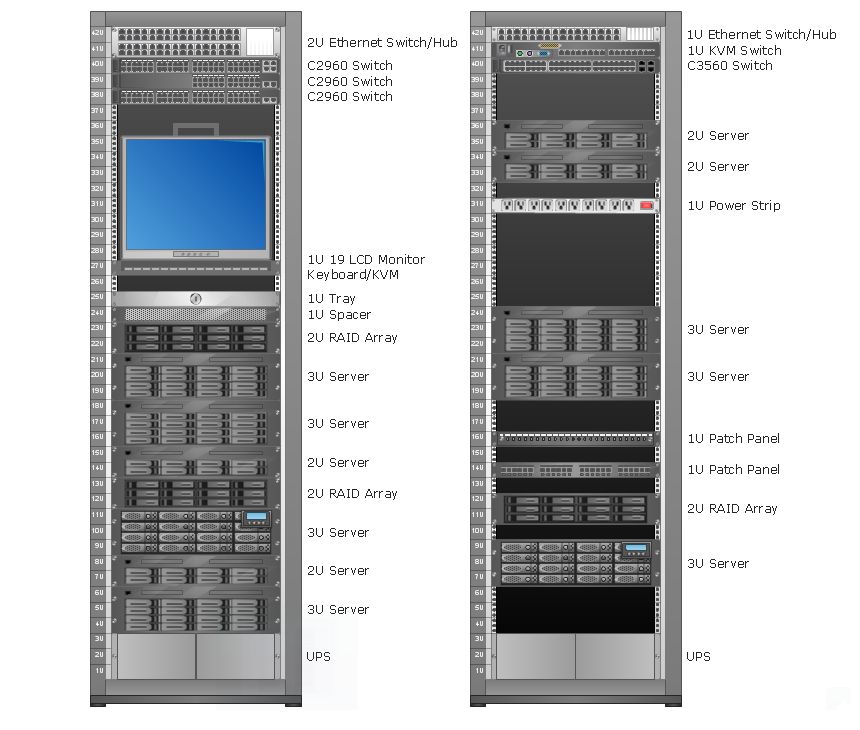
Picture: Rack Diagrams
Try ConceptDraw program, the perfect drawing tool for creating all kinds of great-looking drawings, charts, graphs, and illustrations.
Picture: Basic Diagramming
Related Solution:
ConceptDraw DIAGRAM diagramming and vector drawing software extended with Physics solution from the Science and Education area is a powerful software for creating various physics diagrams.
Physics solution provides all tools that you can need for physics diagrams designing. It includes 3 libraries with predesigned vector physics symbols: Optics Library, Mechanics Library and Nuclear Physics Library.
Picture: Physics Symbols
Related Solution:
Food courts are very popular places. You want to increase attendance, advertise and invite attention to your food court? Make interesting design and create pictorial and bright food art posters and signboards, and don't forget to decorate your menu with images of tasty treats!
ConceptDraw DIAGRAM diagramming and vector software supplied with Food Court solution from the Food and Beverage area of ConceptDraw Solution Park offers powerful drawing tools for effective food art.
Picture: Food Art
Related Solution:
Use of various charts, diagrams and infographics is the most effective way of visual presenting information about healthy foods, healthy eating and healthy diet. ConceptDraw DIAGRAM diagramming and vector drawing software offers the Health Food solution from the Food and Beverage area of ConceptDraw Solution Park which is overfull of powerful drawing tools, libraries with ready-to-use vector objects and clipart, predesigned samples and examples which will help you easy design healthy foods illustrations.
Picture: Healthy Foods
Related Solution:
Structure of a software product might get very complex and complicated, if software engineers did not pay much attention to the architecture of the product. It will take a few minutes to create UML diagrams with ConceptDraw DIAGRAM , because this software is just perfect for diagramming. You can alter ready-to-use templates, or make your own, whatever you need.
This illustration represent the example of UML diagram made by using ConceptDraw Rapid UML solution. This activity diagram displays the stages of the software development process similar to a flow chart. This diagram depicts the states of elements in the software system. It can be applied to represent software and coding logic. This UML diagram was drawn with the help of the ConceptDraw Rapid UML solution which supplies the kit of vector libraries, containing the symbols of the Unified Modeling Language notations.
Picture: UML Diagrams with ConceptDraw DIAGRAM
Related Solution:
If you want to find a way to understand complex things in minutes, you should try to visualize data. One of the most useful tool for this is creating a flowchart, which is a diagram representing stages of some process in sequential order. There are so many possible uses of flowcharts and you can find tons of flow charts examples and predesigned templates on the Internet. Warehouse flowchart is often used for describing workflow and business process mapping. Using your imagination, you can simplify your job or daily routine with flowcharts.
Warehouse flowcharts are used to document product and information flow between sources of supply and consumers. The flowchart provides the staged guidance on how to manage each aspect of warehousing and describes such aspects as receiving of supplies; control of quality; shipment and storage and corresponding document flow. Warehouse flowchart, being actual is a good source of information. It indicates the stepwise way to complete the warehouse and inventory management process flow. Also it can be very useful for an inventory and audit procedures.
Picture: Flow Chart Example: Warehouse Flowchart
Related Solution:


