This example shows a workflow chart that clearly illustrates stages of recruitment work flow.
TEN RELATED HOW TO's:
This sample was created in ConceptDraw DIAGRAM diagramming and vector drawing software using the Cross-Functional Flowcharts solution from the Business Processes area of ConceptDraw Solution Park.
This sample shows the Swim Lanes Flowchart of Identification and logging.
Picture: Swim Lanes Flowchart. Flowchart Examples
Related Solution:
If you are an advanced diagramming software user, you might use it daily. Traversing the Internet in searching of alternative to MS Visio for MAC and PC, you can fulfill all your requirements with ConceptDraw DIAGRAM. Don’t hesitate to transfer your documents to another operating system.
When looking for a smart and simple tool for business diagrams as alternative to MS Visio for Apple OS X platform, ConceptDraw DIAGRAM certainly is the best choice. Making many kinds of business charts, numerous technical drawings is what ConcepDraw DIAGRAM is the best. One can easy create any diagram and complete it perfectly and quickly. The big collection of vector object libraries, templates and samples, make it the best Microsoft Visio alternative: ConceptDraw DIAGRAM is simpler to use, less expensive, and supports project management and mind mapping methods.
Picture:
In Searching of Alternative to MS Visio for Mac and PC
with ConceptDraw DIAGRAM
Use building drawing software to develop the annotated diagrams or schematics of waste water disposal systems, hot and cold water supply systems, water lines and waste water engineering.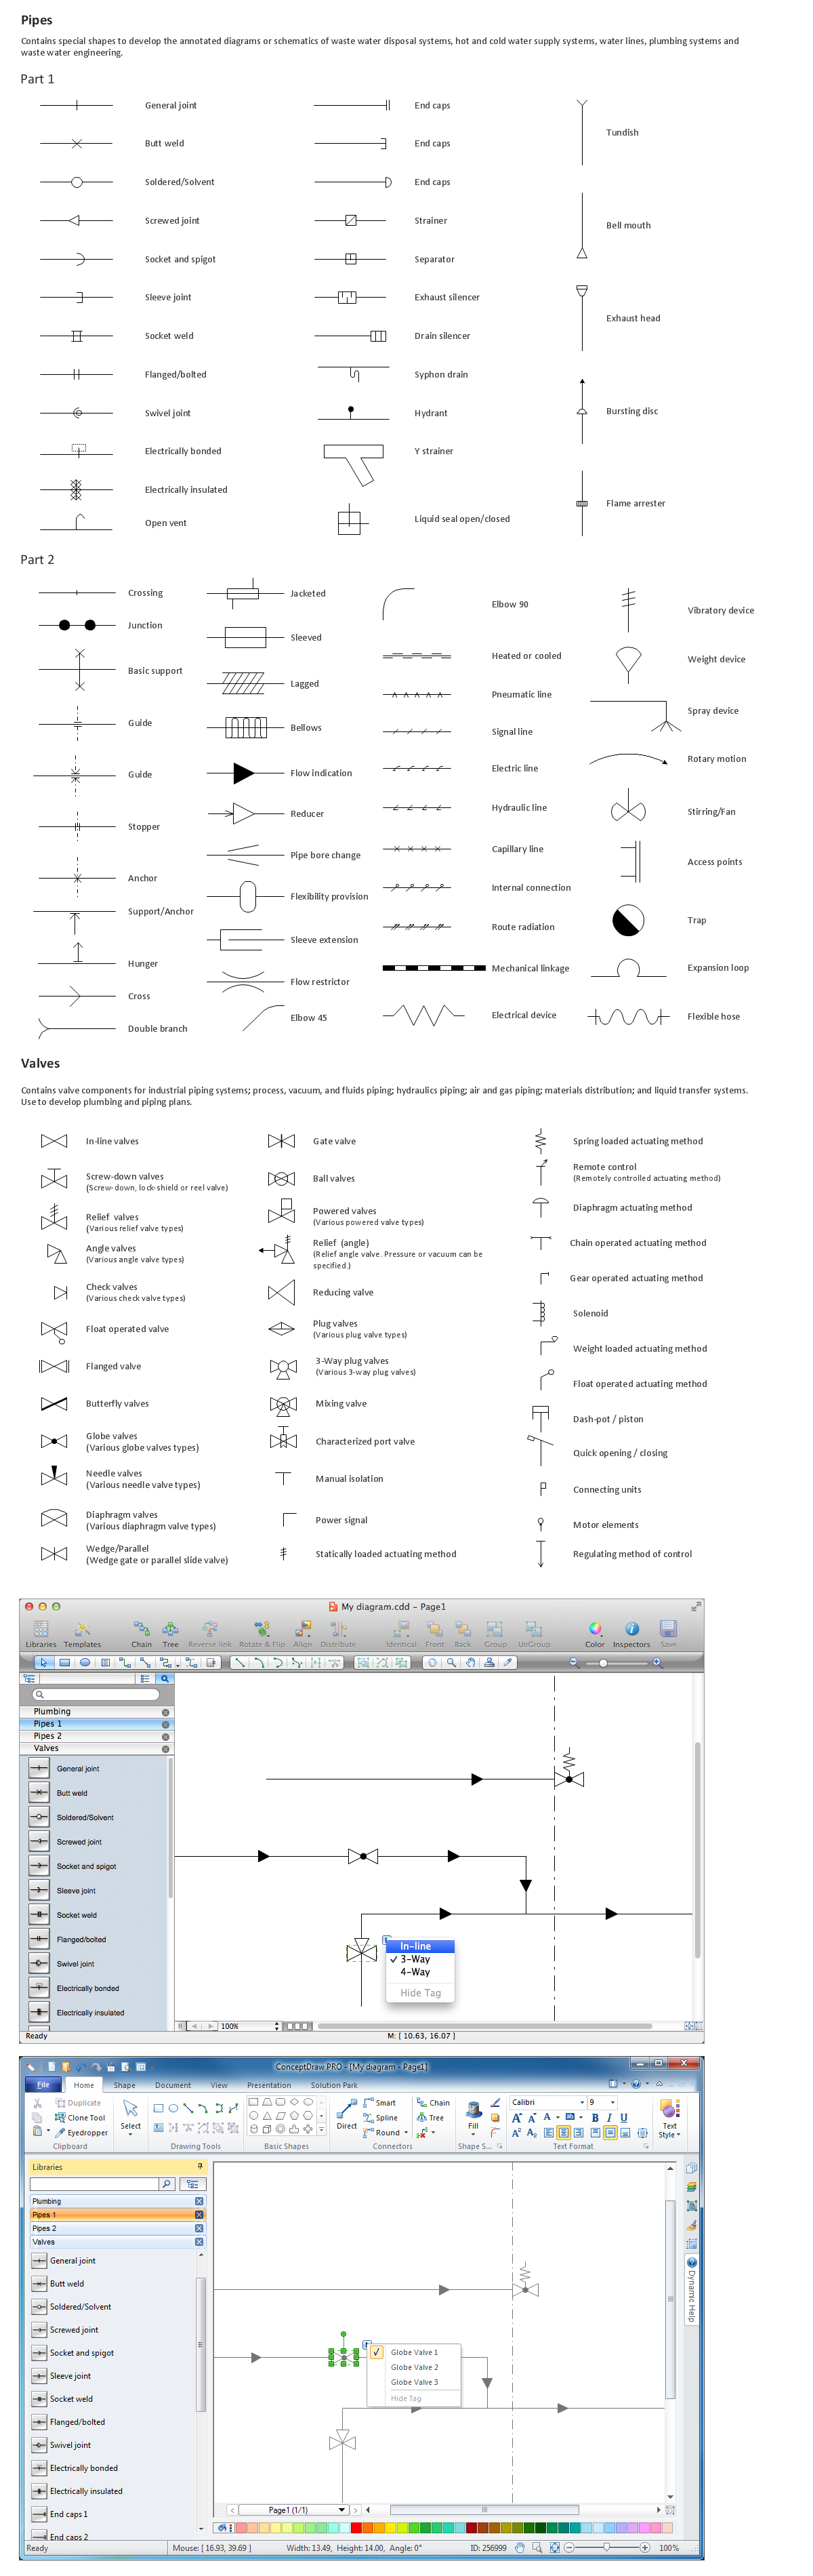
Picture: Building Drawing Software for Design Piping Plan
Related Solution:
In ConceptDraw DIAGRAM it really is sp simple to draw even the most complex cross-functional flowcharts. Use the RapidDraw technology and Cross-Functional libraries in ConceptDraw DIAGRAM for the best results.
Picture: How to Simplify Flow Charting — Cross-functional Flowchart
Related Solution:
This sample illustrates the Floor Plan of mini hotel representing the arrangement of hotel rooms, dining hall, and other premises all of them furnished. This is necessary for construction a hotel and is helpful for booking rooms for accommodation.
This sample was created in ConceptDraw DIAGRAM diagramming and vector drawing software using the Floor Plans Solution from the Building Plans area of ConceptDraw Solution Park.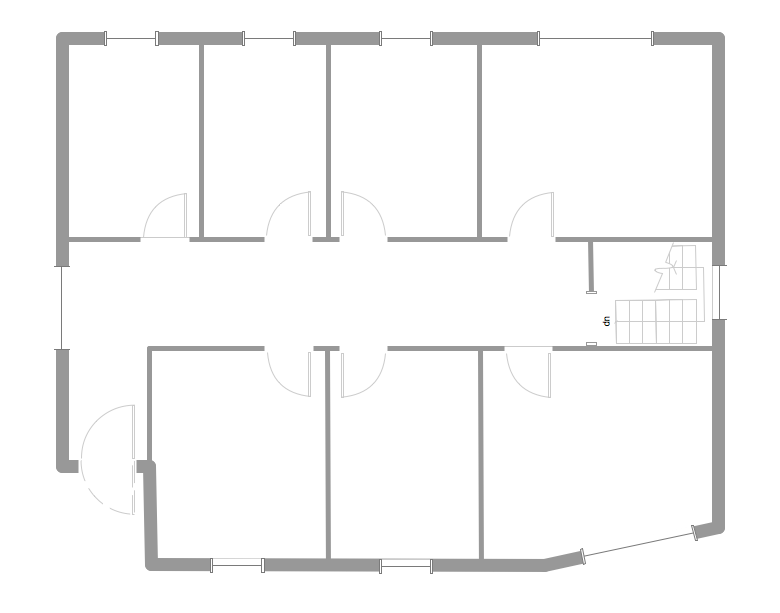
Picture: Hotel Floorplan
Related Solution:
The Affinity Diagram shows the structure of large, complex factors that have an influence on a problem, and then divides them up into a smaller and simpler structure. The Affinity Diagram does not show a causal relationship between the factors. This diagram is designed to prepare the data for further analysis of the cause-effect relationships.
Picture: Affinity Diagram
Related Solution:
UML Object Diagram shows the structure of a modeled system at a specific time.
ConceptDraw Rapid UML solution delivers libraries contain pre-designed objects fit UML notation, and ready to draw professional UML Object Diagram.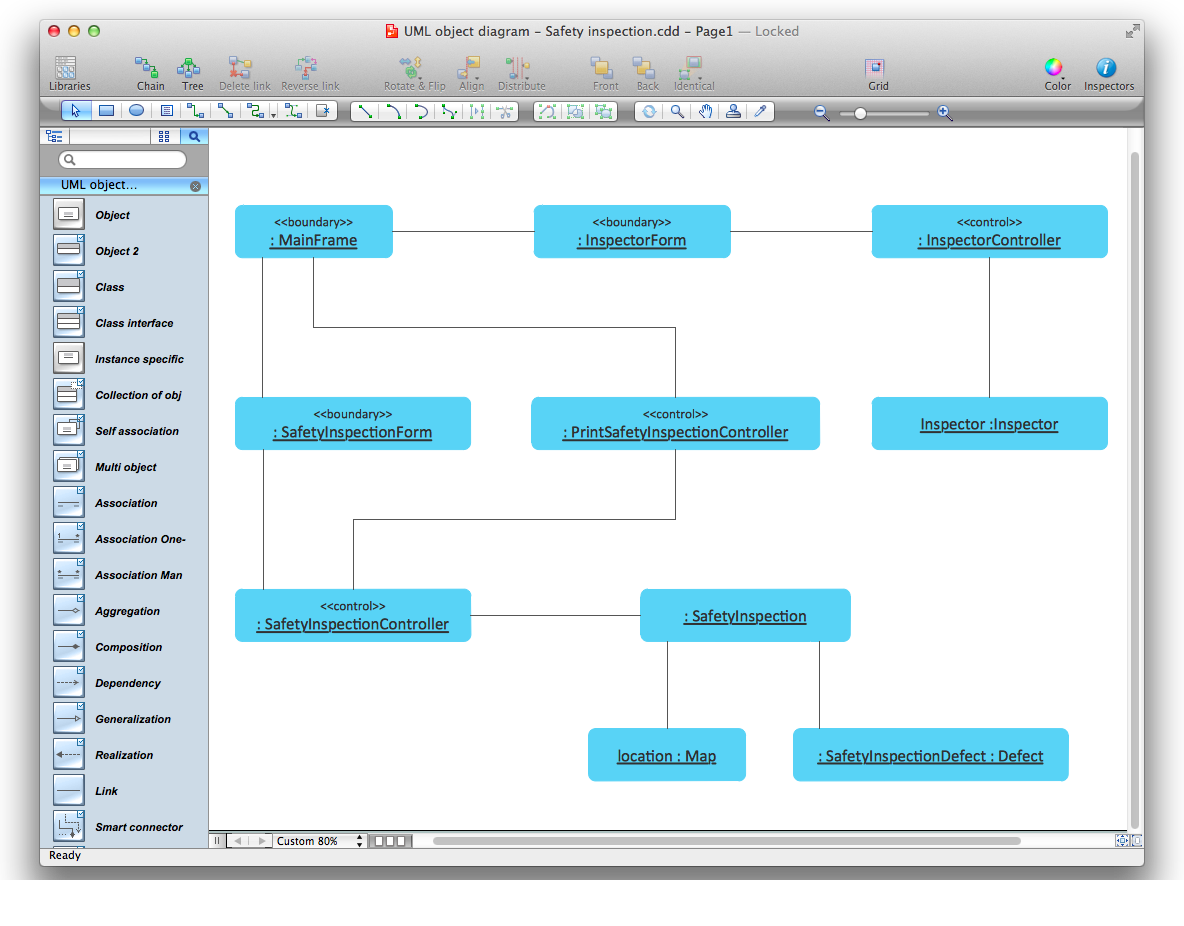
Picture: Diagramming Software for Design UML Object Diagrams
Related Solution:
HR Flowcharts solution extends the drawing capabilities of ConceptDraw DIAGRAM's users and assists in designing professional-looking and informative HR department charts in minutes.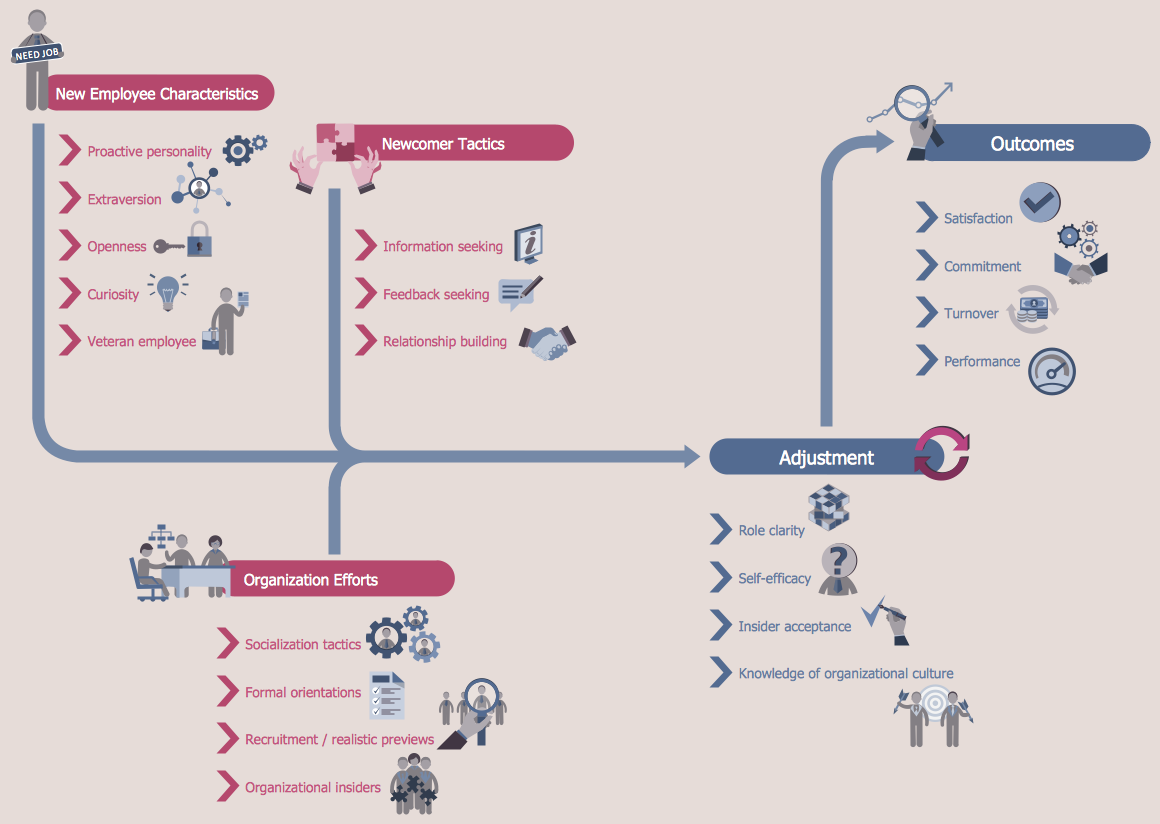
Picture: HR Department Chart
Related Solution:
ConceptDraw DIAGRAM diagramming and vector drawing software supplied with Sales Dashboard solution provides the full set of useful tools which make it the best for producing the live KPI Dashboard of any complexity.
Picture: KPI Dashboard
Related Solution:
It is impossible to imagine the biology science without drawings. Drawings are very convenient way to explain the different biological knowledge and processes. If you dream to design any biology drawing quick and easy – the ConceptDraw DIAGRAM software is exactly what you need.
ConceptDraw DIAGRAM diagramming and vector drawing software extended with Biology solution from the Science and Education area offers the useful tools for easy biology drawing.
Picture: Biology Drawing
Related Solution:
