
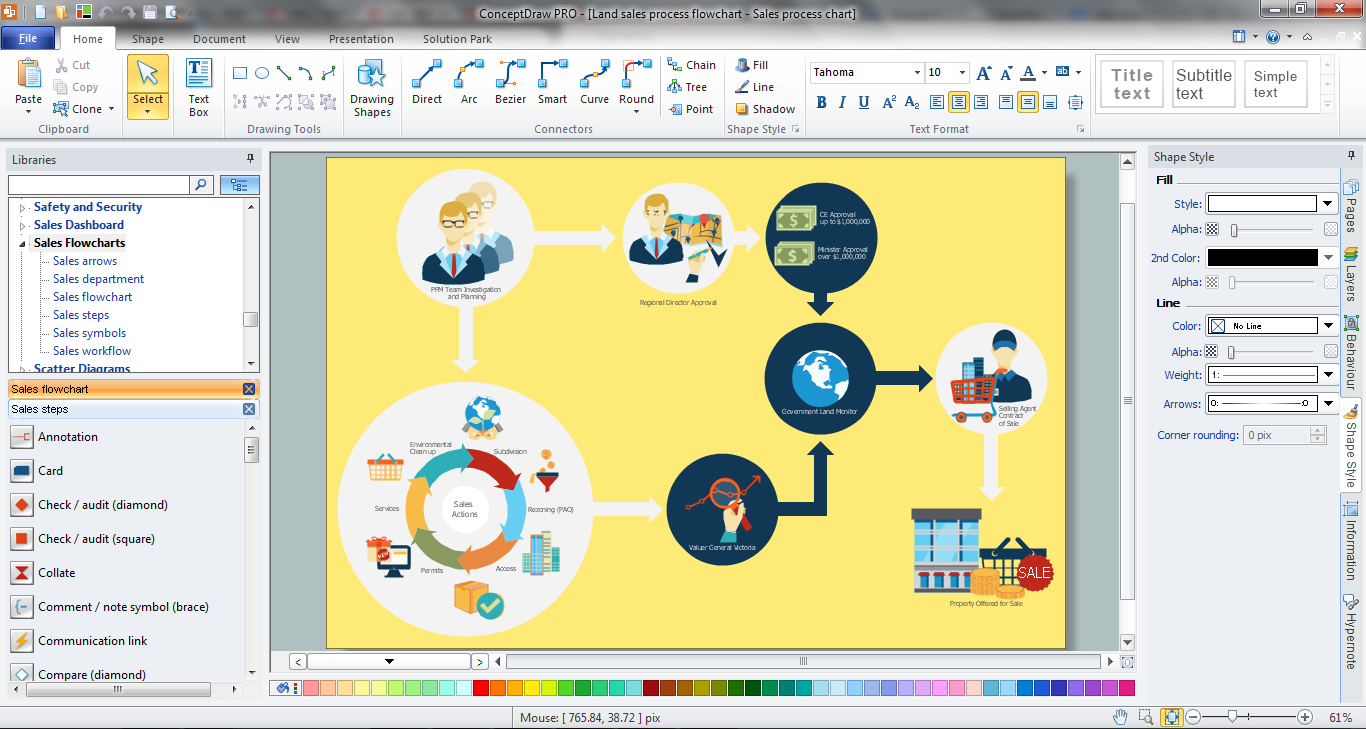
Example 2. Sales Process Steps
This sample was created in ConceptDraw DIAGRAM using the Sales Flowcharts Solution for ConceptDraw Solution Park and visually illustrates the land sales process steps. An experienced user spent 15 minutes creating this sample in ConceptDraw DIAGRAM
Use the Sales Flowcharts Solution for ConceptDraw DIAGRAM software to create effectively your own Sales Process Flowchart and easily represent all details and steps on it.
All source documents are vector graphic documents. They are available for reviewing, modifying, or converting to a variety of formats (PDF file, MS PowerPoint, MS Visio, and many other graphic formats) from the ConceptDraw STORE. The Sales Flowcharts Solution is available for all ConceptDraw DIAGRAM
TEN RELATED HOW TO's:
The ConceptDraw vector stencils library Cisco LAN contains symbols for drawing the computer local area network diagrams.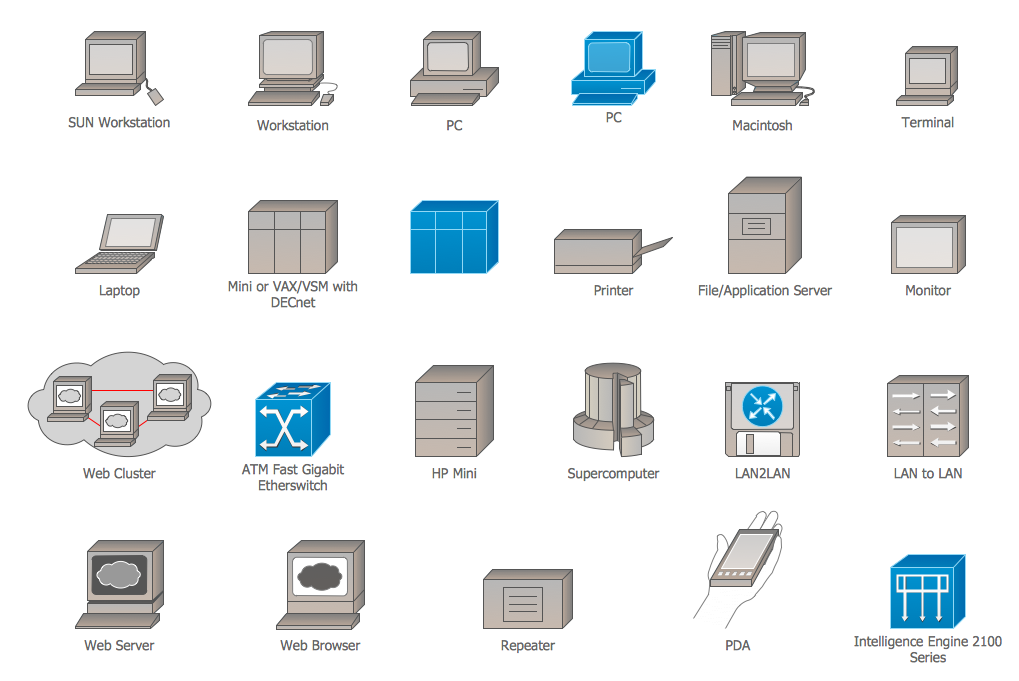
Picture: Cisco LAN. Cisco icons, shapes, stencils and symbols
Related Solution:
The Social Media Response solution provides the means to respond to social media mentions quickly and professionally. This tool keeps the entire team on the same page allowing you to realize your social media strategy, improve the quality of your answers, and minimize the time it takes to respond.
Picture: Manage Social Media Response Plan DFD
Related Solution:
This sample was created in ConceptDraw DIAGRAM diagramming and vector drawing software using the Flowcharts solution from the Diagrams area of ConceptDraw Solution Park.
This sample shows the Flowchart of the Subprime Mortgage Crisis. This Flowchart describes the decline in housing prices when the housing bubble burst and what it caused on the housing and financial markets. You can also see the Government and Industry responses in this crisis situation.
Picture: Flowchart on Bank. Flowchart Examples
Related Solution:
Activity on Node Network Diagramming Tool - Activity Network and Project Evaluation and Review Technique, or PERT, charts are a way of documenting and analyzing the tasks in a project.
This sample shows the Activity on node network diagramming method. It was created in ConceptDraw DIAGRAM diagramming and vector drawing software using the Seven Management and Planning Tools solution from the Management area of ConceptDraw Solution Park.
Picture: Activity on Node Network Diagramming Tool
Related Solution:
The ConceptDraw DIAGRAM Planogram Software and Retail Plan Software offers powerful tools of Enterprise Architecture Diagrams Solution for visualization the market analysis and easy making successful Retail Plans and Planograms with useful detailed recommendations about placing products and optimization the shelf space.
Picture: Planogram Software and Retail Plan Software
Related Solution:
Critical information from your mindmaps can be accessed from almost any device using ConceptDraw MINDMAP and Evernote.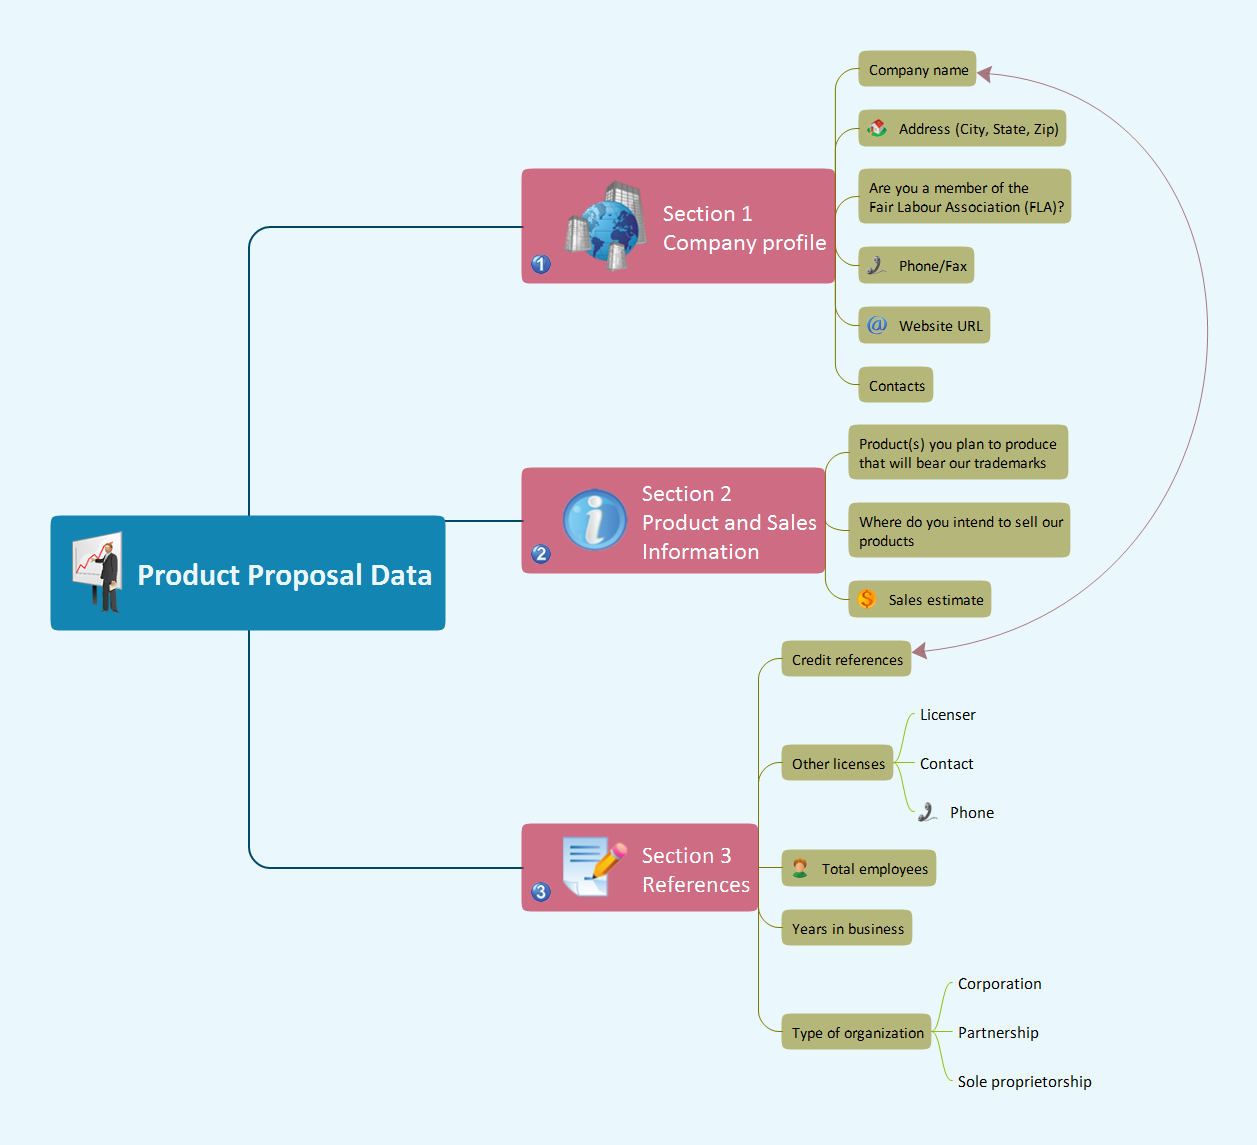
Picture: Gather Requirements Exchanging Mind Maps with Evernote
Related Solution:
Vietnam, officially the Socialist Republic of Vietnam, is the easternmost country on the Indochina Peninsula in Southeast Asia.
The vector stencils library Vietnam contains contours for ConceptDraw DIAGRAM diagramming and vector drawing software. This library is contained in the Continent Maps solution from Maps area of ConceptDraw Solution Park.
Picture: Geo Map — Asia — Vietnam
Related Solution:
Accounting flowchart is a pictorial way to represent the flow of data in an organization and the flow of transactions process in a specific area of its accounting or financial department. Accounting Flowcharts solution contains the full set of standardized accounting flowchart symbols which will help you design in minutes various types of Accounting Flowcharts including such popular diagrams which represent the whole accounting process: Purchasing Flowchart, Receiving Flowchart, Voucher Payable Flowchart, Treasurer Flowchart, Payment Flowchart.
Picture: Accounting Flowchart Purchasing Receiving Payable and Payment
Related Solution:
What is Scrum? Scrum is the famous agile software development methodology which depicts an iterative and incremental approach for the work on the complex projects. Use ConceptDraw DIAGRAM diagramming and vector drawing software extended with SCRUM Workflow solution to draw various types of professional-looking Scrum Charts, Scrum Workflow Diagrams, Scrum Mind Maps, Scrum boards and attractive Scrum Infographics.
Picture: Scrum
Related Solution:
Apply Electrical Engineering solution for ConceptDraw DIAGRAM and numerous electric circuit symbols to 🔸 develop and illustrate all types of electrical circuits as ✔️ electrical circuit diagrams, ✔️ electrical schematics, ✔️ electrical diagram drawings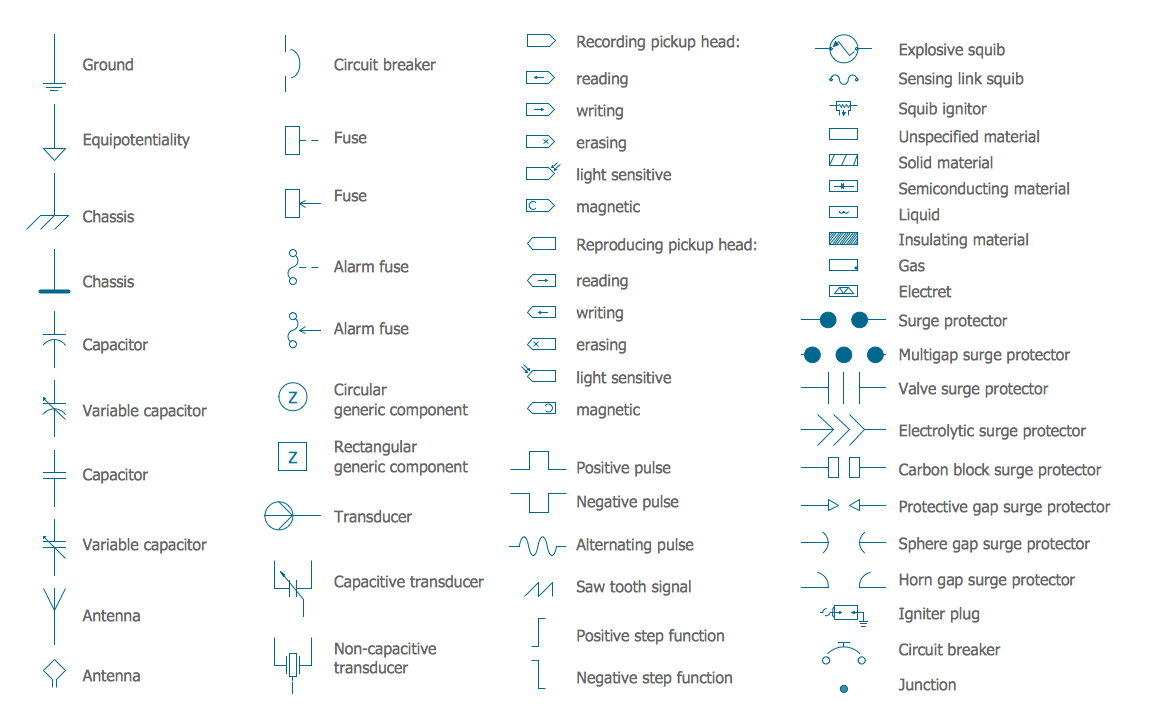
Picture: Electrical Circuits — Electrical Symbols
Related Solution:
 Sales Arrows Library
 Sales Department Library


