Social Media Response Management Action Maps - software tool
This tool keeps the entire team on the same page allowing you to realize your social media strategy, improve the quality of your answers, and minimize the time it takes to respond. ConceptDraw DIAGRAM software provides tools to develop a response flowchart that can be connected with Action Mind Maps. Visual navigation through the stages of a response process helps you locate specific actions to be taken via Action Mind Maps.
Sample 1. Social Media Response Chart
Feedback Action MindMap
Action Maps helps the teams be on the same page and follow the social media response plan.
See also Samples:
TEN RELATED HOW TO's:
ConceptDraw MINDMAP is a powerful business and personal productivity software application that provides visual organization and access to information for individuals and organizations.
Picture: ConceptDraw MINDMAP :Brainstorming, Mind Mapping for macOS and Windows
Event-Driven Process chain Diagrams for improvement throughout an organisation. Best software for Process Flow Diagram. The Event-driven Process Chain (EPC) Diagrams allows managers to plan processes and resources.
Picture: Business process Flow Chart — Event-Driven Process chain (EPC) diagrams
Related Solution:
Visual navigation through the stages of a response process helps you locate specific actions to be taken via Action Mind Maps. Use ConceptDraw DIAGRAM and ConceptDraw MINDMAP for organize the process of response for interactions occurring in social media.
Picture: Create Response Charts
Related Solution:
It is an innovative combination of interactive flow charts and action mind maps to help you boost your social media success.
Picture: Social Media Response Management Action Maps - software tool
Related Solution:
ConceptDraw DIAGRAM diagramming and vector drawing software enhanced with powerful HR Flowcharts Solution perfectly suits for Human Resource Management.
Picture: Human Resource Management
Related Solution:
Interactive tool helps you find the appropriate response to social media mentions quickly.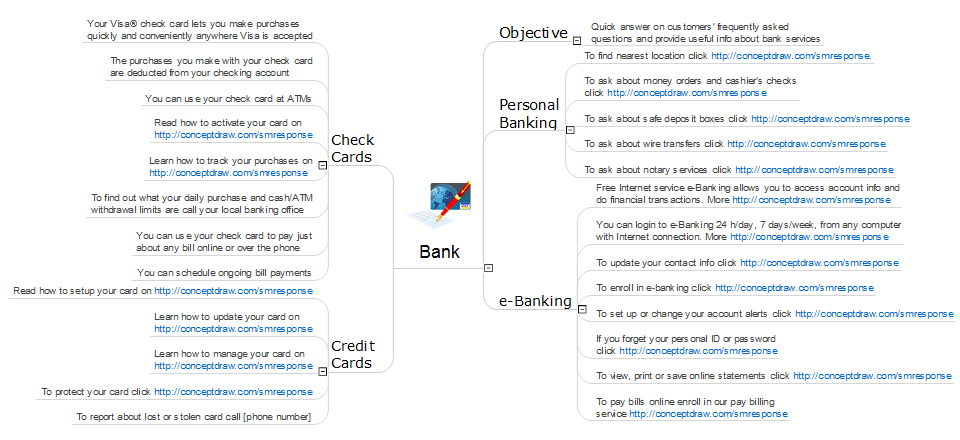
Picture: What Is an Action Mind Map
Related Solution:
ConceptDraw MINDMAP has a new challenges in leading or taking instruction during remote mind map presentation and available to deliver lessons to a remote group via a Skype conference call. ConceptDraw DIAGRAM provides tools to develop a response flowchart that can be connected with Action Mind Maps.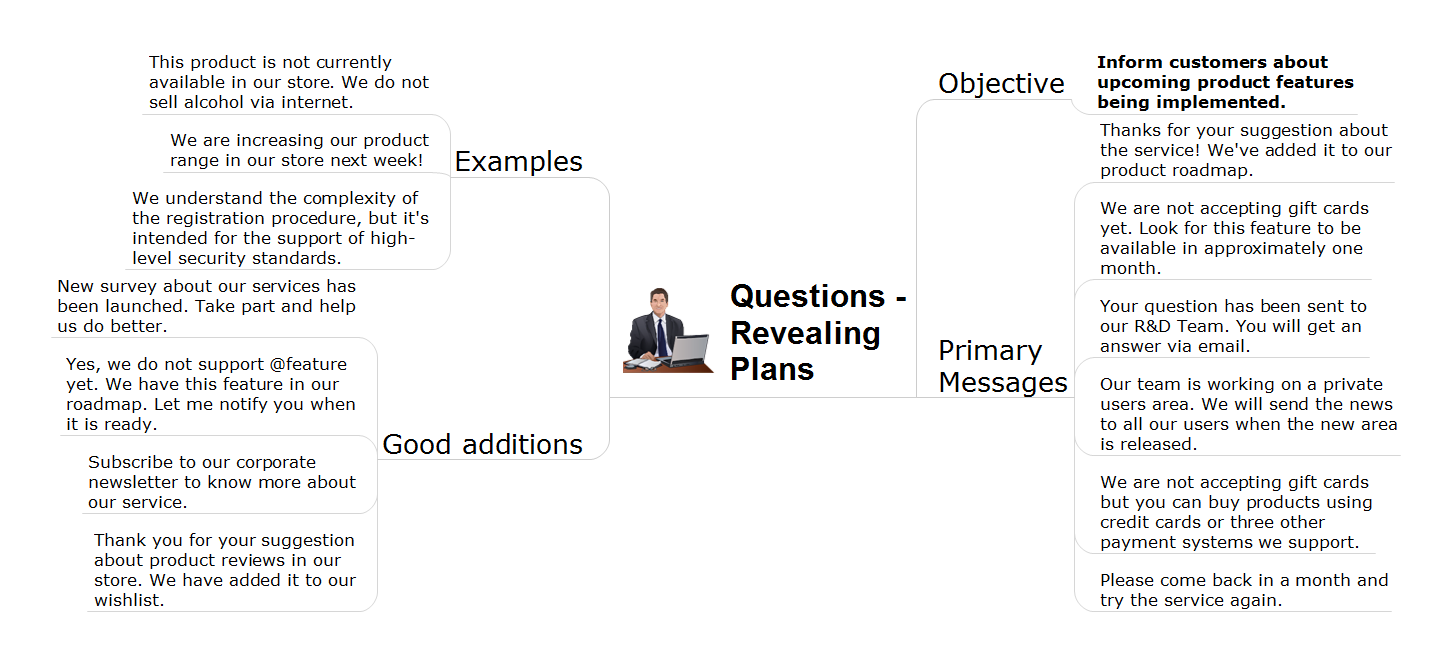
Picture: Provide Team Training
Related Solution:
You need design the Marketing Organization Chart and look for effective software? Now it's incredibly easy to do this in ConceptDraw DIAGRAM which was supplied with Marketing Diagrams Solution from the Marketing Area of ConceptDraw Solution Park.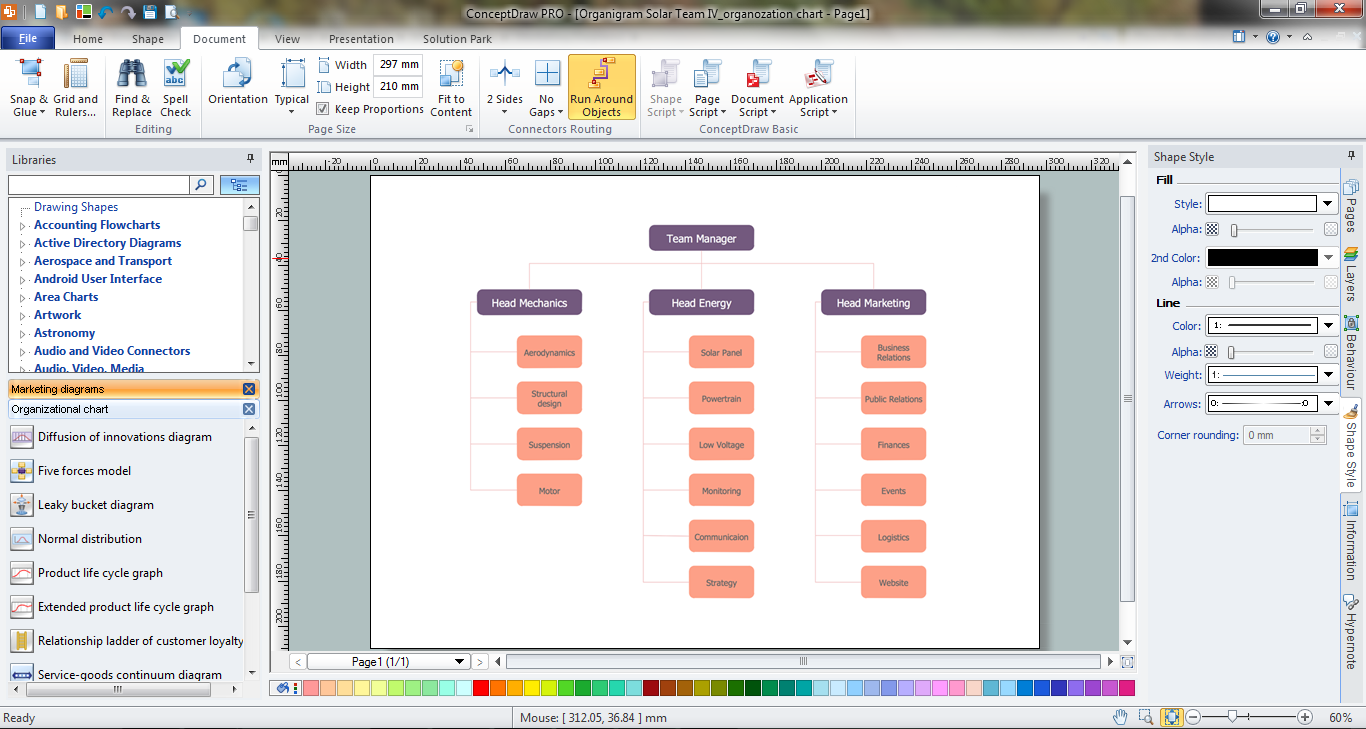
Picture: Marketing Organization Chart
Related Solution:
The role of ConceptDraw MINDMAP is to organize and plan idea development and communicate between process participants. Mind maps are convenient to prepare presentations for team and management and send task lists and related information.
Picture: Product Overview
ConceptDraw is your tool for driving social integration and managing change across and streamline social media processes of your organisation.This tool keeps the entire team on the same page allowing you to realize your social media strategy, improve the quality of your answers, and minimize the time it takes to respond.
Picture: Social Media Response Management DFD Charts - software tools
Related Solution:
ConceptDraw
DIAGRAM 18