Business Process Mapping — How to Map a Work Process
ConceptDraw DIAGRAM is a world-class diagramming platform that lets you display, communicate, and present dynamically. It′s powerful enough to draw everything from basic flowcharts to complex engineering schematics.
ConceptDraw DIAGRAM is a powerful tool that helps you create a process map diagram quickly and easily. Fine-tuning the objects in ConceptDraw DIAGRAM allows you to create a really professional finished article.
 Business process swim lane diagram — Hiring process example
NINE RELATED HOW TO's:
Swimlanes are a visual mechanism of organizing and categorizing activities, in BPMN consist of two types: Pool, Lane. Use ConceptDraw Swimlanes library with 20 objects from BPMN.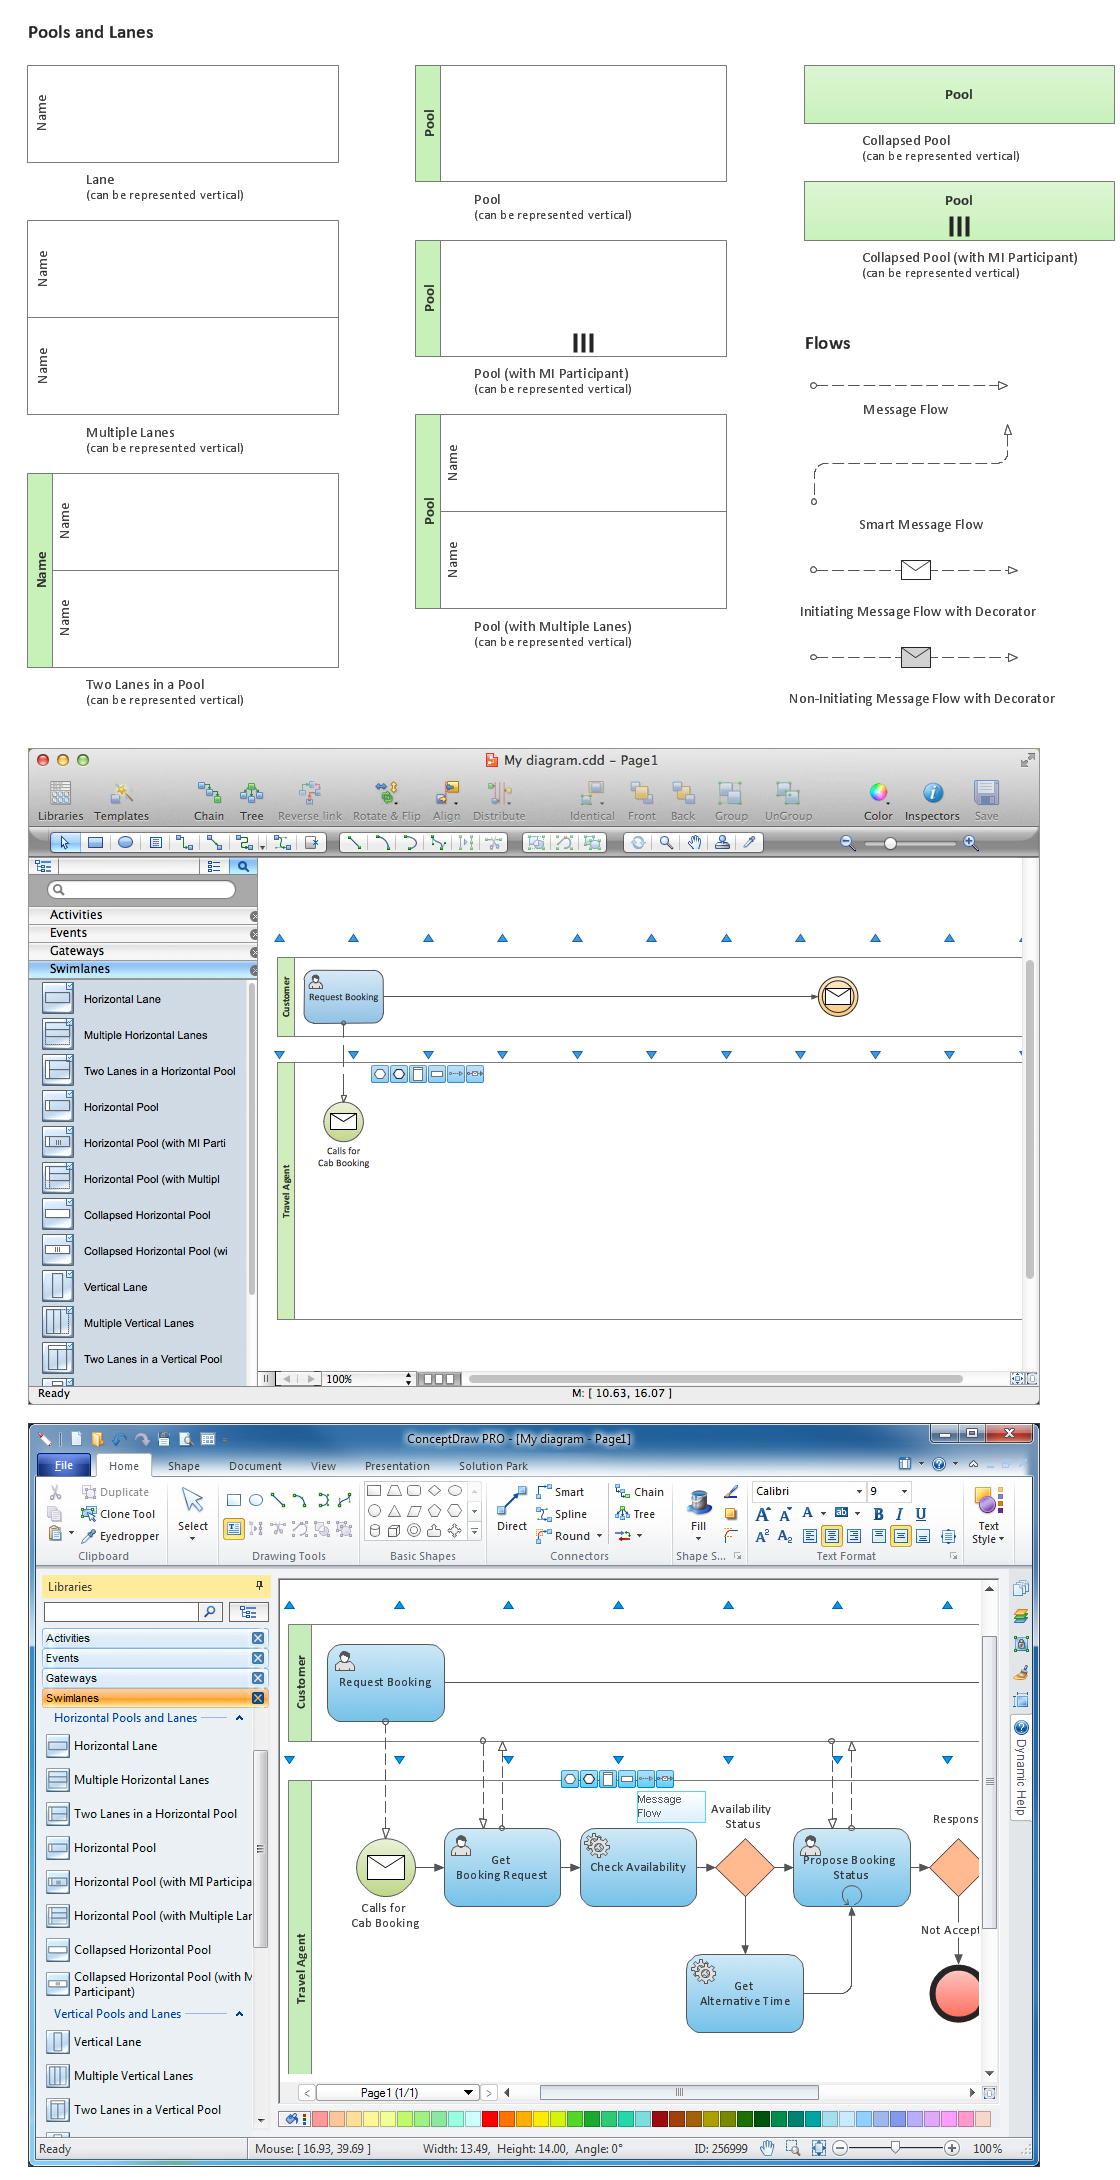
Picture: Diagramming Software for Design Business Process Diagrams
Event-Driven Process chain Diagrams for improvement throughout an organisation. Best software for Process Flow Diagram. The Event-driven Process Chain (EPC) Diagrams allows managers to plan processes and resources.
Picture: Business process Flow Chart — Event-Driven Process chain (EPC) diagrams
Related Solution:
The vector stencils library UML Use Case contains specific symbols of the UML notation such as actors, actions, associations and relationships for the ConceptDraw DIAGRAM diagramming and vector drawing software.
Picture: Jacobson Use Cases Diagram
Related Solution:
Use ConceptDraw DIAGRAM software with Flowcharts Solution to create Process Flow Charts, Flow Chart Process Maps, and High-Level Process Flow Charts to illustrate ✔️ high-level processes in industrial, chemical, and process engineering, ✔️ major plant processes, ✔️ minor details
Picture: Process Flow Chart
Related Solution:
UML Component Diagram illustrates show components are wired together to larger components and software systems that shows the structure of arbitrarily complex systems.
Rapid UML Solution for ConceptDraw DIAGRAM contains 13 vector stencils libraries with 393 interactive shapes that you can use to design your UML diagrams.
To design a Component Diagram use the UML Component Diagram library.
UML Component Diagram library contains 36 shapes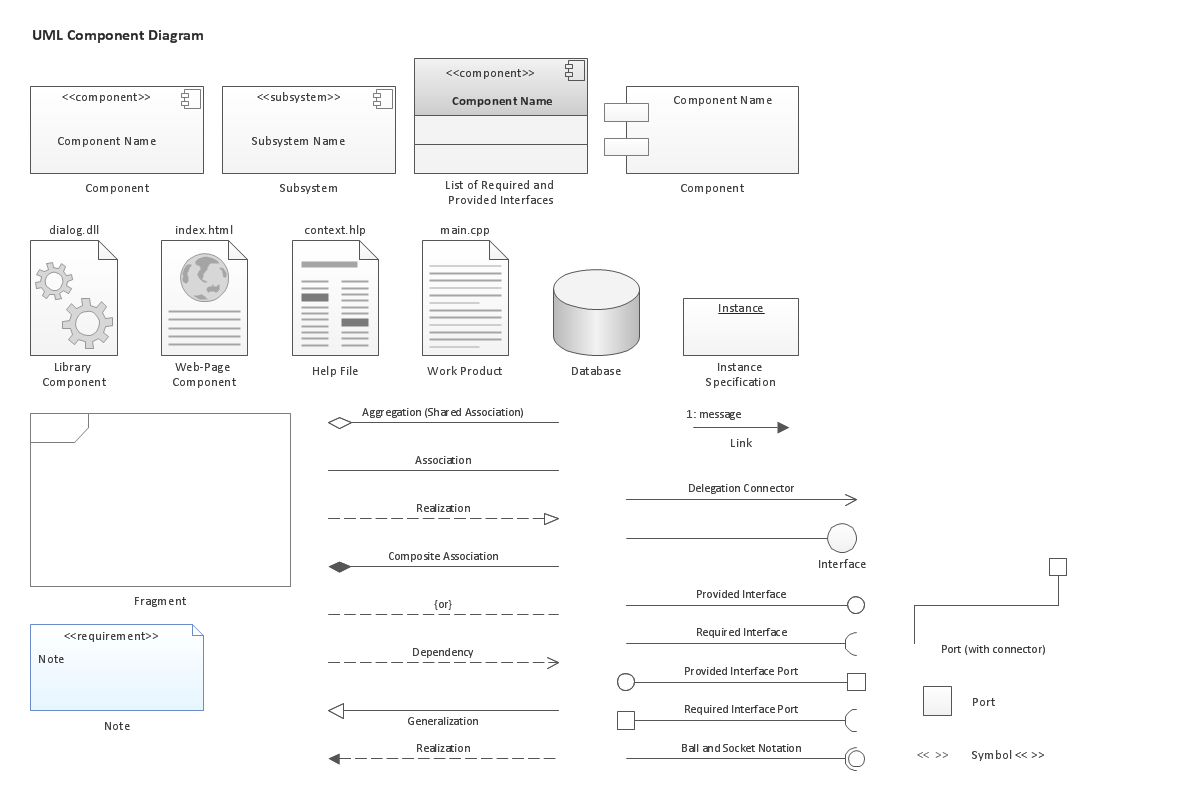
Picture: UML Component Diagram. Design Elements
Related Solution:
Also included are standardized hr flowchart symbols, meaning your diagrams will be relevant and understood by all business associates.
Picture: HR Flowchart Symbols
Related Solution:
When searching for a diagramming tool, we look for a powerful and reliable software that would be easy to use. To mention one, ConceptDraw DIAGRAM has all the necessary features to create cross-functional flowcharts (Swim Lanes) quick and effortlessly. You can draw swim lane diagrams in both vertical and horizontal ways.
This cross-functional flowchart displays a payroll process. It explains to each participant his role in the process depending on the category, represented with swimlanes. Using this flowchart, every employee can easily find out what he can expect in terms of salary. Generally a cross-functional diagram enables one to take a look at processes with a wider scope and with more precision than simple flowchart. Business process capturing using cross-functional flowcharts can be useful for stakeholders and managers to define clearly the staff's roles and responsibilities.
Picture: Cross-Functional Flowchart (Swim Lanes)
Related Solution:
Learn what a workflow diagram is, how it works, when to use it, and how to create one. See examples, handoffs, approval flows, and workflow diagram best practices.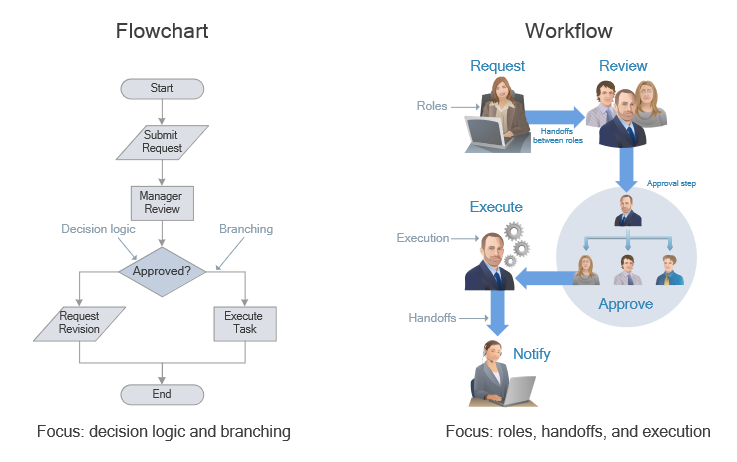
Picture: Workflow Diagram: Definition, Examples, and How to Create
Related Solution:
Create with our data flow diagram software perfect data flow diagrams. Download data flow diagram software for FREE. Use hundreds of data flow diagram examples.
Picture: Collaboration in a Project Team
ConceptDraw
DIAGRAM 18