Workflow Diagram: Definition, Examples, and How to Create
Quick answer: A workflow diagram is a visual representation of how work moves through a process—what happens next, who handles each step, and where handoffs or revision loops occur.
In practice, a workflow diagram makes three things visible at once: the sequence of steps, the owner of each step, and the points where work is handed off, approved, or sent back for revision.
A workflow diagram is a type of process diagram used in process modeling and workflow management to visualize how tasks, decisions, and responsibilities move across a workflow.
If you are new to process visualization, start with our flowchart guide, which explains core concepts, symbols, and diagram types.
It is a core tool in process mapping and workflow management, helping teams visualize workflow processes, standardize execution, and improve operational efficiency.

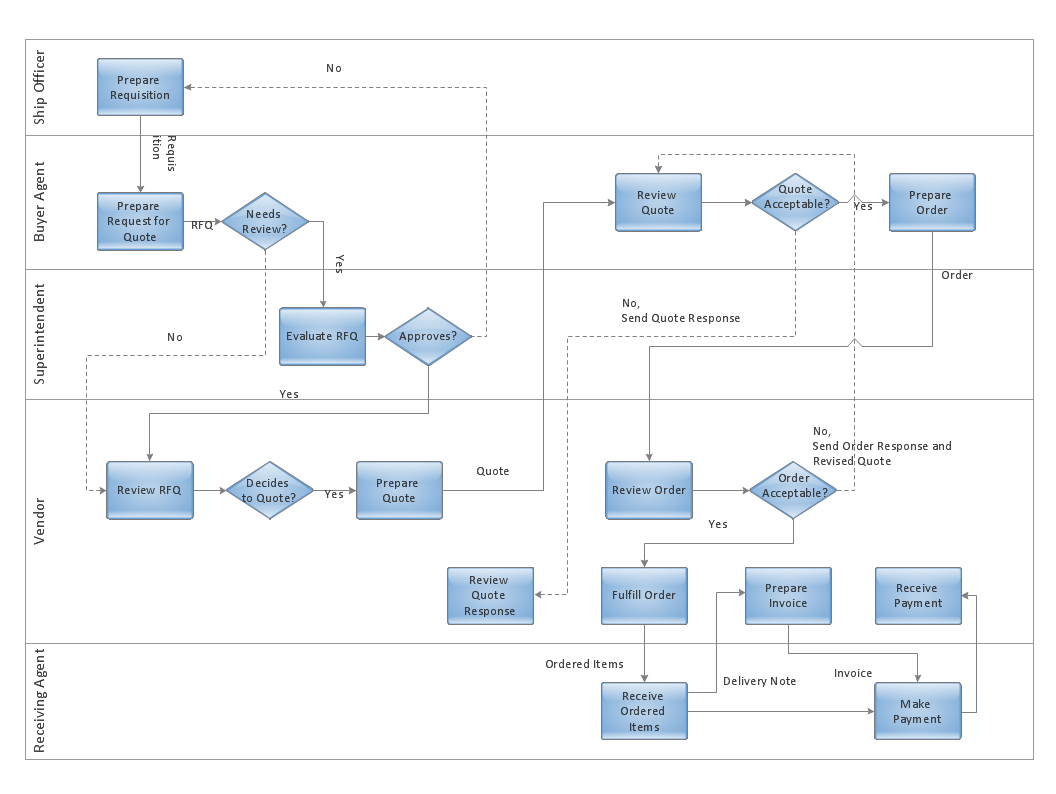
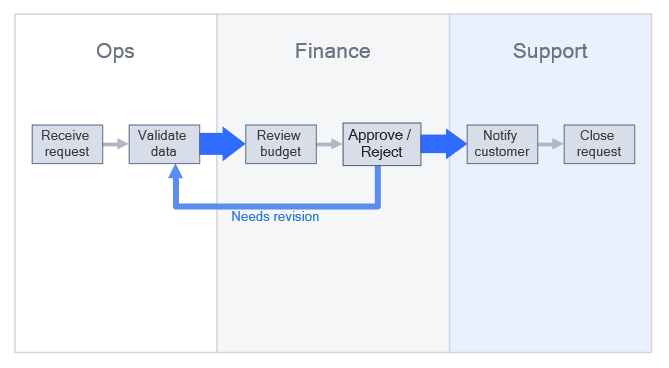
Workflow diagram showing how work moves between roles with explicit handoffs, approval decisions, and revision loops.
What this diagram shows: how work moves across roles, where responsibility changes (handoffs), and how approvals and revision loops affect execution.
Jump to: Create your own workflow diagram →
What Is a Workflow Diagram?
Definition
A workflow diagram is a visual map of how work moves from a trigger to an outcome in a workflow process. It outlines the main steps in order and makes responsibility changes (handoffs), approvals, and revision routes visible so the work can be executed the same way every time.
In process modeling, a workflow diagram represents how a process is executed across roles, systems, and decision points, combining sequence, responsibility, and operational logic within broader process modeling practices.
Why workflow diagrams matter
Workflow diagrams help organizations standardize execution, reduce ambiguity, and improve coordination across teams. By making ownership, handoffs, and approval logic visible, they support faster decision-making, fewer errors, and more predictable outcomes in operational processes.
Quick selection guide
- Use a workflow when ownership, handoffs, and approvals matter.
- Use a flowchart when decision logic and branching are the focus.
- Use BPMN when you need formalized process notation.
- Use a process flow diagram when mapping technical or production flows.
What it typically includes
- Steps (actions) in a clear order
- Responsibility (role, team, or department) for each step
- Handoffs between owners
- Approval routes and return paths for revisions
- Inputs and outputs where they matter
How a workflow diagram works
A workflow diagram starts with a trigger, moves through a sequence of actions, shows where responsibility changes hands, and makes approval or revision paths explicit until the process reaches a defined outcome.
To better understand how workflow diagrams differ from other process visualization methods, it helps to compare them with flowcharts.
Workflow vs Flowchart
This comparison clarifies the difference between a workflow diagram and a flowchart, focusing on ownership, handoffs, and execution flow versus decision logic and branching.
Choose a workflow when you need to show who does what, handoffs, approvals, and exception paths.
Choose a flowchart when you need to show logic and decisions without ownership detail.
If you need formal compliance notation, consider BPMN.
Use a workflow diagram for execution clarity. Use a flowchart for decision logic. Use BPMN when formal notation, process governance, or strict operational modeling is required.
For more formal process modeling, BPMN provides standardized notation for complex workflows, while UML activity diagrams are commonly used in software and system design to represent execution logic and system behavior.
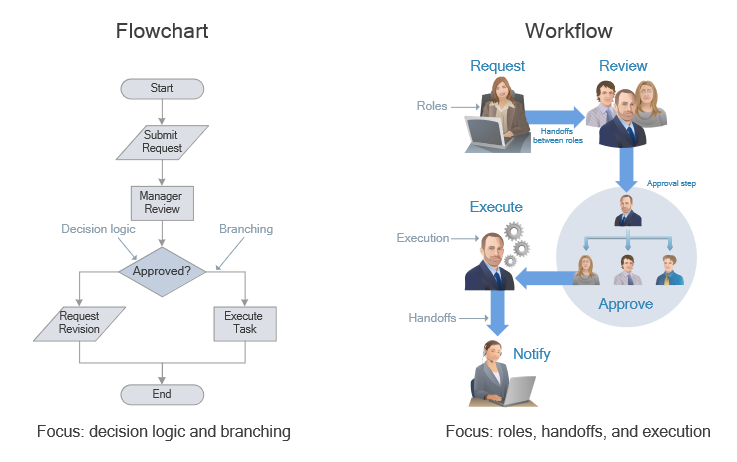
Side-by-side comparison showing the difference between decision-based flowcharts and execution-focused workflows.
Structure of a Workflow Diagram
The structure of a workflow diagram defines how process steps, roles, and interactions are organized to ensure clarity, consistency, and execution accuracy. This structure supports effective workflow mapping and process standardization.
- Steps: actions performed in sequence
- Roles: who is responsible for each step
- Handoffs: where work moves between roles
- Approvals: validation points in the workflow
- Inputs/outputs: what enters and leaves each step
Steps and labels
Label each step as an action (verb-first). Keep labels short, specific, and consistent.
Workflow diagrams use standardized diagram elements similar to those described in the flowchart symbols, adapted to represent responsibility and execution flow.
Labeling rules
- Start each step with a verb (e.g., "Review request").
- Keep one action per step.
- Avoid department names as standalone steps.
- Label return arrows clearly ("Needs revision").
- Good: “Review request”, “Approve budget”, “Notify customer”
- Avoid: “Management”, “Finance”, “Misc”
Responsibility and handoffs
Most delays happen at handoffs. Make transfers explicit with arrows that show where work changes owners. If you don’t use swimlanes, add a small owner tag to each step (for example, “Ops”, “Finance”, “Support”).
Handoffs checklist
- Where ownership changes
- Where approvals happen
- Where rework loops start
Approvals and return paths (without decision symbols)
If your library does not include formal decision shapes, show approvals by routing the flow: one arrow continues forward (approved route) and one arrow returns to an earlier step (revision route). Label both routes (“Approved” / “Needs revision”).
Inputs and outputs
Where it matters, show what enters a step (request, document, data) and what comes out (approved item, completed work, notification). This reduces hidden dependencies and makes the workflow easier to maintain.
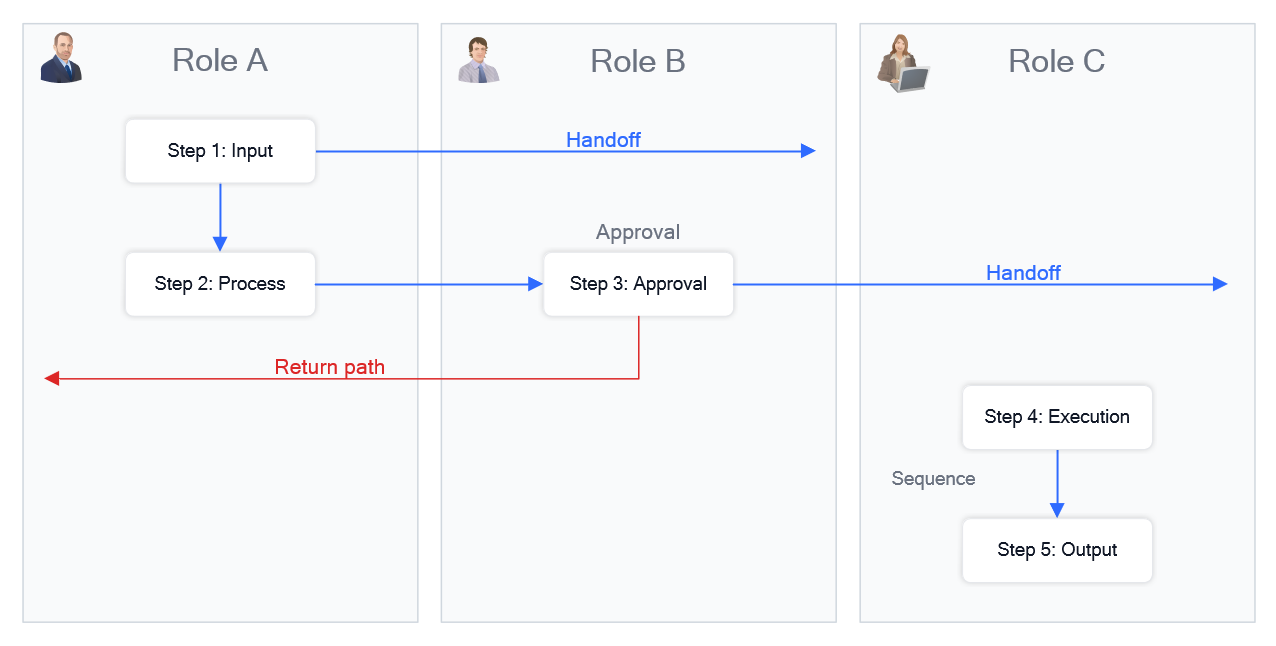
Structure visual explaining ownership zones, handoffs, and workflow routing logic.
Next: see how this structure works in a real-world workflow example step by step.
Workflow Diagram Example
These workflow diagram examples demonstrate how processes, responsibilities, and data flow are visualized in real operational scenarios.
Taxi service workflow
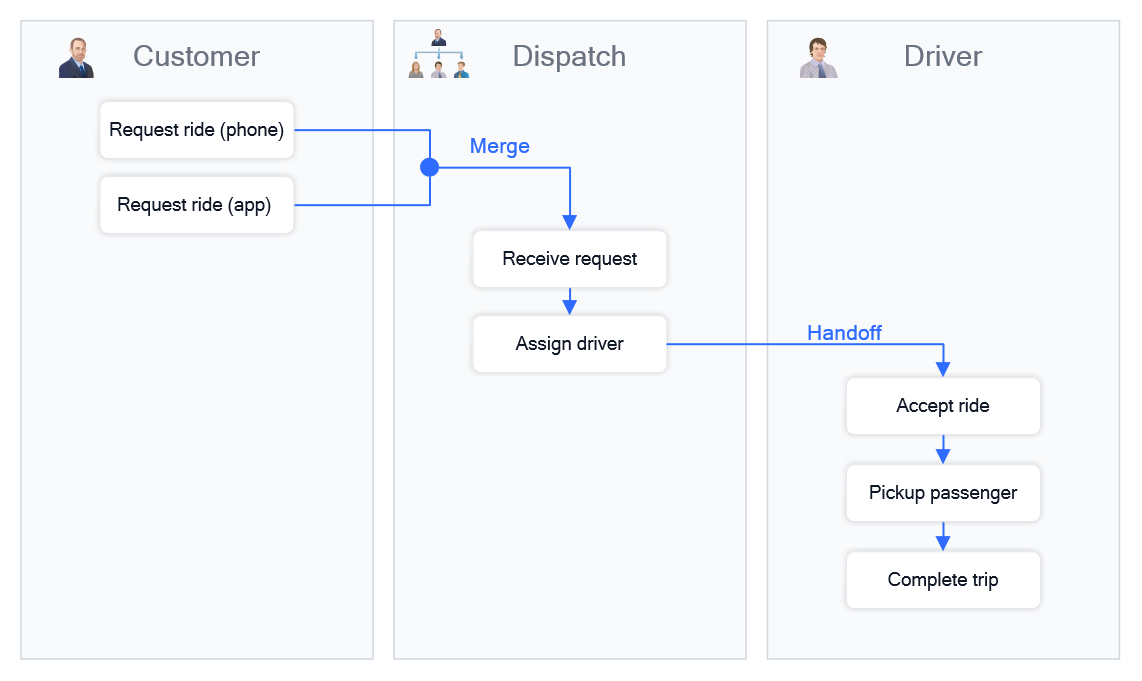
Operational workflow example emphasizing handoffs between dispatch and service execution.
This example shows a service-oriented workflow with clear handoffs between dispatch, driver assignment, and customer interaction steps.
What to notice: Operational handoffs between dispatch and service execution, including routing clarity.
Why this works: The workflow clearly separates responsibilities, maintains a consistent flow direction, and makes handoffs and dependencies visible.
Document approval workflow
This example shows a typical approval workflow where a document moves from creation to review and final approval, including revision loops when changes are required.
What to notice: Clear approval routing and revision paths.
Why this works: The workflow highlights validation points and prevents ambiguity in decision-making.
Benefits
Teams use workflow diagrams to reduce ambiguity, expose delays at handoffs, and make repeatable work easier to manage, improve, and standardize.
- Clearer execution: reduces ambiguity and improves onboarding.
- Faster improvement: exposes handoffs, delays, and rework loops.
- Automation readiness: supports conversion into rules and measurable processes.
- Supports workflow automation: helps translate processes into automated systems and rules.
When to Use a Workflow Diagram (Use Cases)
Workflow diagrams are used when process execution depends on clear ownership, coordination between roles, and visibility of handoffs and approvals. They are widely used in workflow management and process optimization.
Choose a workflow when
- You need to show who does what across roles or departments.
- Handoffs, approvals, and exception paths affect speed or quality.
- You want to reduce rework, clarify ownership, and make improvements measurable.
When not to use a workflow diagram
- You only need to explain abstract logic without ownership.
- The process is purely technical and better represented as a system diagram.
- Formal compliance modeling requires BPMN or another standardized notation.
- The process is highly algorithmic and better represented as a flowchart or decision tree.
Types
Workflow diagrams can be structured in different ways depending on process complexity, ownership distribution, and workflow mapping needs. The most common types reflect how responsibilities and handoffs are organized across a workflow process.
Linear
A straightforward sequence of steps. Best for stable work with few exceptions.
Cross-functional
Spans multiple roles or departments and includes frequent handoffs.
Approval
Built around review and sign-off. The key is making forward routes and revision return paths explicit.
Operational
Documents day-to-day execution in service operations, support, fulfillment, and internal processes.
Swimlane (cross-functional)
Also known as cross-functional workflow diagrams or swimlane workflows, these organize steps into lanes based on roles or departments, making ownership, handoffs, and approval flow explicit.
Swimlane workflow diagram illustrating responsibility zones, handoffs, and cross-functional process flow between teams.
How to Create a Workflow Diagram
Creating a workflow diagram involves mapping process steps, assigning responsibilities, and defining how work flows between roles, systems, and decision points and structuring workflow mapping for consistent execution.
Define scope and outcome
Write what triggers the process and what “done” means. Keep one diagram focused on one process.
List roles and handoffs
Identify who touches the work and where it changes hands.
Map the main route
Draft the primary flow from start to finish using action-based labels.
Add approvals and exceptions
Add revision routes, escalations, and rework loops. Label forward and return paths.
Validate with doers
Review the workflow with the people who execute it, then refine wording and sequence to match reality.
Start with a real scenario
Base the workflow on an actual process rather than an idealized version. Capture real delays, handoffs, and exceptions to ensure the diagram reflects how work is actually performed.
Attach performance metrics
A workflow becomes actionable when linked to measurable performance indicators.
Performance metrics to track
- Cycle time (total time from trigger to completion)
- Wait time (handoff delays between owners)
- Rework rate (percentage of revision returns)
- Approval lead time
- SLA compliance rate
Pick 1–2 primary metrics per workflow to avoid vanity tracking.
Workflow Diagram Use Cases
Workflow diagrams are used across industries to standardize processes, improve coordination, and support workflow management.
- Operations: standardizing internal processes and reducing delays.
- Customer support: managing request handling and escalation paths.
- Finance: approval workflows and compliance processes.
- IT and product teams: documenting system-related workflows and handoffs.
- HR and onboarding: coordinating repeatable multi-step processes across teams.
- Service delivery: clarifying dispatch, fulfillment, and customer-facing execution flows.
Best Practices
The following best practices help ensure workflow diagrams remain clear, readable, and effective for real-world execution.
Core design principles
- Clarity over completeness: include only steps that affect execution or decisions.
- Explicit ownership: each step must have a clear responsible role.
- Visible handoffs: transitions between roles must be easy to follow.
- Consistent flow direction: maintain a single reading direction (typically left to right).
- Controlled complexity: split workflows that exceed readable size into sub-process diagrams.
- Design for change: workflows should be easy to update as processes evolve.
To ensure these best practices are applied correctly, it’s important to evaluate whether a workflow diagram is clear, accurate, and usable in real conditions.
How to Evaluate a Workflow Diagram
A workflow diagram should be easy to follow, easy to validate, and clear enough for real execution. Evaluation helps confirm whether the workflow reflects the actual process, makes ownership visible, and supports improvement.
- Can a new team member follow the workflow without explanation?
- Are all handoffs clearly visible?
- Are approval and revision paths easy to identify?
- Is the main flow readable without crossing lines?
- Does each step have a clear owner?
- Does the workflow reflect the real process rather than an idealized version?
If the answer to any of these questions is no, the workflow should be simplified, split into sub-processes, or relabeled for clarity.
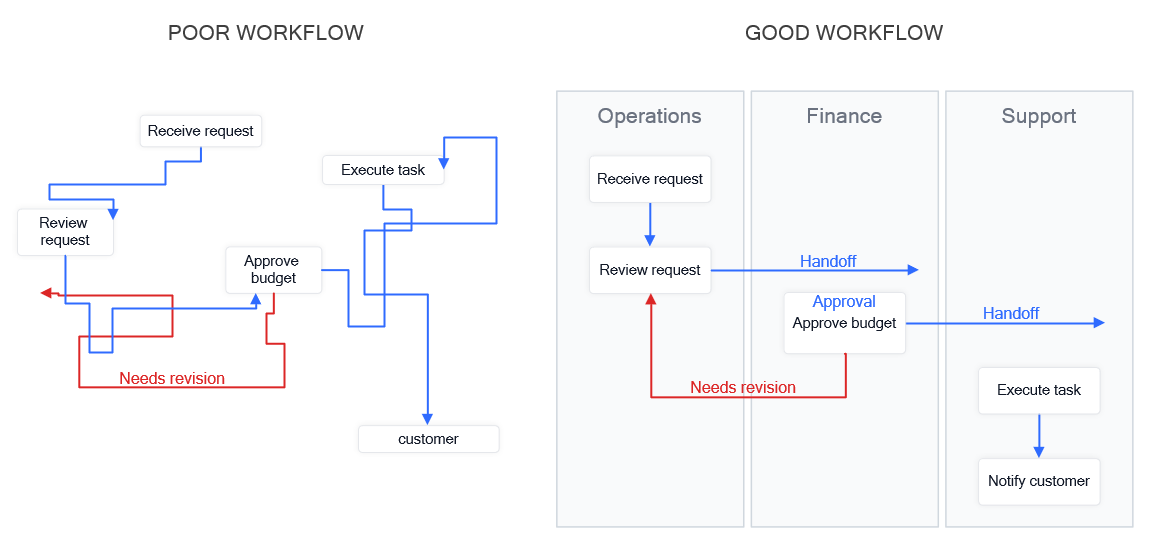
Comparison of a cluttered workflow versus a clear role-based workflow with structured handoffs.
Once the workflow is clear, the next step is to build and refine it using the right tool.
Workflow Diagram Tools and Templates
What to look for in workflow software
- Reusable libraries and templates
- Fast editing and review
- Export formats for docs and presentations
Ready to map your own workflow? Use a diagram tool with workflow-specific templates to build, test, and improve your process visually. Explore available workflow and flowchart software tools to choose the right fit for your needs.
Using workflow diagram tools
You can build and maintain workflows using dedicated diagramming tools with workflow-specific objects and templates that help standardize diagrams across a team and support workflow automation planning.
- ConceptDraw DIAGRAM — professional diagramming software for building workflow diagrams and process documentation.
- Workflow Diagrams solution — prebuilt templates and libraries for creating standardized workflows.
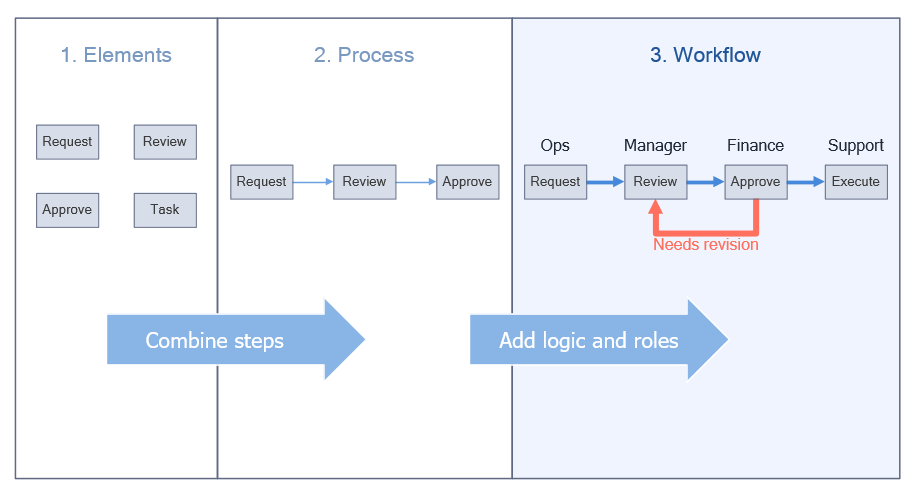
Step-by-step transformation from workflow elements to a structured workflow with ownership and execution flow.
Workflow Diagram Summary
A workflow diagram is most useful when a process depends on ownership, handoffs, approvals, and repeatable execution. It helps teams see how work actually moves, where delays occur, and how the process can be improved.
Use it when: you need to clarify execution across roles, standardize a recurring process, or prepare a workflow for optimization or automation.
FAQ
Is a workflow diagram the same as a flowchart?
This is one of the most common questions when comparing workflow diagrams and flowcharts in process modeling.
No. A workflow diagram emphasizes responsibility and handoffs; a flowchart emphasizes decision logic and branching.
How detailed should a workflow diagram be?
Detailed enough that someone new can follow the process without guessing. For complex work, split into linked sub-process diagrams.
How do I show approvals without decision symbols?
Use routing: an approved arrow continues forward, and a revision arrow returns to an earlier step. Label both routes.
What’s the difference between workflow and process flow?
Process flow focuses on sequence and inputs/outputs; workflow adds responsibility, handoffs, and operational routing.
What is the difference between a workflow diagram and a process map?
A workflow diagram shows execution, roles, and handoffs, while a process map provides a simplified high-level view of a process without detailed ownership or routing logic.
When should I use a workflow diagram instead of a swimlane flowchart?
Use a workflow diagram when the main goal is to show execution flow, ownership, approvals, and handoffs. A swimlane flowchart is a specific role-based layout that can be used to present that workflow more explicitly across departments or roles.