Made with
ConceptDraw
DIAGRAM 18

SDL — Systems Engineering

To make a SDL Diagram with help of ConceptDraw DIAGRAM diagramming and drawing application is much simpler, especially if you have the Specification and Description Language (SDL) Solution downloaded from ConceptDraw STORE.

Specification and Description Language (SDL) Solution

Example 1. Specification and Description Language (SDL) Solution in ConceptDraw STORE

A specification language is simply a formal language which is widely used in the computer science during conducting the requirements analysis, the systems analysis and the systems design for describing a system at a much higher level to compare to a programming language, known to be used for producing the executable codes for the systems.

All the specification languages are usually not directly executed. They are used for describing the issues, which are the answers to such question as “what?”. In case there is some requirement specification, which is cluttered with the implementation details known to be unnecessary, then it can be expected to be considered simple as an error.

The well-known fundamental assumption of most of the specification approaches is that programs are modelled as model-theoretic or algebraic structures, including a collection of sets of data values, as well as the functions over the mentioned sets. Such level of abstraction coincides with such point of view that the correctness of the input as well as an output behaviour of a program can take the precedence over all its other properties.

In the so called property-oriented approach to specification, the specifications of the programs are known to be consisting of the logical axioms, describing the properties that the functions have to satisfy. This approach is known to be opposite to the so-called “model-oriented specification” in such frameworks as Z and VDM, consisting of a simple realization of some particular behaviour which is nowadays required.

Specifications are expected to be the subject to such process, as a process of “refinement”. This process can be described as the filling-in one of the implementation details just before they are good enough to be implemented. The result of the described refinement process is a so called “executable algorithm”.

The mentioned algorithm is the one, which is either formulated in an executable subset of the specification language at hand or in some programming language. An important thing about the use of the specification languages which has to be mentioned is that it enables the creation of proofs of program correctness.

One of the kinds of the specification language is a Specification and Description Language (SDL). This language is targeted at the unambiguous description and specification of the behaviour of distributed and reactive systems.

SDL — Systems Engineering *

Example 2. SDL Diagram

Providing both textual Phrase Representation (SDL/PR) as well as a graphical Graphic Representation (SDL/GR), The Specification and Description Language is known to be very commonly used worldwide. The mentioned types of the representation — the graphic and the textual ones — are both equivalent representations of the same semantics.

The models within the mentioned language are usually represented in the graphical SDL/GR form, when SDL/PR is more often used for exchanging the models between different tools. Any system can be specified as a set of the interconnected abstract machines, known to be the extensions of the finite state machines, also known as “FSM”. Due to the language is formally complete, it can be used for code generation for either final targets or for a simulation.

The Specification and Description Language is known to be covering five main aspects: communication, structure, behaviour, inheritance and data. The behaviour of the components can be explained by partitioning the system into a series of hierarchies. The communication between the components can take place through gates which are all connected with help of the channels. These channels are known to be those of the delayed channel type, so such communication is usually expected to be “asynchronous”. In case, though, the delay is set to zero, then the communication may become “synchronous”.

The structure of the hierarchy level of Specification and Description Language is known to be the following: Library package, Block agent, System agent, Procedure type, Process agent, Architecture and Remote procedure. Any Specification and Description Language system is made of the functional blocks, each of which can be further decomposed in the so called “sub-blocks”. The lowest level block is known to be composed of one or more processes described as the finite state machines. The mentioned blocks are all connected with help of channels, as it was already mentioned before, and so these channels carry the messages, also known as “signals”, exchanged between different blocks. A block agent is known to be consisting of the process agents.

SDL Process Game

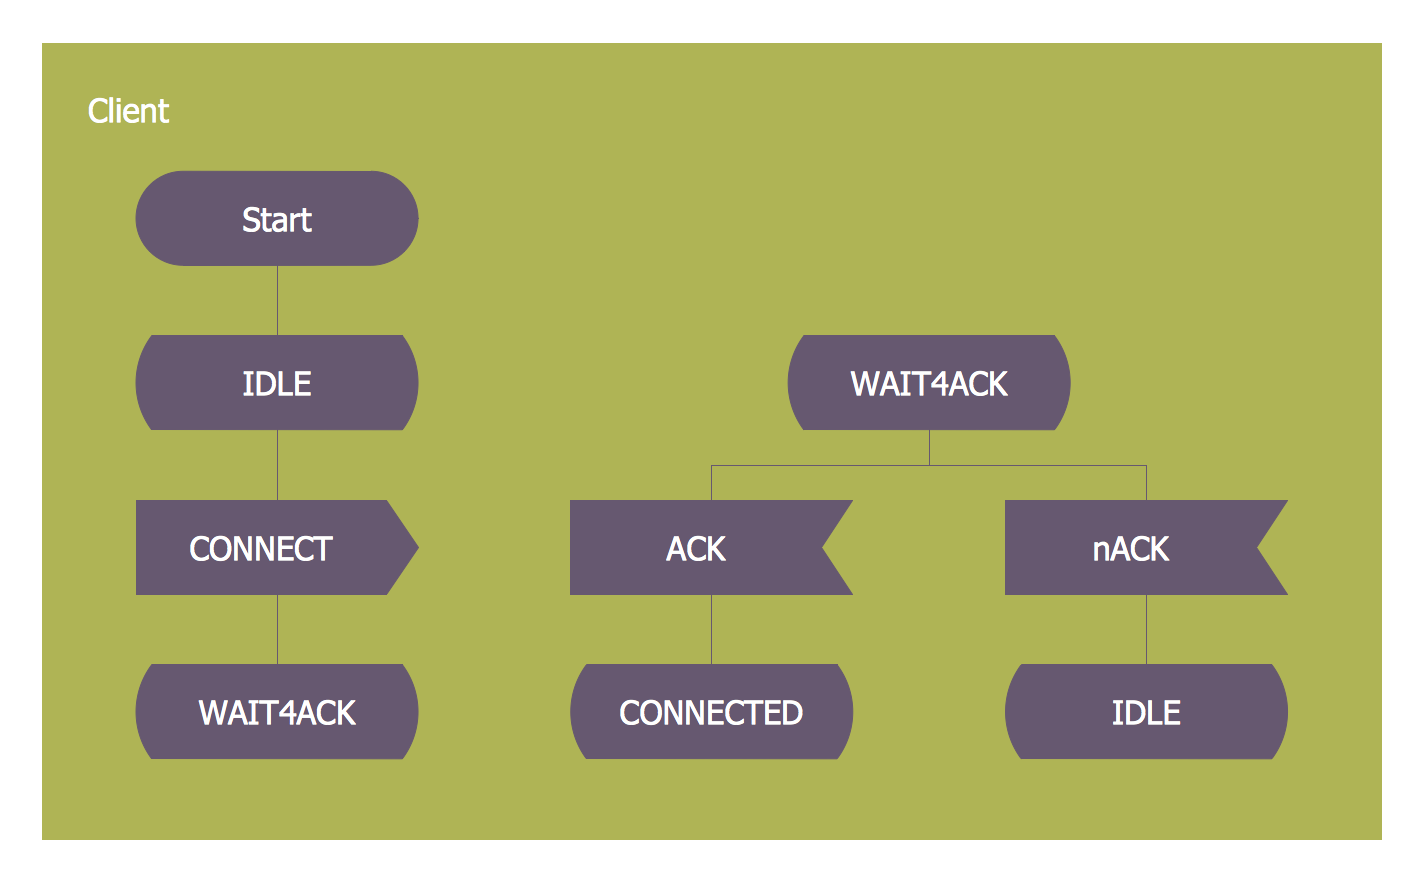
Example 3. SDL Process Game

Each of the process agents is simply a state machine which contributes to the action, which is carried out by the system itself. A message stimulus is known to be coming from the environment to an agent and it is known to be called as a “signal”. By the way, such message stimulus can also come from another agent as well. All the signals which are received by a process agent are all placed on the first place in a queue, which is also sometimes known to be called as the “input port”.

When the state machine is known to be waiting in a state, in case the first signal in the previously mentioned input port is enabled for that state, then it starts a transition, which is expected to be leading to the following states. Transitions are also known to be able to output the signals to the environment as well as to the other agents. Any process agent is known to be allowed to contain any needed procedure types, resulting in the same actions being able to get invoked from the different places. It is also important to mentioned that it is always allowed to call a remote procedure type in order to invoke a procedure in another agent (or sometimes in another system) and later to wait for a response.


TEN RELATED HOW TO's:
There are numerous articles about the advantages of flowcharting, creating business graphics and developing different charts. Nevertheless, these articles are almost useless without the main component - the examples of flowcharts, org charts and without a fine example, it is difficult to get all the conveniences of creating diagrams. You can find tons of templates and vivid examples on Solution Park. This illustration shows a variety of business diagrams that can be created using ConceptDraw DIAGRAM. It comprises a different fields of business activities: management, marketing, networking, software and database development along with design of infographics and business illustrations. ConceptDraw DIAGRAM provides a huge set of sample drawings including business process modeling diagrams,, network diagrams, UML diagrams, orgcharts, DFD, flowcharts, ERD, geographical maps and more.Examples of Flowcharts, Org Charts and More
Picture: Examples of Flowcharts, Org Charts and More
Related Solution:
The CCTV is the process that carried out using the video cameras for transmitting the signal to the specific location, on the limited set of monitors. We are talking about the video cameras that are used for monitoring on such guarded objects as airports, banks, stores, military objects, etc. CCTV equipment is also used in the industrial installations, for surveillance in the public places, for recording the video on the digital video recorders.CCTV Network Diagram Software *
Picture: CCTV Network Diagram Software
Related Solutions:
ConceptDraw PROJECT’s powerful reporting engine lets you generate a set of tabular reports with just one click, or visualize your project as Radial Tasks Structures, Work Breakdown Structures and Resource Calendars. It also provides you with dynamic Project Dashboards.How to Report Task
Picture: How to Report Task's Execution with Gantt Chart
There are many tools to manage a process or to illustrate an algorithm or a workflow. Flowcharting is one of those tools. However, it may be difficult to show complex processes that require multiple attributes or several people in a simple flowchart, so a cross-functional flowchart would be a solution for that situation. To create such flowchart, group processes and steps to labeled rows or columns, and divide those groups with horizontal or vertical parallel lines. It is worth mentioning that there are different types of cross-functional flowcharts, like opportunity or deployment flowchart. This diagram shows a cross-functional flowchart that was made for a trading process. It contains 14 processes, distributed through 5 lines depicting the participants who interact with the process. Also there are connectors that show the data flow of information between processes. The cross-functional flowchart displays a detailed model of the trading process, as well as all participants in the process and how they interact with each other. The lines in the flowchart indicates the position, department and role of the trading process participants.Cross-Functional Flowchart
Picture: Cross-Functional Flowchart
Related Solution:
Draw detailed Computer Network Diagrams, Designs, Schematics, and Network Maps with ConceptDraw DIAGRAM in no time! Pre-drawn shapes representing computers, network devices plus smart connectors help create accurate diagrams and documentation.Network Diagramming with ConceptDraw DIAGRAM  *
Picture: Network Diagramming with ConceptDraw DIAGRAM
Data flow diagrams are the graphical tool, used in the visualization of data flow of some data processing systems. It is the valuable process modeling tool. Also designing DFD is the important component of the initial part of any information system development project. The standard symbols are used to represent the interaction of a system components and how various kinds of components influence on data flow. The ConceptDraw Data Flow Diagrams solution is design to assist professional software engineers in making DFDs according to Gane and Sarson, and Yourdon and Coad notations. Do you imagine yourself as a successful IT specialist? To your mind, they all use data flow diagram examples to learn and to get inspired. Aren’t you still with us?Data Flow Diagram Examples *
Picture: Data Flow Diagram Examples
Related Solution:
Functional modeling allows to make complex business processes simple. One of the basic methods is IDEF0 and one of the most effective also. To create a business model, use flowchart symbols. The IDEF0 library, supplied with ConceptDraw IDEF0 Diagrams solution contains 18 IDEF0 basic notation symbols. All symbols are the vector graphic images what means, that one can customize their size preserving the stable quality. Another library of IDEF0 symbols can be find out in the the Business Process Diagrams solution, included to the Business Processes section of ConceptDraw Solution Park. These libraries composed from just vector objects and are totally compatible. You can apply the IDEF0 symbols from both libraries at your flowcharts, if needed.IDEF0 Flowchart Symbols
Picture: IDEF0 Flowchart Symbols
Related Solution:
ConceptDraw DIAGRAM diagramming and vector drawing software extended with Marketing Diagrams Solution from the Marketing Area of ConceptDraw Solution Park is the best software for quick and easy creating Marketing Flow Chart of any complexity and design.Marketing Flow Chart *
Picture: Marketing Flow Chart
Related Solution:
UML Use Case Diagrams are used to illustrate the structure of arbitrarily complex systems and illustrates the service consumer - service provider relationship between components.UML Use Case Diagram. Design Elements *
Picture: UML Use Case Diagram. Design Elements
Desbloquee el lenguaje de los diagramas de flujo con nuestra guía de símbolos de diagramas de flujo. 🔸 Todo lo que necesita saber sobre los conceptos básicos del diagrama de flujo, desde ✔️ puntos de decisión hasta ✔️ pasos del proceso, explore el significado detrás de cada símbolo y domine el arte de crear representaciones visuales claras y efectivas de sus procesos.Symboles Organigramme
Picture: Symboles Organigramme
Related Solution:
ConceptDraw
DIAGRAM 18